Investor Presentation - Q3 2017-18 March 2018 March 2018 - Nerolac
←
→
Page content transcription
If your browser does not render page correctly, please read the page content below
Investor Presentation
     Q3 2017-18
     March 2018

        March 2018
Disclaimer
This presentation may contain statements which reflect
management’s current views and estimates and could be
construed as forward making statements. The future involves
certain risks and uncertainties that could cause actual results
to differ materially from the current views being expressed.
Potential risks and uncertainties include such factors as
general economic conditions, foreign exchange fluctuations,
competitive product and pricing pressures and regulatory
developments.

                           March 2018
Agenda
  Business Environment FY 17-18*

  Financial Performance FY 17-18*

  Business Review FY 17-18*

  Risks and future outlook

*The details in the presentation are for the period April – December 2017

                                   March 2018
Business Environment 17-18
Recovery in business environment which was impacted due to
demonetization and implementation of GST
GDP growth on an upward trend in Q3
Decorative demand picked up in past 2 quarters after a largely good
monsoon across different regions
Industrial production has also picked pace
High inflationary trend for the last 3 quarters
On Global Front
Growth across nations
Firming of commodity prices
March 2018
Agenda
  Business Environment FY 17-18*

  Financial Performance FY 17-18*

  Business Review FY 17-18*

  Risks and future outlook

*The details in the presentation are for the period April – December 2017

                                   March 2018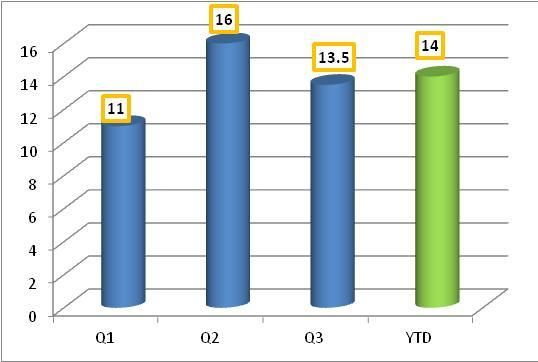
Financials
                        Q3 and YTD
                                                                   Rs. Million

                        Q3      Q3                 YTD     YTD
Standalone                                  % Gr                      % Gr
                       2017    2016                2017    2016
Gross Sales            12629   11105        13.7   38431   33691      14.1

Net Sales              11450   10085        13.5   34830   30576      13.9

PBDIT                  1923    1815         6.0    6209    5666        9.6

PBDIT % of Net Sales   16.8     18.0               17.8    18.5

PAT                    1252    1240         1.0    4106    3898        5.3

PAT % of Net Sales     10.9     12.3               11.8    12.7

                               March 2018
Growth Trend – Net Sales
(over LY same period)
March 2018Agenda
Business Environment FY 17-18*
Financial Performance FY 17-18*
Business Review FY 17-18*
Risks and future outlook
*The details in the presentation are for the period April – December 2017
March 2018Decorative 1718
Decorative Paints business registered double digit volume and
higher than market value growth
No Price increase in Q3
Cumulative price increase around 2.7%
Continued increase in Dealer Network
Launch of Nerolac Colour guide
Increased visibility of the Brand
Sponsoring of pre and post cricket match shows (Nerolac Cricket Live)
New TVC for Economy Range of Paints
Successful Marketing Campaigns with 2 IPL teams
March 2018Decorative 1718
Nerolac Cricket Live Aggressive Campaign for Economy Range
IPL Marketing Campaigns Nerolac Colour Guide
March 2018Industrial 1718
Double digit and higher than market volume growth in
automotive coatings
Capture of New Business and New CED lines led to further
increase in Market Share
Auto- refinish continues to grow at accelerated pace and
better than the market
Revival in Industrial Liquid and Powder segments with double
digit growth
March 2018International Operations 1718
Nepal
Higher than Market Growth in Nepal leading to continued
increase in Market Share
Lanka
Entire range introduced
More than 1000 Dealers registered and billed
March 2018Other Areas 1718
Received overall excellence award from Maruti
Received best vendor award from SML Isuzu in new product development
Successful transition to GST
Trial batches started at new plant, Saykha
Rise in crude oil accelerated the cost of raw materials leading to
Inflationary pressures
Tight availability of key raw materials continued
Purchase of SAP cloud platform license
March 2018Agenda
Business Environment FY 17-18*
Financial Performance FY 17-18*
Business Review FY 17-18*
Risks and future outlook
*The details in the presentation are for the period April – December 2017
March 2018Risk and Outlook
Raw material prices continue have an upward trend and
appropriate price revision expected
Short Term
Signs of improvement and double digit growth is expected
Long Term
Further improvement expected in conditions going forward
Good growth in the agriculture sector coupled with reduced interest
rates in the economy should provide necessary impetus for growth
March 2018Thank You March 2018
You can also read