IOL Chemicals and Pharmaceuticals Limited Investor Presentation August 2021

Page created by Michele Campos
 
CONTINUE READING
IOL Chemicals and Pharmaceuticals Limited Investor Presentation August 2021
IOL Chemicals and Pharmaceuticals Limited
          Investor Presentation
              August 2021
IOL Chemicals and Pharmaceuticals Limited Investor Presentation August 2021
Disclaimer

This information may contain certain forward-looking statements/details in the current scenario, which is

extremely dynamic and increasingly fraught with risks and uncertainties. Actual results, performances,

achievements or sequence of events may be materially different from the views expressed herein.

Investors/shareholders/public are hence cautioned not to place undue reliance on these statements/details, and

are advised to conduct their own investigation and analysis of the information contained or referred to in this

section be before taking any action with regard to their own specific objectives. Further, the discussion following

here in reflects the perceptions on major issues as on date and the opinions expressed here are subject to change

without notice. The Company under takes no obligation to publicly update or revise any of the opinions or forward-

looking statements expressed in this section, consequent to new information, future events or otherwise.

                                                                                                                      2
IOL Chemicals and Pharmaceuticals Limited Investor Presentation August 2021
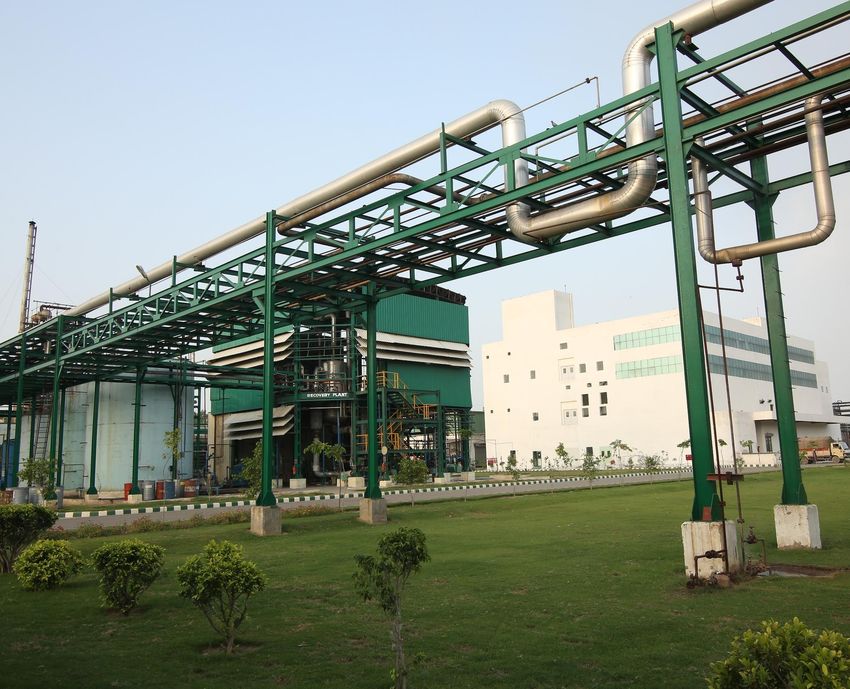
About IOL Chemicals and Pharmaceuticals Limited

                  Incorporated in 1986, IOLCP is one of the leading Pharmaceuticals company and is a significant player in the field
                                                          of specialty chemicals with world class facilities

                                                                                   Catering to the top-tier players across diverse important industries like
                                                                                   pharmaceuticals, ink industry, flexible packaging, adhesives, surface
                                                                                   coatings, flavours, paints & lamination and essences etc.

                                                                                   Captive co-generation unit with capacity of 17 MW to meet power and
                                                                                   steam requirements

                                                                    To be amongst the most admired companies in APIs, Intermediates and Specialty
                                                                    Chemicals globally.

      Values
We, at IOLCP, believe values bring character to any organization    To provide top quality products in APIs, Intermediates and Specialty Chemicals through
that help leaders to guide teams for a culture of excellence        continuous innovation and cutting-edge technology with due regards to safety and
through continuous improvements.                                    environment.

                                                                                                                                                         3
IOL Chemicals and Pharmaceuticals Limited Investor Presentation August 2021
Key Highlights

  Team size of 2,000+         Largest producer of      Largest producer of Ethyl    2nd Largest producer of     Over 20 products are
       employees             Ibuprofen and the only    Acetate at Single Location   Iso Butyl Benzene (IBB)     commercialised with 8
                            company worldwide being             in India            with ~30% Global share       products in pipeline
                            backward integrated with
                               ~35% Global share

  Debt free company,        Spread over a sprawling     Zero Discharge Effluent     Customer base across 80   Credit Rating: A+, outlook;
No debt raised since 2017   campus of over 100 acres       Treatment Plant                 countries             stable (Care Ratings
                                                                                                                       Limited)

                                                                                                                               4
IOL Chemicals and Pharmaceuticals Limited Investor Presentation August 2021
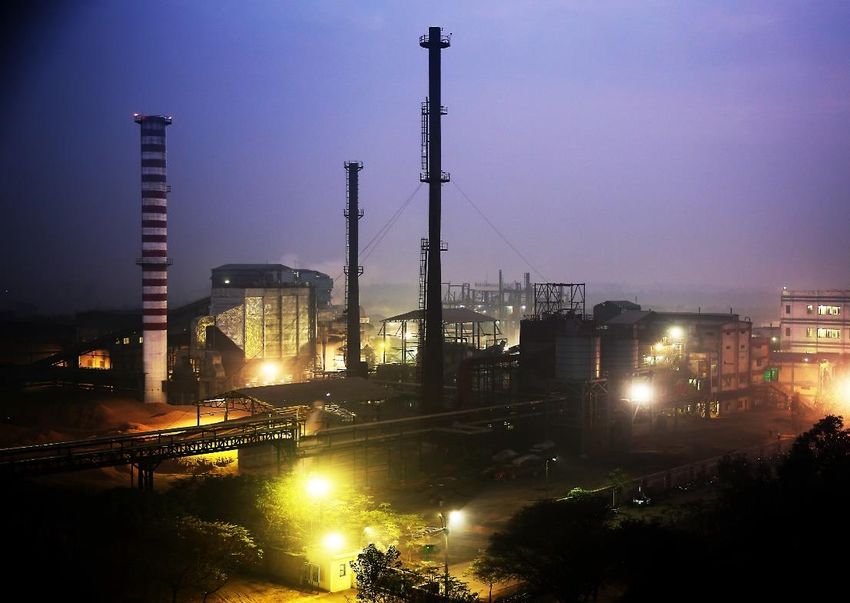
Professional Management Team

                        Mr. Varinder is an industrialist and has wide and rich                                  Mr.   Vikas   is    academically   equipped   with   the
                        experience of more than 35 years in the chemical &                                      knowledge and possesses organizational capacity. He
                        fertilizer industry and along with a comprehensive                                      has worked in strategic department of the company
                        approach and strong Pharma API industry oversight                                       and played a main role in guiding the Chemical and
                        has paved a way for innovation and excellence.                                          Pharmaceutical business of the company. He has
                                                                                                                been vital to the functioning of the company over
   Varinder Gupta                                                                           Vikas Gupta         the last 7 years.
 (Managing Director)                                                                     (Executive Director)

                        Dr. Sanjay is a seasoned global business executive                                      Mr. Kushal comes from a strong technical background
                        having worked in the specialty chemicals and                                            having done his Bachelor’s in Chemistry, Physics,
                        pharmaceutical      industry    for   over   25    years    in                          Math and Master’s degree in Chemistry. He has a rich
                        companies    like     Praj     Industries,   Dr.    Reddy’s,                            experience of over 30 years in the pharmaceutical
                        Aurobindo   among      few     others.       He    brings   a                           industry in companies like Morepen Laboratories,
                        demonstrated track record along with functional                                         Chemiplast Industries His expertise lies in looking
Dr. Sanjay Chaturvedi   expertise     in      Sales,      Marketing,       Strategy,     Kushal Kumar Rana      after quality assurance, quality control & corporate
   (Chief Executive     Manufacturing and R&D in USA and in India.                        (Director – Works)
                                                                                                                regulatory affairs.
       Officer)

                                                                                                                                                              5
IOL Chemicals and Pharmaceuticals Limited Investor Presentation August 2021
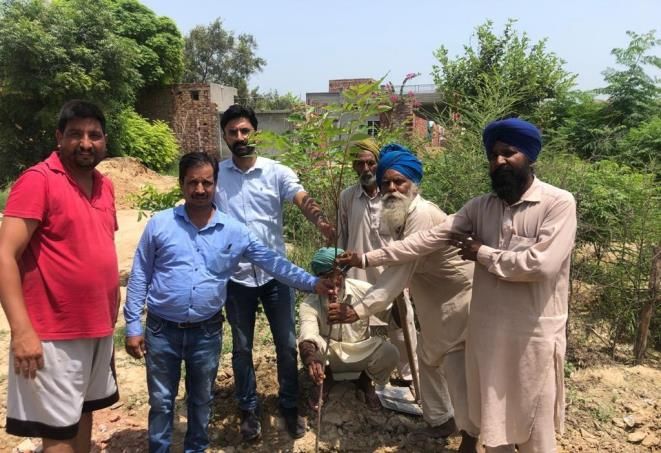
Experienced Independent Directors

           Rajender Mohan Malla                              Dr. Sandhya Mehta                                     Harpal Singh
           (Chairman and Independent                         (Independent Director)                             (Independent Director)
                   Director)
 • Mr. Rajender has very distinguished career      • Dr. Sandhya is working as the principal of   • Mr.   Harpal     has    had      over    35   year's
   of four decades.                                  Guru Nanak Institute of Management &           experience      of     banking     and    financial
 • He had held top and significant decision-         technology, Ludhiana and has vast 22 year      services.
   making    positions   in   Banks,   Financial     experience to her credit.                    • Most recently he was General Manager of
   Institutions & NBFCs.                           • She has published seven books in addition      Punjab National Bank and headed entire
 • In his most recent executive roles, he was        to numerous papers published in reputed        operations of bank in State of Punjab from
   MD & CEO of PTC India Financial Services          National & international Journals.             2010 to 2015.
   Limited (PFS), and prior to that CMD of
   IDBI.

                                                                                                                                                    6
IOL Chemicals and Pharmaceuticals Limited Investor Presentation August 2021
Our Journey

       Unit-08 & Unit-10*                                    Unit-06 for Pantoprazole                           Unit-03 for new
       for Multi Products                  2020                    (Dedicated)               2018                product facility           2012

                                   Unit-07 Metformin                                    Unit-04 Metformin                           Unit-02 for Ibuprofen
             2021                       (Dedicated)
                                                                   2019                    (Dedicated)
                                                                                                                    2016                (Dedicated)
                                                                                        Unit-05 Clopidogrel
                                                                                          & Fenofibrate

                                                                                        Unit-01 Ibuprofen
                                                                                           (Dedicated)                              Listing on NSE

Incorporated with                               Commenced Acetic                          Co-Generation                             Co-Generation

Acetic Acid Plant
                              1996                    Anhydride
                                                                          2000             Plant – 4MW
                                                                                                                   2009             Plant – 13MW

    1986                Commenced Ethyl               1999              Production of        2007             Commencement of          2010
                              Acetate                                     Ibuprofen                           IBB, MCA and Acetyl
                                                                                                                   Chloride

                                                                                                                                                      7
   *Unit-10 was commercialized in Q1FY22
IOL Chemicals and Pharmaceuticals Limited Investor Presentation August 2021
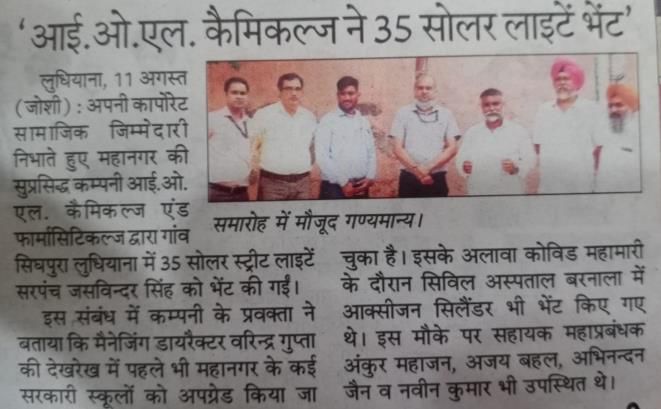
Certifications and Accreditations

Approved USFDA Ibuprofen             EUGMP Certification in              Certificate of Suitability             Certificate of Suitability
   facility since 2015,                  2013, 2017 &                         from EDQM for                          from EDQM for
   recertified in 2019               Recertification in 2020            IBUPROFEN, CEP No. 316-                  LAMOTRIGINE, CEP No.
                                                                                   2008                                 066-2013

 EDMF submitted to EDQM              Certificate of Suitability         ISO 9001:2015, 14001:2015
                                                                                                                 Certificate of Suitability
 for Clopidogrel Hydrogen                 from EDQM for                       & 45001:2018
                                                                                                                      from EDQM for
          Sulfate                   METFORMIN, CEP No. 188-
                                                                                                                Clopidogrel, CEP No. 006-
                                               2013
                                                                                                                           2019

                      WHOGMP (COPP) for               Written confirmation from
                                                                                          Certificate of Suitability
                     Ibuprofen, Metformin,              CDSCO for Ibuprofen,
                                                                                               from EDQM for
                    Lamotrigine, Fenofibrate           Metformin, Lamotrigine,
                                                                                         FENOFIBRATE CEP No. 075
                     & Clopidogrel, UDCA &             Fenofibrate Clopidogrel
                                                                                                    2018
                      Pantoprazole Sodium
                                                                                                                                              8
IOL Chemicals and Pharmaceuticals Limited Investor Presentation August 2021
Product
Segmentation

               9
IOL Chemicals and Pharmaceuticals Limited Investor Presentation August 2021
Business Segment – Pharmaceuticals

               IOLCP is the largest producer of Ibuprofen with ~35% Global share and the only company worldwide being
                          backward integrated for all Intermediates and Key Starting Material of Ibuprofen

                                            Among the largest                  Added more than 7 new          Product portfolio that
                                         producer of Metformin in          products in its API portfolio          caters to over 7
                                                   world                       basket in last two years        therapeutic category

                                                      Product application across various therapeutic areas

                                         Pain         Anti –         Anti –         Anti –        Anti –       Anti –          Proton
                                      Management     Diabetic       Platelet      Cholestrol    Convulsant   Cholelithic    Pump Inhibitor

                                                                                                                               10
Pharmaceuticals Product Portfolio – Commercialized & Pipeline

                    API - Commercialized                           API - Pipeline

                           Ibuprofen
                                                                   Fexofenadine
                      Ibuprofen Lysinate

                       Ibuprofen Sodium                         Quetiapine Fumarate

                        Dex-Ibuprofen
                                                                 Dextromethorphan
                        Metformin HCL

                Clopidogrel Bisulphate (Form II)                     Apixaban
                     Pantoprazole Sodium

                   Fenofibrate (Micronised)                         Mesalazine

                          Gabapentin
                                                                     Nebivolol
                          Lamotrigine

                     Ursodeoxycholic Acid                            Lisinopril

                      Losartan Potassium
                                                                     Valsartan
                        Levetiracetam

                                                                                      11
Business Segment – Specialty Chemicals

            IOLCP first commenced manufacturing Ethyl Acetate in 1996, with a starting capacity of 3000 tonnes per annum. Today, the Company
            has grown this business to become the largest single location plant in India, with a production capacity of 100,000 tonnes per annum.

                                                India’s second largest      IBB, MCA and Acetyl       Captive consumption of    Asia’s first continuous
                                                manufacturer for Iso          Chloride are key        Mono Chloro Acetic Acid   dual technology (green
                                                 Butyl Benzene (IBB)        starting materials for    with 7,200 TPA capacity    chemistry) plant for
                                               with ~30% global share            Ibuprofen                                         MCA and Acetyl
                                                                                                                                       Chloride

                                                                    Product application across diversified industries

                                                  Food          Flexible       Pharma          Chemical      Textiles     Ink      Paints     Pesticides
                                                Processing      Packaging                    Intermediate

                                                                                                                                                  12
Product wise Segmentation – Quarterly

                        Q1 FY22                            Q4 FY21                       Q1 FY21

                                                                                             270.0
                                       153.9                                                  58.0%
                                                                     169.3
                                        29.3%                         36.3%

             307.5                                 243.9
             58.7%                                 52.3%
                                         62.8
                                                                                150.2
                                        12.0%                         53.4       32.2%             45.7
                                                                     11.4%                         9.8%

                                                                              Other Pharma
                                       Chemicals            Ibuprofen
                                                                                Products

                                                                                                          13
All figures in INR crs unless stated
Manufacturing Facility spread across over 100 acres with GMP approved guidelines

        API manufactured in batch manner and                                                                                  Facility is coupled with ISO class-8 HVAC
        intermediates & Specialty chemicals in                       Dedicated blocks involved in manufacturing               system, PSA Nitrogen & Purified water along
        continuous product delivery manner based                     of APIs                                                  with 127 MTPH steam generation capacity
        on DCS technology                                                                                                     with multiple boilers

        Manufacturing facilities involves – Reactions,               Four stage treatment zero discharge ETP,                 Dedicated decentralized utilities from -20 to
        Filteration, Centrifugation, Drying, Blending                solvent recovery plants & EHS cell as a part             275 deg.C temp and dedicated co-
        & Sieving, Micronization operation                           of the facility                                          generation plant of 17MW

Research & Development

                                                   Working      on     generic
      R&D facility is in action                    molecules     with   latest                   DSIR approved facility for                 In-house development              of
      24*7                                         equipment & techniques for                    research & development                     multi step products
                                                   process development

                                                                                                                                                                  14
Our Core Sustainability Pillars

                                                                                                                    Solar Lights donated by IOLCP

• Strive   to   minimize   the   adverse    impact   on   • Construction and renovation of school locations,

  environment, health and Safety by upgrading               provided technical equipment for smart education

  technology, optimum utilization of resources and        • Primary healthcare including sanitation

  minimizing effluent / waste generation.                 • Disaster relief by eradicating hunger, poverty and

• Complying with the applicable statutory and legal         malnutrition                                            Plantation activity conducted
  requirements     and     providing   safe    working    • Community development by setting up old age                  by IOLCP in Barnala

  environment / work place by imparting training to         homes and community mentally retarded home

  all employees.                                          • Protection of art and culture

• Spread awareness about the EMS and Process Safety       • Plantation in villages for restoration to environment

  and necessary PPE.                                      • Trust/Contribution

                   Environment                                Corporate Social Responsibility

                                                                                                                                              15
Financial
Overview

            16
Key Financial Summary

     Financial
     Summary                                        Q1FY22   Q4FY21   Q1FY21
     (INR Cr)

       Total Income                                  524      467      466

        Gross Profit                                 189      189      218

           EBITDA                                    116      117      158

              PAT                                     67       75       128

                                                                               17
All Profits and Total Income include Other Income
5 years Financial Performance - Annually
Revenues & Margins* – Annual                                                                            Margin* Expansion – Over the Years

     2,000                                                          1,910         1,991         50%      50%                Gross %
     1,800                                         1,696                                        45%      45%                              45%
                                                                                   45%                                12%
     1,600                                                          44%                         40%      40%
                                                                                                                                                                EBITDA %
     1,400             33%                             38%          31%            31%          35%      35%   33%
                               30%                                                                                                                                           31%
     1,200                                          25%                                         30%      30%                                              16%
                                    990                                            22%                                                                                                                  PAT %        22%
     1,000                                                                                      25%      25%
                                                                    19%
      800        712                                                                            20%      20%
                                                    14%                                                                                                                                           21%
                                    13%                                                                                                            15%
      600                                                                                       15%      15%
                15%
      400                                                                                       10%      10%
                                    3%
      200        1%                                                                             5%        5%
                                                                                                                                                                                            1%
        0                                                                                       0%        0%
                FY17               FY18              FY19           FY20           FY21                        FY17           Incr.      FY21      FY17           Incr.      FY21          FY17         Incr.        FY21
               Total Income            Gross Profits %         EBITDA %          PAT %

  Segmental EBIT %                                                                                      Debt/Equity
                                                                                                       1,400         2.4                                                                                                2.5
     45%                                                           43%                           20%
                                                                                    39%
     40%                                                                                         18%   1,200                              2.0
                                                                                                                                                                                                                        2.0
     35%                                               32%                                       16%
                                                                                                       1,000
                                                                                                 14%
     30%                                                                                                                                                                                                                1.5
                                                                                          12%    12%    800
     25%
                19%                                                                              10%    600
     20%                                                                                                                                                                                                                1.0
                              14%                                                                8%
                                                                                                                                                                0.6
     15%                                                                                                400
                                                  5%                                             6%
                                                                                                                                                                                                                        0.5
     10%                                                                    4%                   4%     200
                                                                                                                                                                                    0.1                    -
       5%                     1%                                                                 2%
                                                                                                          0                                                                                                             0.0
       0%                                                                                        0%              FY17                    FY18               FY19                   FY20                  FY21
                FY17               FY18             FY19             FY20           FY21
                                    Pharma(LHS)              Chemicals (RHS)                                                      Debt (INR Crs)          Equity (INR Crs)                Debt/Equity

                                                                                                                                                                                                                18
*All Profits and Total Income include Other Income
Quarterly Financial Performance

             Revenues & Margins*
               800                             46.7%                                                                                                    50%
               700                                                                               40.5%
                                                                                                                                            36.1%       40%
               600                             33.9%
                                                                                                                                         524.2
               500                         465.9                                          466.6
                                                                                                                                                        30%
               400                                                                        25.2%
                                               27.4%                                                                                            22.1%
               300                                                                                                                                      20%

               200                                                                               16.1%
                                                                                                                                                12.8%   10%
               100
                 -                                                                                                                                      0%
                                         Q1FY21                                          Q4FY21                                         Q1FY22
                             Total Income                      Gross Profits %                     EBITDA %                     PAT %

             Segmental EBIT %
                 45%                                                                                                                                    30%
                                       44.1%
                 40%                                                                                                                                    25%
                 35%
                                                                                       29.7%                                                            20%
                 30%                                                                                                               15.5%
                                                                                                                                                        15%
                 25%                                                                     14.8%                                          22.7%
                                                                                                                                                        10%
                 20%
                                       5.4%
                 15%                                                                                                                                    5%

                 10%                                                                                                                                    0%
                                          Q1FY21                                          Q4FY21                                         Q1FY22
                                                                      Pharma (LHS)                            Chemicals (RHS)
                                                                                                                                                              19
*All Profits and Total Income include Other Income; PAT for Q1FY22 includes Exceptional Items
Geographical Segmental Breakup – Annual & Quarterly

                In INR crs

                                                                                           500
      1,600
                                                                                           450    435
      1,400                                                           1,354
                                                        1,250                              400
      1,200
                                          1,038                                            350
                                                                                                             318
                                                                                                                         300
      1,000                                                                                300

        800                                                                                250
                              633                 647           644           613
                                                                                           200
        600                                                                                                                    160
                 484
                                                                                                                   143
                                                                                           150
        400                         350
                        227                                                                100          83
        200
                                                                                            50
           -                                                                                 0
                     FY17      FY18         FY19          FY20          FY21*                      Jun-21     Mar-21      Jun-20

                                                                              Domestic   Export

                                                                                                                                     20
*FY21 Covid Impact
Financial Summary – Balance Sheet

Balance Sheet (INR Crs)             FY17    FY18    FY19    FY20     FY21

Shareholder's Funds                 188.7   215.7   474.3   813.5    1260.4

Debt                                446.5   421.9   284.0    56.0     0.0

Other Long Term Liabilities         17.2    33.6    20.8     79.7     59.1

Other Current Liabilities           165.1   180.9   162.8   220.6    290.6

Equity & Liabilities                817.5   852.1   941.9   1169.8   1610.1

Fixed Assets                        395.1   412.6   438.7   488.2    560.6

Other Non Current Assets             8.8    14.8    15.1     10.7     27.2

Non Current Assets                  403.9   427.4   453.8   498.9    587.8

Investments                          0.1     0.1     0.1     0.1      1.2

Cash & Bank Balances                16.8    17.3    29.6    154.7    364.7

Other Current Assets                396.7   407.3   458.4   516.1    656.4

Current Assets                      413.6   424.7   488.1   670.9    1022.3

Assets                              817.5   852.1   941.9   1169.8   1610.1

                                                                              21
Financial Summary – Statement of Profit and Loss

   P&L (INR Crs)                 FY17         FY18         FY19          FY20          FY21         Q1FY22     Q4FY21       Q1FY21
   Revenues                        710.6        983.3        1,685.3       1,894.5      1,967.0        518.5      460.4        460.1
   Other Income                         1.3          6.3          10.4          16.0      24.3           5.7        6.2          5.8
   Total Income                   711.9        989.6        1,695.7       1,910.5       1,991.3        524.2      466.6        465.9
   Gross Profits                  234.5        294.4          648.5         845.5        888.4         189.2      188.9        217.7
   Gross Profits %*                32.9%        29.7%         38.2%         44.3%        44.6%         36.1%      40.5%        46.7%
   EBITDA                         103.4        125.9          420.0         589.9        616.1         115.9      117.4        157.9
   EBITDA %*                       14.5%        12.7%         24.8%         30.9%        30.9%         22.1%      25.2%        33.9%
   Depreciation                     29.8         30.2             32.5          35.7      38.9          10.3       10.0          9.4
   EBIT                            73.6         95.7          387.6         554.2        577.2         105.6      107.4        148.5
   EBIT %*                         10.3%         9.7%         22.9%         29.0%        29.0%         20.1%      23.0%        31.9%
   Interest                         67.7         64.4             51.4          20.9          5.8        1.8        1.4          1.8
   Earnings before exceptional
                                    5.9         31.3          336.2         533.3        571.4         103.8      106.0        146.7
   items and taxes
   Exceptional Items                      -            -             -             -            -       13.9            -            -
   Taxes                                1.2          3.6          99.5      172.0        126.8          22.9       30.7         19.2
   PAT                              4.7         27.7          236.7         361.3        444.6          67.0       75.3        127.5
   PAT %*                           0.7%         2.8%         14.0%         18.9%        22.3%         12.8%      16.1%        27.4%

                                                                                                                                 22
Shareholder Information

 Stock Data       (As on 30th June, 2021)                                                                  Shareholding Pattern (%)
        Market Capitalization (₹)                            3,569Crs                                                                                         49.6% 51.2%
                                                                                                           43.7% 43.7%
        Face Value(₹)                                           10

        Share Price (₹)                                        608.1

        EPS (₹)                                                11.4

        52-Week High (₹)                                       898.4                                                               6.7%     5.1%

        52-Week Low (₹)                                        516.3
                                                                                                            Promoter               Institutional                Others
        Symbol(NSE/BSE)                                 IOLCP | 524164
                                                                                                                               Q1FY21        Q1FY22

                                                             IOLCP 5 Years Stock Price vs Sensex
  700

  600

  500

  400

  300

  200

  100

   0
   08-16   11-16     02-17   05-17   08-17   11-17   02-18    05-18    08-18   11-18     02-19     05-19   08-19   11-19   02-20    05-20     08-20   11-20     02-21    05-21    08-21

                                                                                 IOLCP           Sensex
                                                                                                                                                                                 23
Thank You
      For further details:
Mr. Pardeep Kumar Khanna , CFO
Email: pardeepkhanna@iolcp.com
  Phone: +91-161-2225531-35
You can also read