Ion Torrent RNA-Seq Analysis with NextGENe Software v2.30 and above
←
→
Page content transcription
If your browser does not render page correctly, please read the page content below
Ion Torrent™ RNA-Seq Analysis with
                                   NextGENe® Software v2.30 and above
March 2012                                                                                                John McGuigan, Lisa Wang, CS Jonathan Liu

Introduction
Ion Torrent™ semiconductor sequencing technology is fundamentally different from most other sequencing. It is a “post-light”
technology because it doesn’t depend on detection of light emission from nucleotide incorporation. Instead, it uses a silicon chip
containing millions of individual pH meters. Its flow-based approach detects pH changes caused by release of hydrogen ion during
incorporation of unmodified nucleotides in DNA replication. The rapidly improving throughput of these sequencing chips including
the soon-to-be-released Ion Proton™ sequencer makes it very useful for transcriptome studies.

Due to reference sequence difficulties associated with alternative splicing and fusion genes, alignment of RNA-seq data is more
challenging than alignment of DNA sequences. Short reads- especially those that fall within large exons- are able to align normally
since they will generally match the reference with very few mismatches. Reads that span an exon-exon junction are more difficult
because they must be split at the correct position and each part of the read must align correctly. Fusion genes provide even more of a
challenge because the partial reads can align almost anywhere in the genome.

Different solutions to these challenges have been implemented in various software packages. Q-PALMA uses a machine learning algorithm
and training datasets in order to identify splice junctions [1]. SuperSplat divides sequence reads at multiple positions and tries to find
mapping sites where the sub-reads are separated by an intron in a certain size range[2]. TopHat is a software package that first finds potential
exons based on coverage and then finds splice sites and links using canonical splice site sequence information [3]. NextGENe uses a novel
algorithm to correctly align reads belonging to annotated and novel transcripts while providing the added benefit of a highly graphical
interface that doesn’t require use of scripting or the command line. Analysis can be performed on a desktop PC in just a few hours without
any training datasets or pre-filtering of the reads.

NextGENe’s unique RNA-Seq alignment algorithm and viewer are greatly improved starting in v2.30. The update provides better
results (more aligned reads) and more intuitive display of splicing variants. The improvements are demonstrated here with an Ion
Torrent 318 chip RNA-Seq dataset (C18-199) which is available on the Ion Torrent Dev community website. The improved transcript
view can be seen in figure 1.

Figure 1: The new RNA-Seq Transcript View. The purple links and exons are known, the blue links are novel, and the orange exons are
alternative splicing.

                                        SoftGenetics LLC 100 Oakwood Ave. Suite 350 State College, PA 16803 USA
                                                         Phone: 814/237/9340 Fax 814/237/9343
                                                    www.softgenetics.com email: info@softgenetics.com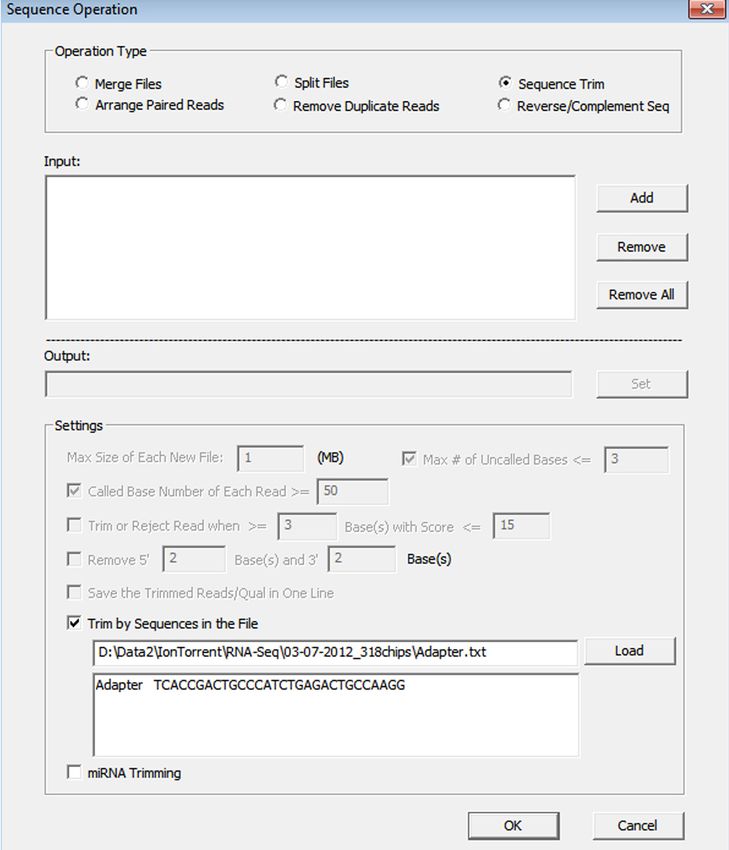
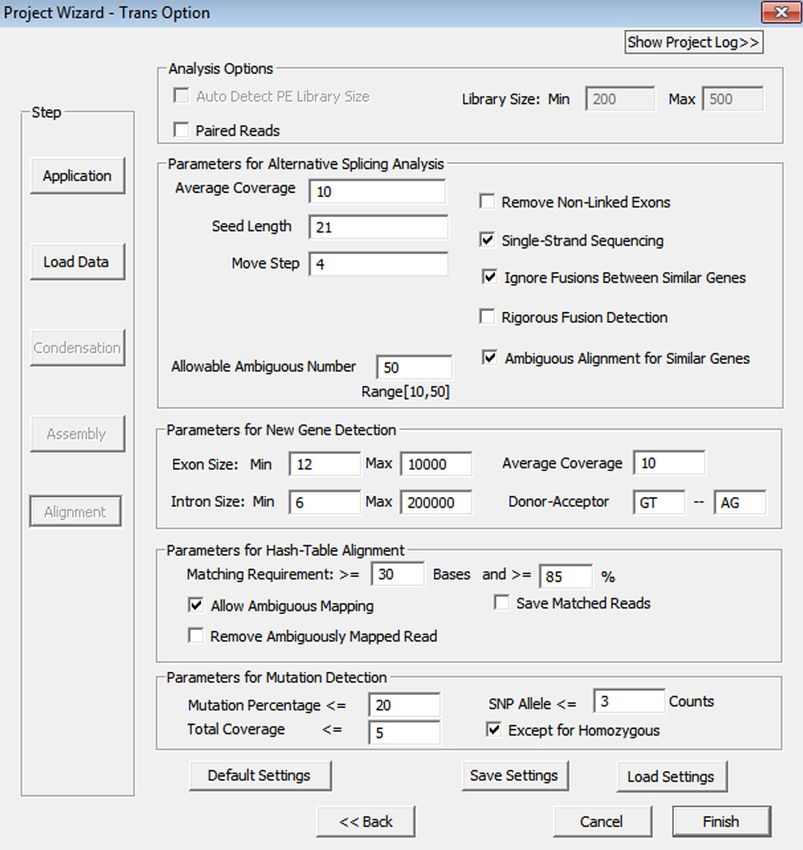
Methodology
NextGENe’s approach takes advantage of previously-known isoform splice sites that still allows for detection of novel transcripts. The
RNA-Seq application has a few main steps:
 1. Align reads to the genome– either GBK files (
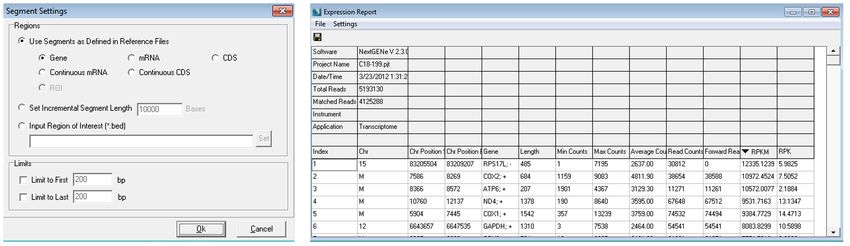
Figure 3: Transcriptome Alignment Settings

Results
5,193,130 of 5,384,713 reads were converted successfully (96.44%). Only 466 reads needed to have the adapter sequence removed.
Alignment results are summarized in table 1.

                                Table 1: Alignment Results (run on a 16-core computer, 16 GB of RAM used)
Discussion
When the project is first opened in the viewer, the mutation report view is shown. The mutation report details all of the called variants,
and the expression report (figure 4) is also available- it lists several different expression measurements for the sample. Most of the genes
with the highest expression (sorted by RPKM) were part of the mitochondrial genome.

                       Figure 4: Expression report settings and the expression report for this sample sorted by RPKM

                                       SoftGenetics LLC 100 Oakwood Ave. Suite 350 State College, PA 16803 USA
                                                        Phone: 814/237/9340 Fax 814/237/9343
                                                   www.softgenetics.com email: info@softgenetics.com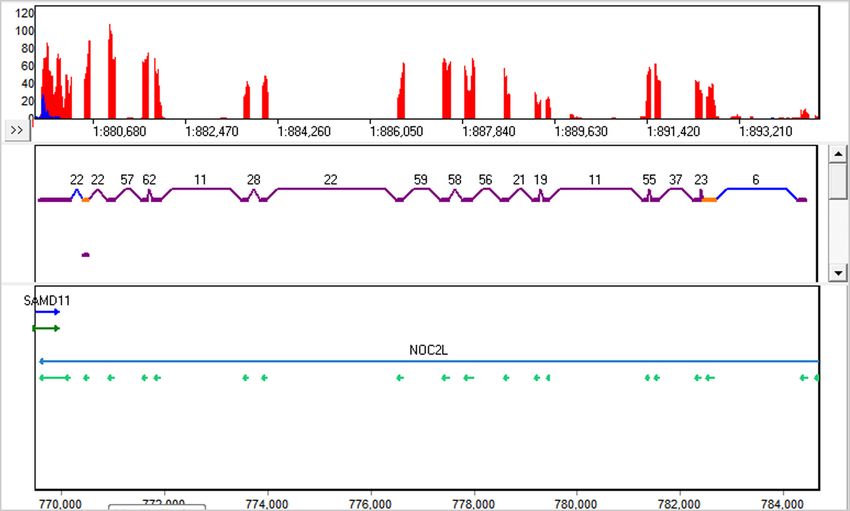
In the transcript view it is possible to view the discovered exons and links. The NextGENe viewer can toggle between the mutation
detection view and the transcript view with the push of a button:         . The splicing events that were detected are color-coded for quick
and simple identification while browsing:
  • Link Types – links connect locations where a read was split for alignment
    - Purple = Known (annotated) link
    - Blue = Novel link (doesn’t match any annotated links)
    - Black = Fusion link (links together two different genes)
  • Node Types – nodes are regions (often exons) where reads aligned (or didn’t align, in the case of deletions).
    - Purple = Known exon
    - Blue = Novel exon in an unannotated region (possible new gene)
    - Red = Intron Retention or Insertion
    - Pink = Exon Skipping
    - Orange = Alternate Splice Site (exon is longer or shorter than annotated)
    - Gray = Alternative Start/Stop (the first or last exon in a gene is alternatively spliced at the edge of the gene) or anti-sense
      transcription for single-strand sequencing
The transcript report has many detailed, flexible filters (figure 5). When a reference is built from gbk files, the known annotation can be
even more detailed- ncRNAs, mRNA, tRNA, etc are annotated separately instead of in an inclusive “Annotated RNA” group.

                                                       Figure 5: Transcript Report Filters

Many genes were found to have normal splicing, including the highly expressed mitochondrial genes which are not spliced (figure 6) and the
mitochondrial ribosomal protein L9 (MRPL9) which is a reverse-strand gene with 7 exons (figure 7).

                                             Figure 6: Expression of the Mitochondrial Genes

                                                         Figure 7: MRPL9 Expression

                                       SoftGenetics LLC 100 Oakwood Ave. Suite 350 State College, PA 16803 USA
                                                        Phone: 814/237/9340 Fax 814/237/9343
                                                   www.softgenetics.com email: info@softgenetics.com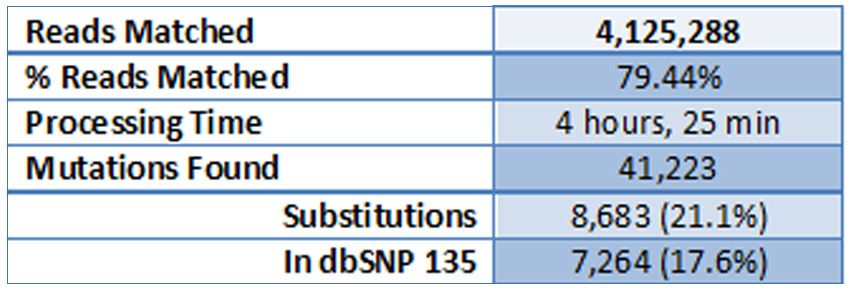
NextGENe was able to align reads in unannotated regions to detect possible new genes (figure 8).
Figure 8
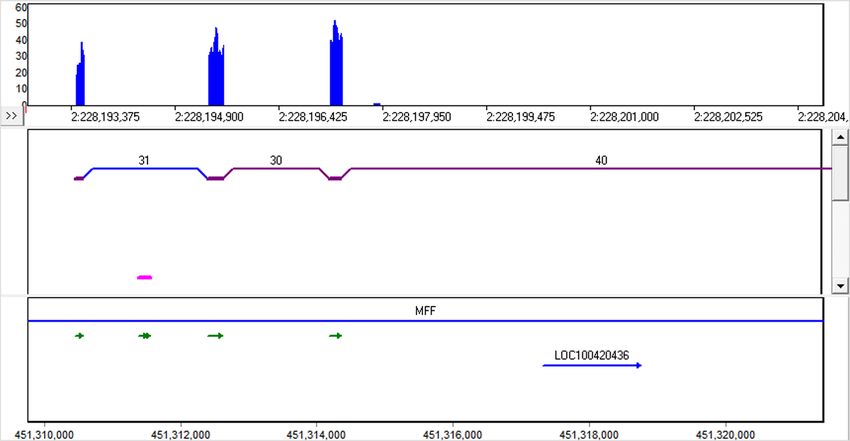
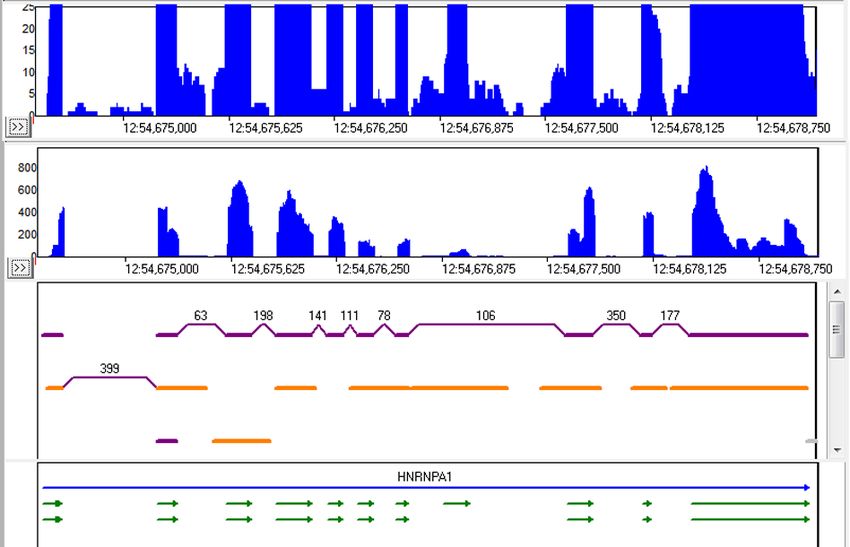
The scale of the local coverage graph can be adjusted, allowing for investigation of low-frequency alternative splicing, such as in the
HNRNPA1 gene (figure 9). In this gene the alignment indicated that some transcripts expressed less than 5% of the time had alternatively
spliced exons (orange).
Figure 9
Alternative transcript start and stop sites are reported and highlighted in gray. One example is shown in figure 10. Premature stop sites
are often caused by low coverage of the 5’ end of the gene.
Figure 10
SoftGenetics LLC 100 Oakwood Ave. Suite 350 State College, PA 16803 USA
Phone: 814/237/9340 Fax 814/237/9343
www.softgenetics.com email: info@softgenetics.com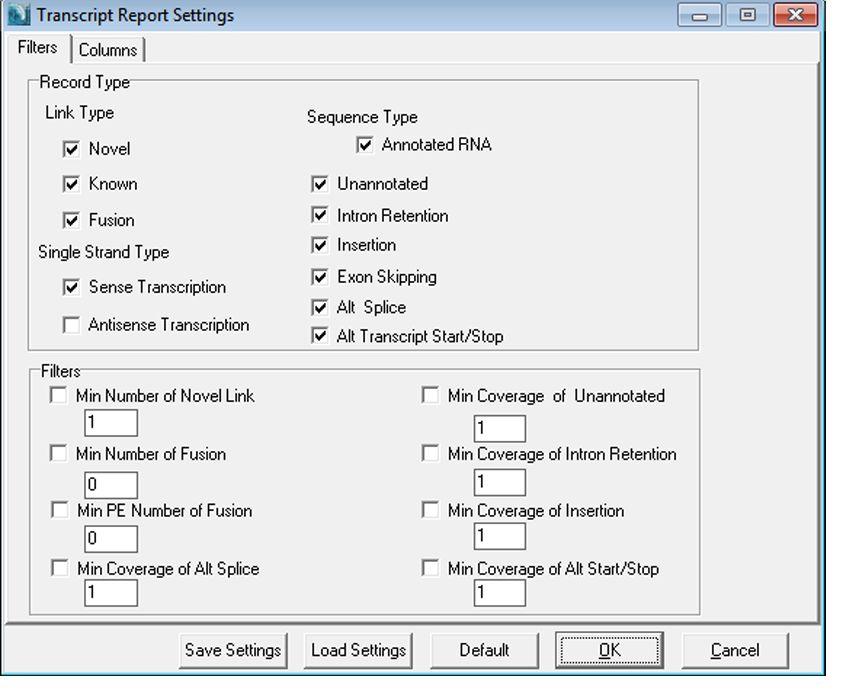
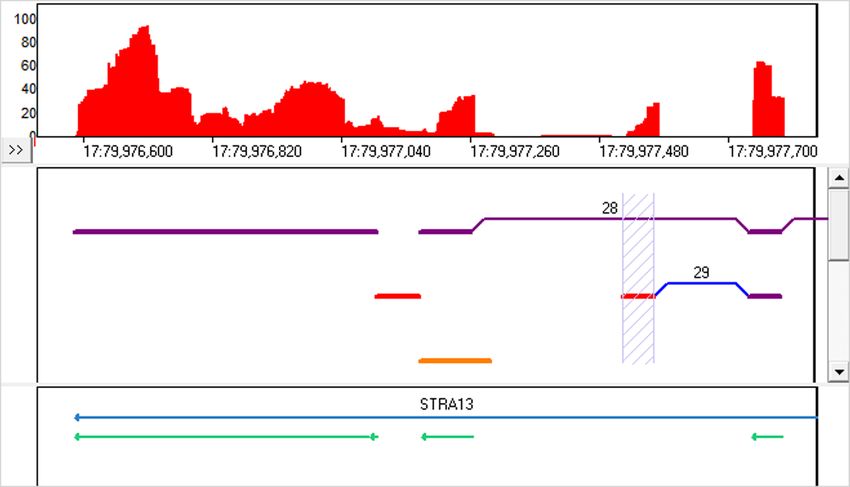
Figure 11 shows an example of intron retention and partial intron retention (called as “insertion”) in the STRA13 gene.

                                                                   Figure 11

Figure 12 shows an example of exon skipping. The skipped exon is highlighted in pink, which the previously unannotated link over the
exon is marked as novel (blue).

                                                                   Figure 12

References
References
 1. Fabio De Bona et al., “Optimal spliced alignments of short sequence reads,” Bioinformatics 24, no. 16 (2008): i174 -i180.
 2. Douglas W. Bryant et al., “Supersplat—spliced RNA-seq alignment,” Bioinformatics 26, no. 12 (June 15, 2010): 1500 -1505.
 3. Cole Trapnell, Lior Pachter, and Steven L. Salzberg, “TopHat: discovering splice junctions with RNA-Seq,” Bioinformatics 25, no. 9
    (May 1, 2009): 1105 -1111.

                                      SoftGenetics LLC 100 Oakwood Ave. Suite 350 State College, PA 16803 USA
                                                       Phone: 814/237/9340 Fax 814/237/9343
                                                  www.softgenetics.com email: info@softgenetics.com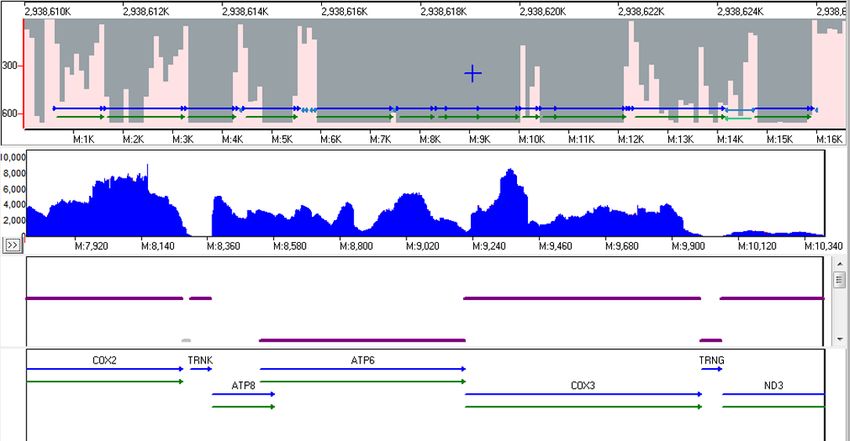
You can also read