Iowa Section of the American Society of Civil Engineers - INFRASTRUCTUREREPORTCARD.ORG/IOWA | iowaasce.org
←
→
Page content transcription
If your browser does not render page correctly, please read the page content below
Iowa Section of the American Society of Civil Engineers
INFRASTRUCTUREREPORTCARD.ORG/IOWA      | iowaasce.org
Aviation                               C-       Levees			                                   C
Pages 6-12                                      Pages 42-45

Author: Michelle Riedinger                      Author: Steve Sampson Brown
Title: Structural Engineer                      Title: Project Manager
Firm: Shive-Hattery                             Firm: City of Dubuque - Engineering Department

Bridges                                D+       Parks, Recreation, & Trails C
Pages 13-19                                     Pages 46-55

Author: Dave Mulholland                         Author: Della Caldwell
Title: Transportation Engineer                  Title: Civil Engineer
Firm: Iowa Department of Transportation         Firm: MMS Consultants, Inc., Iowa City

Dams                                   D        Rail				                                   C+
Pages 20-25                                     Pages 56-60

Author: Aaron Gwinnup, PE                       Author: Edward Sowder
Title: Project Manager                          Title: Project Engineer
Firm: HR Green, Inc.                            Firm: Calhoun-Burns and Associates, Inc.

Drinking Water                         C        Roads				 C+
Pages 26-31                                     Pages 61-69

Author: Charles N. Kahlsdorf, PE/PMP            Author: Aaron Moniza, PE
Title: Principal Engineer                       Title: Senior Client Manager
Firm: Bolton & Menk, Inc.                       Firm: Foth Infrastructure & Environment, LLC

Energy                                 C+       Solid Waste			                              B
Pages 32-37                                     Pages 70-75

Author: Brian Boelk                             Author: Aaron Granquist, PE
Title: Principal                                Ttile: Project Manager | Client Service Manager
Firm: Axiom Consultants, LLC                    Firm: HR Green

Inland Waterways                       D+       Wastewater                                  C-
Pages 38-41                                     Pages 76-81

Author: Stephanie Then                          Author: Dave Claman
Title: Water Resources Engineer                 Title: Transportation Engineer Manager
Firm: HDR, Inc.                                 Firm: Iowa Department of Transportation

                                            2
INFRASTRUCTUREREPORTCARD.ORG/IOWA

                                                              About the 2019 Infrastructure Report Card
                                                              for Iowa
                                                              A committee of the American Society of Civil
                                                              Engineers – Iowa Section assessed all relevant data
                                                              and reports, consulted with technical and industry
                                                              experts, and assigned grades using the following key
                                                              criteria:

                                                                   Capacity:
                                                                   Does the infrastructure’s capacity meet
                                                                   current and future demands?
                                                                   Condition:
                                                                   What is the infrastructure’s existing and near-
                                                                   future physical condition?
                                                                   Funding:
                                                                   What is the current level of funding from all
Executive Summary                                                  levels of government for the infrastructure
The condition of Iowa’s infrastructure has a very real             category as compared to the estimated funding
impact on every person and business in the state. All              need?
Iowans depend on roads, bridges, aviation, rail, water             Future Need:
infrastructure, energy systems, wastewater removal,                What is the cost to improve the infrastructure?
and recreation facilities. The condition of these                  Will future funding prospects address the
essential infrastructure elements directly impacts                 need?
Iowans’ quality of life, opportunities, and future.
                                                                   Operation and Maintenance:
The 2019 Infrastructure Report Card for Iowa                       What is the owners’ ability to operate and
was created to help Iowans understand the state’s                  maintain the infrastructure properly? Is the
infrastructure. The Report Card provides a snapshot                infrastructure in compliance with government
for residents and policymakers to engage in                        regulations?
conversation about current conditions and where                    Public Safety:
Iowa needs to be. In their research and review,                    To what extent is the public’s safety jeopardized
the authors of the Report Card concluded much                      by the condition of the infrastructure and what
of Iowa’s infrastructure is old and outdated with                  could be the consequences of failure?
significant concerns over resilience. The authors
hope this information provides the insight needed to               Resilience:
start that conversation and ignite action to improve               What is the infrastructure system’s capability
these 2019 grades and, as a result, the state’s future.            to prevent or protect against significant multi-
                                                                   hazard threats and incidents? How able is it
The expert civil engineers who developed the Report                to quickly recover and reconstitute critical
Card understand not only the fundamentals of                       services with minimum consequences for
infrastructure but also how the condition of these                 public safety and health, the economy, and
elements impacts daily living for Iowans. As civil                 national security?
engineers, their job is to plan, design, construct, and            Innovation:
maintain our infrastructure networks. They are eager               What new and innovative techniques, materials,
to help continue the conversation about current                    technologies, and delivery methods are being
conditions as well as provide solutions.                           implemented to improve the infrastructure?
                                                          3
2019 Infrastructure
  Report Card for Iowa                                                   GPA
         Aviation                            C-                Levees			                                C

         Bridges                             D+                Parks, Recreation, & Trails C

         Dams                                 D                Rail				                                C+

         Drinking Water                       C                Roads				 C+

         Energy                              C+                Solid Waste			                           B

         Inland Waterways                    D+                Wastewater                              C-

Grading Scale                                                   Mediocre, Requires Attention
                                                                The infrastructure in the system or network
      Exceptional, Fit for the Future                           is in fair to good condition; it shows
      The infrastructure in the system or network               general signs of deterioration and requires
      is generally in excellent condition, typically            attention. Some elements exhibit significant
      new or recently rehabilitated, and meets                  deficiencies in conditions and functionality,
      capacity needs for the future. A few                      with increasing vulnerability to risk.
      elements show signs of general deterioration
      that require attention. Facilities meet                   Poor, at Risk
      modern standards for functionality and are                The infrastructure is in poor to fair condition
      resilient to withstand most disasters and                 and mostly below standard, with many
      severe weather events.                                    elements approaching the end of their
                                                                service life. A large portion of the system
      Good, Adequate for Now                                    exhibits significant deterioration. Condition
      The infrastructure in the system or network               and capacity are of serious concern with
      is in good to excellent condition; some                   strong risk of failure.
      elements show signs of general deterioration
      that require attention. A few elements                    Failing/Critical, Unfit for Purpose

                                                           F
      exhibit significant deficiencies. Safe and                The infrastructure in the system is in
      reliable, with minimal capacity issues and                unacceptable condition with widespread
      minimal risk.                                             advanced signs of deterioration. Many of
                                                                the components of the system exhibit signs
                                                                of imminent failure.
                                                       4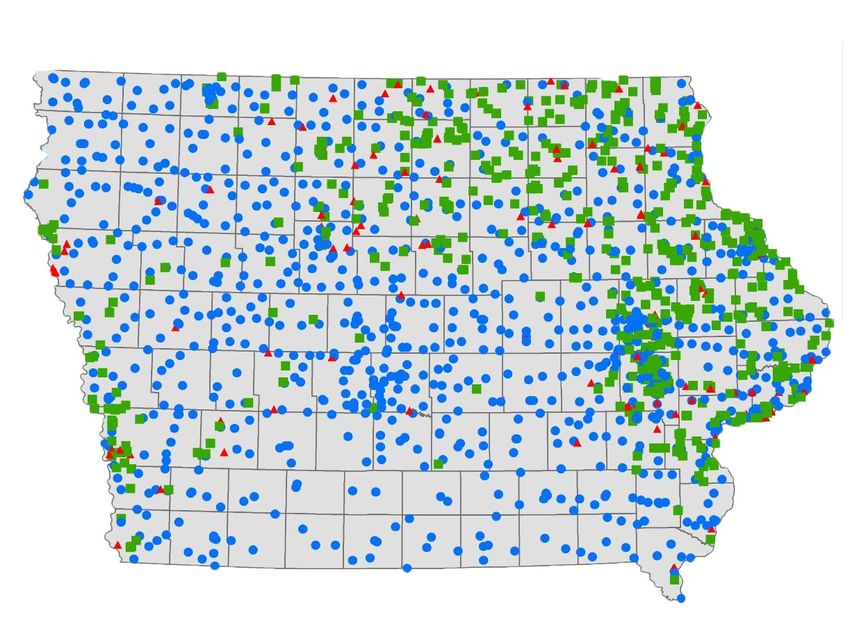
Solutions to Raise the Grade
Infrastructure = Economy
Our location in the center of the nation and our networks of inland waterways, railways and roadways are important
to Iowa’s economy, helping deliver goods to world markets at competitive prices. The needs of aging systems as
well as adding capacity and service for demand will require increased and sustainable investment.
Innovative And Sustainable Funding Solutions
Funding for roadway and bridge infrastructure projects have historically been paid for with proceeds from gas
and diesel taxes. As hybrid and electric vehicles become more common, the amount generated by these taxes
will decrease. While gas and diesel taxes can provide enough revenue today, alternate funding methods must be
pursued in the near future, before the funding losses become significant. Further, indexing the gas tax to inflation
to keep up with rising costs is essential as well.
Prioritize Public Health and Safety
“Safety First” must be the approach to all of Iowa’s infrastructure decisions. Integrated asset management is
the critical first step in developing a foundation for safe and reliable infrastructure in Iowa. Safety can further
be improved by properly maintaining Iowa’s infrastructure. Proactive investment in infrastructure yields savings
down the line and ensures the health and welfare of Iowans.
Proactive and Innovative Planning
The backbone of our state’s infrastructure was built 50 to 100 years ago. As rural dynamics shift, upgrades are
necessary for modernization, resiliency, and to meet the needs of its changing users. Unique strategies, emerging
technologies, and research and development is needed to help optimize the rural transportation network, to
understand and account for shifting and social economic trends, and to help stretch the limited funding available.
Subject 2019 Grade 2015 Grade Change
Aviation C- C- -
Bridges D+ D+ -
Dams D D -
Drinking Water C C+
Energy C+ C
Inland Waterways D+ D
Levees C C-
Parks, Recreation, and Trails C Not Graded -
Rail C+ C
Roads C+ C-
Solid Waste B B+
Wastewater C- C- -
5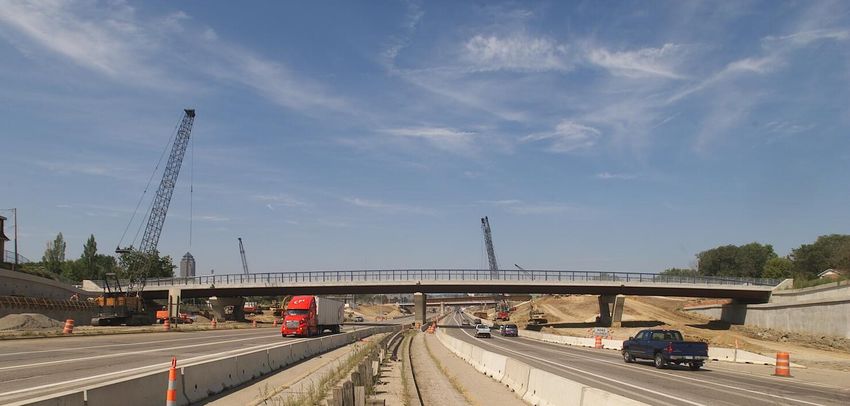
Capacity and Accessibility
                                                             Capacity is defined by the FAA as the hourly
              AVIATION                                       throughput that an airport’s runways are able to
                                                             sustain during periods of high demand. Nationally,
                                                             air carrier, general aviation, and local civil operations
                                                             activity is projected to increase 4.2%, 0.2%, and
Executive Summary                                            1.8% respectively over the next 20 years. Air carrier
Iowa’s air transportation system is performing               traffic is defined as aircraft with more than 60 seats
sufficiently, provides adequate infrastructure for           and is anticipated to be the largest growth as larger
demand, and maintains safe operating conditions.             aircraft replace smaller regional aircraft. In Iowa, the
However, pavement improvements have not kept up              fleet of aircraft is anticipated to increase from an
with needs, resulting in a decline in overall pavement       estimated 2,900 in 2015 to approximately 3,600 in
condition. Additionally, improvement in the areas            2030.
of safety and resiliency are necessary, as only about
one-half of Iowa airports meet targets in these areas.       As demand increases for air carrier traffic, general
Between 2012 and 2017, an annual average of $41              service airports that can support larger aircraft than
million was invested in Iowa airport infrastructure.         basic service airports become more critical. The
While funding is being used for maintenance and              Sioux County Regional Airport recently opened
improvement, the overall condition of airport                to support larger aircraft than the existing Orange
infrastructure has not significantly improved.               City and Sioux Center airport could support. As
                                                             business grew in the area, the demand outgrew the
Background                                                   existing airport. As commercial aircraft get bigger,
Aviation has a significant economic impact in Iowa.          aging commercial aviation facilities may struggle
Not only does aviation increase the efficiency of            to accommodate larger aircraft and the associated
productivity for private sector businesses, it also          larger number of passengers arriving on aircraft.
contributes to approximately $200 million annual             General aviation facilities, which support emergency
increase in agricultural productivity. Additionally,         preparedness and response, community access, and
aviation activities in Iowa support an estimated             agricultural and aerial surveying, remain key parts
47,000 jobs.                                                 of the aviation system. Federal funding of general
                                                             aviation airports in the past has been less than users
Iowa has 116 public use airports: eight commercial           spend on the facility.
services, 100 publicly owned general aviation
airports, and eight privately owned airports. All meet       Airports in Iowa serve a wide range of consumers
requirements for public use. Of the 108 publicly             and degrees of demand. A classification system
owned airports, 79 are listed on the Federal Aviation        was established, in the Iowa Aviation System Plan,
Administration (FAA) National Plan of Integrated             to identify facilities and services required to ensure
Airport Systems (NPIAS). NPIAS identifies airports           continued performance of airports in Iowa. Service
that contribute to a safe and efficient national             criteria can range from airport attendants, restroom
system of airports. Inclusion in NPIAS provides the          facilities, to internet access. This classification system
opportunity to receive funding through the FAA               can also be used to review performance of airports.
Airport Improvement Program (AIP).                           The five classifications of airports are:

The Iowa Department of Transportation (DOT) -                     Commercial Service – support scheduled
Office of Aviation oversees certification of airports             commercial airline service and require the
for public usage, while the FAA sets many of the                  infrastructure and services to support a full
guidelines for safe airport operation.                            range of general aviation activities. Additionally,
                                                                  they serve as important transportation and
                                                                  economic centers.
    AVIATION                                             6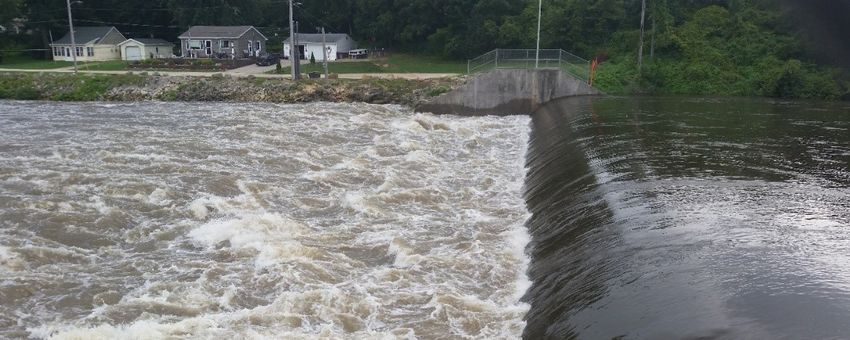
Enhanced Service – runways 5,000 feet or                 drive of a commercial or enhanced service airport,
    greater in length that can support general                both of which meet DOT accessibility performance
    aviation activity including most business jets.           measures.
    These airports serve business and public aviation         Figure 1: 100% of Facility Targets Met
    and are regional transportation centers and               100%
    economic catalysts.
                                                               90%
    General Service – runways 4,000 feet or greater            80%
    in length that can support general aviation
    activity including small to mid-size business              70%
    jets. These airports are an economic asset to              60%
    their communities, they are usually staffed
    during regular business hours and generate                 50%
    local business and employment opportunities in             40%
    training, charters, and aircraft maintenance and
    repair. They serve as a community economic                 30%
    asset.                                                     20%

                                                                10%
    Basic Service – runways 3,000 feet or greater
    in length that support local aviation.                       0%
                                                                      Commercial Enhanced   General    Basic     Local
    Local Service – Support local aviation with few                     Service   Service   Service   Service   Service
    or no services.
                                                                      Meets all Targets       Not Meeting all Targets
Facility and service targets are established to help
airports ensure they meet the needs of their users.
Meeting all the targets is not a requirement for              Operations, Condition, and Maintenance
inclusion in a service category, but they do provide          All airports must maintain facilities, hangers, and
a suggested level of service or quality of facility to        runways to maintain satisfactory performance. One
meet the needs of each consumer group. Targets                key indicator of maintenance and pavement health
are separated into four categories: airside facilities,       is Pavement Condition Index (PCI). The Iowa DOT
landside facilities, services, and planning. Table 1          has set the Critical PCI for runways at 65, 60 for
lists targets for each service category including             taxiways, and 55 for aprons. Pavement with a PCI
highlighted requirements for inclusion in a category.         of 65 to 100 that does not exhibit significant load
                                                              related distress can be maintained with preventative
The most recent assessment of airports in Iowa found          maintenance such as crack sealing, surface
that 61% of airports meet 100% of facility targets,           treatments and preventing vegetation growth in
including two commercial service airports that do             cracks. Pavements with a PCI of 40 to 65 may require
not meet 100% of the facility targets. Figure 1 shows         major rehabilitation, such as an overlay. When PCI
the breakdown of airports meeting 100% of facility            is less than 40, typically reconstruction is the only
targets; 70% of airports meet at least 75% of service         viable approach due to the substantial damage to
targets.                                                      the pavement structure. Of Iowa’s primary runways,
                                                              77% have a PCI of 70 or greater. This has decreased
Iowa’s airports are sufficiently accessible from both         since the 2015 Report Card; however, 20 airports
ground and air transportation methods. Most Iowans            indicated improved PCI ratings from the 2015
are within a 120-minute drive to a commercial                 Report Card, including eight that improved from
service airport, and 71% are within a 30-minute               being below 70 to going above 70.

    AVIATION                                              7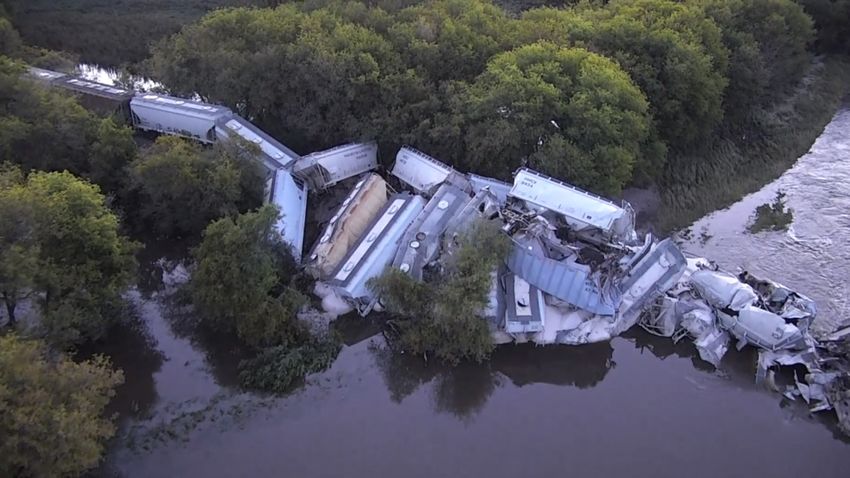
Table 1: Targets for Each airport Service Category
                            Commercial Service/           General Service             Basic Service
     Description                                                                                            Local Service Targets
                             Enhanced Targets                Targets                    Targets

 Airport Reference Code               C-II                        B-II                  B-I or below                 A-I

 Primary Runway Length        Minimum 5,000 ft            Minimum 4,000 ft                3,000 ft             Not an objective

 Primary Runway Width           Minimum 100 ft              Minimum 75 ft             Minimum 60 ft             Minimum 50 ft

                                                            Turnarounds
 Type of Parallel Taxiway         Full parallel         meetnstandards (both           Exits as needed         Not an objective
                                                               ends)
    Type of Runway
                               Vertical guidance             Non-precision                 Visual                   Visual
       Approach

    Runway Lighting                  MIRL                        MIRL                       LIRL               Not an objective

    Taxiway Lighting                  MITL                       MITL                 Not an objective         Not an objective

 Visual Guidance Slope       Both runway ends (or
                                                           Both runway ends           Not an objective         Not an objective
        Indicator                    ILS)

 Runway End Indentifier      Both runway ends (or
                                                           Both runway ends           Not an objective         Not an objective
  Lights - as required               ILS)

    Rotating Beacon                    Yes                         Yes                      Yes                Not an objective

 Lighted Wind Indicator     Yes - multiple as needed               Yes                If open for night        If open for night

     RCO Facilities              Tower or RCO               Not an objective          Not an objective         Not an objective

                              Crosswind runway or        Crosswind runway or
   Wind Coverage or
                             95% wind coverage for      95% wind coverage for         Not an objective         Not an objective
   Crosswind Runway
                                NPIAS facilities           NPIAS facilities

    Covered Storage          100% of based aircraft     100% of based aircraft      100% of basedaircraft      Not an objective

  Overnight Storage for     Typical average aircraft/   Typical average aircraft/
                                                                                      Not an objective         Not an objective
   Business Aircraft         business user demand        business user demand

                             100% of average daily      100% of average daily       50% of average daily
     Aircraft Apron                                                                                            Not an objective
                                 transients                 transients                  transients

 Terminal/Administration
                                       Yes                         Yes                  Waiting area           Not an objective
        Building

  Paved Entry/Terminal
                                       Yes                         Yes                Not an objective         Not an objective
        Parking

    AVIATION                                                       8
Public Safety and Resilience                                  As previously discussed, many airports have height
There are a number of safety and security items               zoning ordinances, but only 43% have land planning
airports should maintain. A key safety concern                use plans in place with local counties or cities.
is obstructions, which are tall, fixed objects
that encroach on runway approaches. Typical                   In addition to obstructions, emergency response and
obstructions can include trees, power poles, and              security planning have an impact on public safety.
buildings. A majority, 60%, of airports have clear            While having an emergency response and security plan
approaches on at least one end of primary runway. In          is a planning target for all classifications of airports,
2010, only 36% of airports had clear approaches on            51% of Iowa airports have emergency response plans
both ends of runways, but this was an improvement             and 66% have security plans. Commercial airports
from 2004. Ordinances are being implemented to                are required to have such security plan, and the
prevent future construction of obstruction, with              DOT has been working to supply general aviation
zoning ordinances in place at 80% of Iowa airports.           airports with a template to develop a security plan.
Height ordinances not only work to protect those              Developing and implementing emergency response
flying out of the airport, but also the public by             and security plans will support resiliency of airports
preventing construction of large or tall buildings            by preventing incidents and efficiently handling if
close to airports. Existing obstructions are identified       one were to occur.
and evaluated as potential hazards, and from there,
hazards are removed or runway thresholds must be              Funding and Future Need
reestablished. Obstructions that are not deemed a             Commercial aviation has rebounded in recent years
hazard may be marked or lit.                                  and is anticipated to continue to grow after a decline
                                                              following the September 11, 2001, terrorist attacks as
Airports in Iowa are also working with local                  well as the 2008 and 2009 recessions. The biggest
communities to enact land use planning to                     anticipated growth is in general aviation, as smaller
maintain safe operation and meet facility targets.            jet aircraft has become feasible for more companies.

 Photo 1: Aviation in Iowa (Photo Credit: Iowa Department of Transportation)

    AVIATION                                              9
Additionally, with growing security and processing                significantly improved and continued maintenance
time for commercial flights, companies are looking                and improvements are needed to continue safe
toward company or charter flights as a practical                  operation of airports and provide new infrastructure
alternative to transport people and goods.                        as demand increases.

Airport infrastructure is funded by federal, state,               In addition to typical recommended maintenance,
local, and private sources. The State Aviation Fund,              airports may also identify specific infrastructure
established in 2008, includes revenue from aircraft               needs in capital improvement plans and long-range
registration and aviation fuel taxes. This fund provided          needs assessment. The total estimated funding need
approximately $3.8 million for airport projects and               is approximately $820 million over the next 20 years
statewide safety initiatives in 2018. As part of the fuel         to meet needs that include maintaining PCI ratings,
tax increase for roads, the jet fuel tax increased by 2           as well as meeting facility, service, and planning
cents per gallon in 2015. Airport sponsors are tasked             targets, and performing annual maintenance. The
with maintaining safe operating conditions and often              largest category of need is airside development,
must match federal or state grants for projects. All              which includes pavement maintenance and runway
eight commercial airports are approved to collect a               construction. As seen in Figure 2, general and
Passenger Facility Charge (PFC) for use on FAA                    commercial service airports have the highest funding
approved projects. PFC funds are generated for                    needs totaling about $511 million. One potential
individual commercial airports which makes more of                funding source could be a state implementation of
the AIP funds available for non-commercial airports.              passenger facility charge for commercial flights as
Between 2012 and 2017, an annual average of $41                   well as larger craft flying from enhanced service or
million was invested in Iowa airport infrastructure               general service facilities. Funding could be spread
- $38 million from federal sources and $3 million                 among the facilities for maintenance as well as capital
from state sources. While funding is being used for               improvement and projects identified in long-range
maintenance and improvement at many airports, the                 needs assessment. With increased funding at these
overall condition of airport infrastructure has not

                                                                  6%
                                                                           7%

                                              35%
         Local Service                                                                              General Service
         $48,007,723                                                                                $233,881,770
                                                                             23%
         Basic Service                                                                              Commercial Service
         $53,020,685                                                                                $277,613,598

         Enhanced Service                                   30%
         $179,259,745

                         Figure 2: 2011-2030 Future Project Needs by Airport Role
                                 Source: 2011-2016 CIP plans, LRNA plans, Mead & Hunt

                                                            10
facilities, more money from the state aviation fund and automatic building controls can maintain the
could be allotted to basic and local service facilities. temperature of buildings with decreased dependence
on outside energy sources and improved maintenance
Innovation of temperature while building is unoccupied. Light
NextGen is the FAA-led modernization of the air emitting diode (LED) lights are being installed in
transportation system. The key focus is incorporating buildings and there is ongoing investigation into
satellites to provide more accurate, real time incorporation of LED applications in runway lighting.
information to pilots and air traffic controllers,
which will provide safer and more efficient travel.
NextGen system implementation began in 2007
and is targeted for completion in 2025. Most of the
foundational infrastructure has been implemented,
and supplemental features are being developed and
implemented now.
As sustainable practices and responsible energy
consumption becomes more emphasized, airports
look to incorporate green building design as part
of facility upgrades. Geothermal heating/cooling
Photo 2: Aviation in Iowa (Photo Credit: Iowa Department of Transportation)
11Recommendations Resources
To maintain the airport system in Iowa: Uses and benefits of aviation in Iowa (2009 Economic
Impact report): https://iowadot.gov/aviation/aviation-in-
Pavement management activities and iowa/aviations-impact-on-iowas-economy
inspection should remain at the current Iowa Aviation System Plan 2010-2030: https://iowadot.
schedule. Maintenance should push to a more gov/aviation/studiesreports/systemplanreports
accelerated schedule to improve condition
before complete pavement repair is required. FAA National Plan of Integrated Airport Systems: https://
www.faa.gov/airports/planning_capacity/npias/
At a minimum, funding must continue, if not
increase, for maintenance. FAA Terminal Area Forecast, FY 2017-2045: https://www.
faa.gov/data_research/aviation/taf/media/taf_summary_
fy_2017-2045.pdf
Investigate state PFC for commercial and
business aircraft or other funding source Sioux County Regional Airport Open for Business: https://
to secure money for maintenance and www.ksfy.com/content/news/Sioux-County-Regional-
improvements at commercial, enhanced, and Airport-open-for-business-500543591.html
general service airports.
Iowa airports hope to land millions in state funding: https://
www.radioiowa.com/2019/03/04/iowa-airports-hope-to-
Identify, evaluate, and remove obstruction at
land-16-5-million-in-state-funding/
runway approaches.
General Aviation Airports: A national asset: https://
Increase the quantity of airports, focusing www.faa.gov/airports/planning_capacity/ga_study/
particularly on the commercial, enhanced, and media/2012AssetReport.pdf
general service airports that meet 100% of
the state aviation system plan facility targets, About the DOT; Aviation Funding: https://iowadot.gov/
identified for commercial service, enhanced about/AviationFunding
service, general service, basic service, and local Office of Aviation; State Funding Programs: https://
service airports in Table 1. iowadot.gov/aviation/airport-managers-and-sponsors/
State-Funding/state-funding-programs
Ensure funding is secured on a state and
federal level for continued implementation of Airport Improvement Program (AIP) Grand Histories:
NextGen system. https://www.faa.gov/airports/aip/grant_histories/#history
NextGen: https://www.faa.gov/nextgen/where_we_are_
Provide incentive or requirement for inclusion
now/
of green building construction and building
systems when state and federal funding is used
for facility improvements.
AVIATION 12Background
Inspection data on bridges is compiled by the Iowa
BRIDGES DOT and information is submitted to the Federal
Highway Administration (FHWA). The FHWA
records this information in the National Bridge
Executive Summary Inventory (NBI) database. Structures included in
There are approximately 24,087 bridges in Iowa, the NBI are bridges on public roads. Bridges not part
the seventh largest number of bridges in any state in of the NBI are those structures owned by railroads,
the nation. The Iowa Department of Transportation toll bridges, as well as privately owned and pedestrian
(DOT) owns 4,130 bridges, counties own 18,759 bridges. Although not part of the NBI, toll and
bridges, and cities own 1,165 bridges. Bridges, along privately-owned bridges are inspected in the same
with the roadway system, significantly impact manner and inspection records are submitted to the
Iowa’s economic competitiveness. Iowa is first in FHWA.
the nation with the number of structurally deficient
bridges, with just under 20% structurally deficient The FHWA defines a bridge as any structure
in 2018. Reducing the number of bridges with key including supports erected over a depression and/or
elements in poor or worse condition is a priority for obstruction, such as water, highway, or railway and
the Iowa DOT, counties, and cities. Many of the possessing a track or passageway for carrying traffic
bridges in poor condition are owned by counties or other moving loads, as well as having an opening
and require significant funding for maintenance measured along the center of the roadway of more
and improvement. Additionally, Iowa’s bridges are than 20 feet. Inspections on bridges are performed
aging, which contributes significantly to higher during a 24-month cycle or less. Data collected is
maintenance costs. In 15 years, half of the bridges used to calculate the sufficiency rating, determine
on the state highway system will be at least 50 years structural deficiency, and Good-Fair-Poor ratings for
old. Fortunately, Iowa lawmakers acted in 2015 to a particular structure. Definitions and information
provide enough funding for critical highway and regarding sufficiency rating, structural deficiency
bridge needs, and the system is just now beginning and Good-Fair-Poor ratings are explained in more
to see signs of investment. However, significant detail in the Condition section of this report.
portions of the system must eventually be addressed
that are not critical at this time.
Photo 1: Interstate 74 Bridge in Davenport, Iowa
BRIDGES 13Capacity The BCI is not the same system the FHWA uses for
Capacity is the ability of a bridge structure to determining the physical condition of a bridge. The
convey vehicles and people without causing delays BCI was designed to produce a rating more sensitive
in the transportation system. Bridges can act as to changes in condition compared to the FHWA
bottlenecks in certain circumstances which can be ratings. All state-owned and locally-owned bridges
time consuming and costly for the traveling public in Iowa have been rated using this system. The BCI
and freight traffic. Although congestion is not a major is a value from zero to 100, with 100 being the best
concern in Iowa, traffic volumes have steadily been condition. The Iowa DOT rates a bridge as Good,
increasing. Passenger vehicle miles traveled (VMT) Fair, or Poor using the BCI ranges in Table 1.
on Iowa roadways has increased 42% between 1990
and 2015. If these trends continue, congestion will A good rating indicates the bridge is sufficient
become more problematic without an increase in for current traffic and vehicle loads. A fair rating
structure capacity. does not have a specific definition other than not
falling under the extremes of good or poor. A poor
Additionally, there are 3,575 posted bridges within rating means a bridge is not necessarily unsafe, but
the state and another 733 restricted bridges. Posted it should be considered for repair, replacement,
structures are often bridges that have a weight restriction posting, weight limits, or inspecting on a
restriction while restricted bridges are those that more frequent basis. Table 2 shows the number of
limit traffic on the structure a certain number of Good, Fair, and Poor bridges in Iowa organized by
vehicles at any one time. ownership.
Condition Another common method to measure the
The condition of a bridge is the physical ability of condition of a bridge is a determination of whether
the structure to carry design loads. An evaluation it is structurally deficient. Bridges are considered
of the structure by qualified personnel based on a structurally deficient if significant load carrying
ratings system is required by the FHWA for bridges elements are found to be in poor or worse condition
or culverts longer than 20 feet. These inspections due to deterioration and/or damage or the adequacy
must be done at least once every two years. of the waterway opening provided by the bridge is
determined to be extremely insufficient to point of
The Iowa DOT has created a Bridge Condition Index causing intolerable traffic interruptions. A deficient
(BCI) rating, which takes into account the structural bridge does not immediately imply it is likely to
condition of the bridge, load carrying capacity, collapse or is unsafe. Unsafe conditions may be
horizontal and vertical clearances, width, traffic identified with hands-on inspection and if the bridge
levels, type of roadway the structure services, and the is determined to be unsafe, the structure must be
length of out of distance travel if the bridge is closed. closed. When a deficient bridge is left open to traffic,
Table 1: Bridge Condition Index Range
Good ≥ 70
Fair Between 37.5 and 70
Poor ≤ 37.5
BRIDGES 14Table 2: Good, Fair, and Poor Bridges
State Owned County Owned City Owned
Good 1,997 (48%) 6,695 (36%) 473 (41%)
Fair 2,119 (51%) 7,641 (41%) 489 (42%)
Poor 43 (1%) 4,427 (23%) 203 (17%)
Total 4,159 (100%) 18,763 (100%) 1,165 (100%)
1,000 Figure 1: Age by Decade of State Owned Bridges
800
Number of Bridges
600
400
200
0
1900s 1910s 1920s 1930s 1940s 1950s 1960s 1970s 1980s 1990s 2000s 2010s
Poor 0 0 7 7 7 6 13 2 1 0 0 0
Fair 6 7 67 110 57 281 617 606 240 102 16 10
Good 1 0 7 7 6 28 145 205 334 412 524 328
it typically requires significant maintenance and in the nation for the number of structurally deficient
repair to remain in service and eventual rehabilitation structures.
or replacement to address deficiencies. To remain
in service, structurally deficient bridges are often Figure 1 shows the age of state-owned bridges by
posted with weight limits to restrict the gross weight decade and their Good-Fair-Poor rating. The bridges
of vehicles the bridges can carry to less than the built 50 to 60 years ago (in the 1950s, 1960s and
maximum weight typically allowed by statute. early 1970s) had 50-year design lifespans, while
modern bridges have 75-year design lifespans.
Structurally deficient bridges generally do not affect Approximately every five to 10 years, an additional
small vehicles, but they do affect larger vehicles 500 bridges will reach an age of 50 years. The
such as trucks, school buses, fire engines, and farm average age of a structurally deficient bridge in Iowa
equipment. In Iowa, there are 4,673 structurally is 72 years.
deficient bridges - just under 20% - placing Iowa first
BRIDGES 15Safety Iowa has many bridges that cross waterways. These
A bridge deemed structurally deficient may be structures are subject to a process known as scour.
posted for weight limits for the bridge to remain in Scour is the erosion of streambed and bank material
service. If a bridge is considered unsafe it is closed to due to flowing water. The removal of this material
traffic. There are currently 4,308 bridges posted or near bridge abutments and piers can cause bridge
restricted to a number of vehicles on the bridge at failure and when enough material is removed to
any one time. This number represents approximately cause the unstable bridge foundations, the bridge
18% of the total number of bridges in the state. Due is categorized as scour critical. Scour is the primary
to the posting system these bridges do not pose an cause of bridge failure in the nation. Iowa has eight
immediate threat to the public, but this data is an scour critical bridges on the state system and there
indication of an aging system in which safety must are additional bridges with unknown foundations
be addressed. that may be scour critical. There are 500 total scour
critical bridges within the city and county system.
Many of the bridges in the secondary, or rural areas, Virtually all scour critical bridges on the state system
are undersized for the types of vehicles currently have scour countermeasures installed to prevent
using them which poses a definite safety hazard. scour from occurring or to lessen its impact to a
Approximately 99% of the structurally deficient bridge. Within the last 20 years, only four bridges
bridges, and 99% of the posted and restricted in the state are known to have failed due to scour.
bridges, in the state are located on the county Damage to a bridge abutment due to scour is shown
and city systems. While not all of these deficient in Photo 3.
and posted bridges are an immediate threat to the
traveling public, a failure of these structures can be
detrimental as illustrated in the photo below.
Photo 2: Bridge Failure
BRIDGES 16A significant portion of funding for the
Photo 3: Bridge Abutment Transportation Improvement Program comes from
Damage Due to Scour the federal government, based on the current
federal authorization bill, Fixing America’s Surface
Transportation (FAST) Act, which was signed
into law on December 4, 2015. This bill provides
funding through September 30, 2020. Based on
the provisions of this bill, federal funding for roads
and bridges in Iowa is expected to increase 14.7%.
In dollars, the FAST Act provided an additional $25
million in funds from 2015 to 2016 and an additional
$10 million per year through 2020.
Funding for bridge and roadway improvements is also
derived from state revenues. The Road Use Tax Fund
(RUTF) and the Transportation Investment Moves
the Economy in the 21st Century (TIME-21) Fund
Funding are two means by which transportation projects are
The Iowa DOT has developed a Transportation funded within the state.
Improvement Program which outlines the projects
planned over a five-year period on the primary and The revenue to the RUTF and TIME-21 is obtained
interstate systems. The current program covers from sources listed in Table 3.
fiscal years 2019 through 2023. Funding for the
Transportation Improvement Program comes from
federal, state, and local sources.
Table 3: Revenue Sources for RUFT and TIME-21 Is Obtained from the Following Sources
State Constitution
Funding FY 2017 Percent of
Requires Funds be Used
Source (estimated) Total
Only for Roads?
Fuel Tax $671 million 41% Yes
Annual
Registration Fee $550 million 34% Yes
Fee for New
Registration $340 million 21% Yes
Other* $75 million 4% No
Total $1.64 billion
*Driver’s license fees, title fees, trailer registration fees and other miscellaneous fees
Source: Iowa DOT-Offices of Program Management and Systems Planning
BRIDGES 17The Iowa Constitution requires 95% of all revenue funding will be ramped up in the near future. Of the
contributed to the RUTF and TIME-21 funds to current amount, DOT typically allocates 70 to 74%
be spent on public roadways and diversion of these for replacements, 9 to 23% for rehabilitation and
funds to other programs is prohibited. seven to 17% for maintenance. Counties, meanwhile,
spend approximately $100 to $200 million per year
RUTF revenue is distributed as follows: 47.5% to the on replacement, rehabilitation, and repair for their
primary system, 32.5% to the secondary system, and bridges.
20% to the cities. TIME-21 revenue is distributed as
follows: 60% to the primary system, 20% to the Every four years, Iowa DOT is required to assess
secondary system, and 20% to the cities. the ability of existing revenues to meet the needs
of the system and submit its findings to the State
To shore up available funding for both RUTF and Legislature. The most recent study, compiled
TIME-21, the Iowa State Legislature increased the in 2016, found passage of Iowa Senate File 257
state motor fuel excise tax rates in 2015 with the effectively closed the critical funding shortfall last
passage of Iowa Senate File 257. This bill contained identified as $215 million per year in the 2011 RUTF
many provisions but the most significant was the Study. In addition, the increase in federal funding
increase of fuel tax rates by 10 cents per gallon. An offset the lost buying power since the tax increase
additional $220 million was generated in FY 2016 was enacted which further enabled the critical needs
and 2017, which is put toward road and bridge repairs to be addressed.
in the state. This is higher than the initial estimate
from the state legislature that Senate File 257 would However, while critical needs across the
bring in $215 million annually. transportation system are being met, significant
portions of the system must eventually be addressed
Thanks in part to the additional funding from Senate that are not critical at this time. Bridge conditions
File 257, Iowa DOT estimates $1 billion will be spent will continue to deteriorate across the network.
on Iowa’s state-owned bridges from 2019 to 2023. Additionally, bridges owned by municipalities and
Currently, the agency spends approximately $80 counties are more likely to fall into the poor range
million per year on replacement, rehabilitation, and and will require significant funding to remove their
repair for bridges on the primary system, but expects structurally deficient rating.
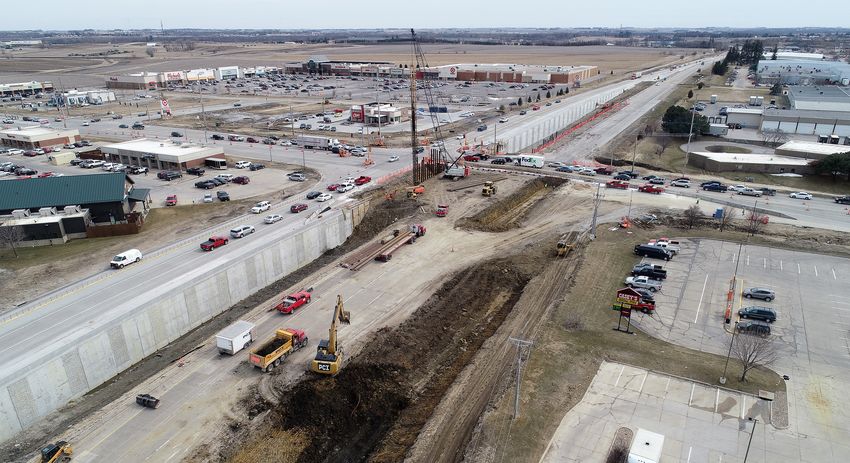
Photo 4: Interstate 235 Highway and Bridge Reconstruction
BRIDGES 18Recommendations Resources
Obtain funds and create more refined Iowa Department of Transportation, Iowa In Motion 2045,
management systems to address the needs of State Transportation Plan, May 9, 2017 (https://iowadot.
the bridges that will be at least 50 years old gov/iowainmotion)
within the next few years. Iowa Department of Transportation, 2016 Road Use
Tax Fund (RUTF) Study, December 30, 2016 (http://
Maintain focus on repair and/or replacement of publications.iowa.gov/23228/)
the most structurally deficient bridges.
Iowa Department of Transportation, Iowa Strategic Highway
State funding should be required to be adjusted Safety Plan 2017 (https://iowadot.gov/systems_planning/
for inflation. pdf/12-5-17-SHSP.PDF)
Iowa Department of Transportation, Transportation Asset
Electric and hybrid vehicles cause the same Management Plan, November 2016
wear and tear on the roadway and bridge system
but they contribute less towards maintenance Federal Highway Administration, 2015 Status of the
than gas and diesel fueled vehicles. As hybrid Nation’s Highways, Bridges and Transit: Conditions and
and electric vehicles become more common, Performance (https://www.fhwa.dot.gov/policy/2015cpr/)
an alternate means of funding beyond the
Iowa Department of Transportation, 2019-2023 Iowa
gas tax must be created, so such vehicles pay
Transportation Improvement Program, June 2018 (http://
their fair share of the burden. A means to publications.iowa.gov/27714/)
accomplish this is the implementation of a
mileage-based user fee in which a tax is levied Iowa Department of Transportation, Annual Bridge Report,
based on the number of vehicle miles traveled. 2018 Bridge Status
A pilot program should be created in which a
study would be done to determine the best way Iowa Department of Transportation, Office of Bridges and
to enact the user fee system. Structures
The Cedar Rapids Gazette, “Gas tax hike pumps half a billion
Continued use of innovative technologies into Iowa road projects”, November 18, 2017
such as accelerated bridge construction,
nondestructive testing, and structural health
monitoring should be used to improve project
delivery and better evaluate the condition of
existing bridges.
BRIDGES 19Introduction
Many of Iowa’s dams serve useful purposes including
DAMS flood control, recreation in reservoirs, water supply
(for irrigation, drinking water, fire control, etc.), power
generation, and more. However, there are many
Executive Summary vestigial dams in Iowa that are no longer needed for
There are currently 4,018 Iowa dams in the U.S. their original purpose (small scale power generation,
Army Corps of Engineers’ National Inventory of grain milling, etc.), and create public safety hazards,
Dams and more than 100 additional dams listed on owner liability, unnecessary maintenance expenses,
the Iowa Department of Natural Resources (DNR) impaired ecological conditions, and public safety
Dam online database. Approximately half of dams hazards.
in the state are privately owned. Iowa’s State Dam
Safety Program budget is below $50 per regulated Condition
dam, much lower than the national average of $700 There are 4,018 Iowa dams in the U.S. Army Corps of
per regulated dam. Less than 30% of the state’s high Engineers’ 2018 National Inventory of Dams (NID)
hazard potential dams have emergency action plans, and 4,142 dams listed in the Iowa DNR Dam online
compared with approximately 70% nationwide. database, about half of which are privately owned (see
Iowa does not have a state loan or grant program Figure 1). Of Iowa’s dams, 96 (2.5%) are classified as
to assist dam owners with rehabilitation projects “high hazard,” according to the Iowa DNR database
and many structures are aging beyond their original (a designation based on height, location, and volume
design life. Additional factors such as accumulating detained, it is NOT a condition assessment), 239 are
sediment in reservoirs behind dams, increasing public “significant hazard,” and the rest are “low hazard.”
risk exposure (based on population growth-related
increases in recreation and development), and
climate change related increases in flood frequency
and severity are adding urgency to improve the state
of Iowa’s dams, or remove them where appropriate.
29
127 6
Local
Government Federal
1825 1940 Public
Private Utility
State
Figure 1: Dams by Primary Owner Type
Source: Iowa Department of Natural Resources
DAMS 20Like all infrastructure, dams are subject to regular wear Protection Commission. The Rule Updates propose
that requires periodic inspection and maintenance modifications to the state’s Program, including:
to ensure proper function and safe operation.
Unlike most infrastructure that has the potential to Update the size of dams that fall under the
affect the safety and welfare of the general public, Program’s authority, to match the standards in
such inspection and maintenance are the primary the National Dam Inventory;
responsibility of the dam owner. With half of Iowa’s
dams privately owned, this means safety of the Require Emergency Action Plans for all High
public downstream is often in the hands of private Hazard Dams;
entities. This public-private risk factor creates the
need for stringent condition monitoring, oversight, Less prescriptive dam design requirements and
and maintenance standards. Despite this need, less allowing dam designers to use national standards
than 10% of Iowa dams are regularly inspected – as appropriate; and
high hazard dams are inspected every two years and
all other major dams are inspected every five years. Allows for reduced freeboard designs in some
Major dams include all high hazard dams, as well as specific situations, based on specific analysis.
any significant dams and low hazard dams that meet
specific size, potential hazard, or public importance Dams are typically designed to be in service for
thresholds. approximately 50 years (35 to 100 depending on the
design) before major maintenance, replacement, or
The Iowa Department of Natural Resources Dam removal is expected. This means that approximately
Safety Program has regulatory authority for the large half of Iowa’s dams may be currently exceeding their
majority of the state’s dams, and in 2018 the Program intended design life, with another 10 to 20% added
released the draft Dam Safety Rule Updates, which to that list with each coming decade, see Figure 2.
are currently pending approval by the Environmental
Figure 2: Dams by Completion Date
1,000
957
800 794
664
624
600
448
400
207 276
200
46 29
26 27
7 15
0
Before 1990- 1910- 1920- 1930- 1940- 1950- 1960- 1970- 1980- 1990- Since
1990 1909 1919 1929 1939 1949 1959 1969 1979 1989 1999 2000
Source: Iowa Department of Natural Resources
DAMS 21The condition of Iowa’s dams are included in Table 1. based on intended use forecasts and historical river
discharge observations. Currently, the capacity
Table 1: Condition of Dams of such dams is under the dual threat of reduced
High Hazard volume due to sediment accumulation and rapidly
Condition All Dams1 changing discharge due to increasing flood frequency
Dams2
and severity. These incidents are punctuated by
Satisfactory 272 80 changes in drought frequency (which can adversely
impact shallow reservoirs intended for recreational
purposes). While the effects of climate change vary
Fair 40 16 by region within the state, the general expectation
for Iowa is a warmer, wetter trend with larger
increases in precipitation expected for the eastern
Poor 13 3 part of the state as compared to the western region,
with a marked increase in rainfall intensity and large
5 0 precipitation events.
Unsatisfactory
Iowa is largely an agricultural state with much of the
Not Rated 3
3,809 0 rural landscape converted to cultivation of annual
row-crop grains. While adoption of farming methods
focused on soil conservation is growing rapidly,
1 - According to the Iowa DNR Online Dam Inventory
soil loss by erosion is a significant and continuous
2 - According to the 2018 National Inventory of Dams
3 - “Not Rated” means not inspected in the last 10 years
concern. After eroding from the landscape, the soil
is transported into creeks and rivers, and remains
suspended in flowing water until the velocity slows
These condition assessments are defined as:
enough to halt further transport, where the particles
settle to the bottom. This sedimentation process
Satisfactory – No existing or potential dam
occurs naturally in water bodies, especially river deltas
safety deficiencies are recognized;
which are artificially simulated at the upstream end
of reservoirs behind dams. Most reservoirs in Iowa
Fair – No recognized deficiencies for normal
are losing water detention capacity as the volume
loading conditions, however rare or extreme
is filled by sediment. While sedimentation does
events may result in a deficiency;
reduce the consequences of dam failure, volume
lost to sedimentation is value lost for the dam, if the
Poor – A dam safety deficiency is recognized
original intent was for water supply or flood control
and remedial action, or further investigation is
impoundment. Reservoirs can be dredged to remove
necessary;
the sediment; however, the process is prohibitively
expensive for all but the most critical cases.
or
Unsatisfactory – A dam safety deficiency Operations and Maintenance
is recognized that requires immediate or An Emergency Action Plan (EAP) identifies potential
emergency remedial action. emergency conditions at a specific dam site and lists
pre-planned actions to be followed to help mitigate
the disastrous effects of an emergency event. Iowa’s
Dam Safety officials continue to make progress
Capacity
developing EAPs for high hazard dams, however the
Dams intended for water supply preservation and
number that do have EAPs is still less than 30%,
flood control are typically designed for specific
compared with approximately 70% nationwide. They
impoundment volumes in the reservoirs upstream,
DAMS 22have also completed inundation mapping (available The Lake Delhi dam failure in July 2010 is a stark
online) for 60 of the 88 state regulated high hazard reminder of the dramatic impact a dam failure can
dams. exact on the state, local community, and private
citizens. With an estimated $12 million in repair
The state does not currently require EAPs costs, $50 million in property damage, and another
for all Iowa dams. Upon final approval by the $120 million in economic losses, the Lake Delhi area
Environmental Protection Commission, the Rule felt the effects of that dam failure for years following
Updates will require all high hazard dams have EAPs the disaster. While the dam and affected properties
- a critical improvement to protecting the public. have now been restored (as of 2018), this dam failure
Until then, Iowa remains below national averages makes a case that adequate resources and funding
in state authority related to legislation, inspection, need to be established in Iowa to avoid additional
enforcement, Emergency Action Planning and dam failures in the future.
response, permitting, education and training, as well
as public relations. Resilience
Increasing flood frequency and severity associated
Funding with climate change is adding new importance to
Many states have loan or grant programs to assist the concept of infrastructure resiliency for assets
dam owners with rehabilitation projects. Iowa has no near rivers and streams. To make infrastructure
such program. In its absence, much of the routine more resilient, critical-route bridges are built higher,
maintenance or rehabilitation needed to modernize primary storm drains are designed larger, and
dams, complete spillway repairs, remove problematic levees are raised above the original design height to
vegetation, and fix seepage problems may be deferred protect communities developed around waterways
or not be completed at all. that previously had lower and less frequent flood
events. Unfortunately, modifying a dam to address
According to data from the Association of State increasing river flows is not so simple. Raising the
Dam Safety Officials, Iowa’s state budget for its Dam height of a dam to reduce flooding downstream
Safety program per regulated dam is a fraction of increases the flood elevation and flooded area
the national average. The national dam safety budget upstream. Decreasing a dam’s height to prevent
average is about $700 per regulated dam while Iowa’s increasing upstream inundation reduces the dam’s
budget is below $50. For each high hazard dam, the original design utility and may increase the severity
national dam safety budget is about $5,000, while of flooding downstream.
Iowa’s budget is about $1,400 (data from 2017, the
most recent available). Resilience-based improvements to dams are typically
treated on a case-by-case basis depending on a wide
Future Need variety of risks and benefits. Generally speaking, the
It is critical that the Iowa Environmental Protection first line of infrastructure resiliency is consistent
Commission approve the 2018 Rule Updates to inspection and maintenance. Implementing the draft
protect public safety, especially for high hazard Rule Updates, followed by increasing funding for
dams. It is also essential that the State’s Dam inspection and maintenance would lead to increased
Safety Program funding be increased - not just for resilience. In many cases the most sustainable
inspections, but also for enforcement and increasing improvement for resiliency may be the removal of
analysis of existing dams to compare their design to the dam if it no longer serves its original purpose,
modern criteria. The 2017 Oroville Dam spillway which would allow the river to return to a more natural
failure in California showed that inspections alone are state and permanently eliminate an unnecessary
not enough. A State Revolving Loan Fund or other maintenance burden.
loan program would be an important low expense
mechanism to improve dam safety and bring Iowa in
line with most other states.
DAMS 23Public Safety Innovation
Dams inherently pose numerous public safety risks Many smaller low head dams on Iowa’s waterways
and owner liability concerns, which are exacerbated are vestigial remnants of previous uses (such as
by inadequate funding for dam maintenance, grain or timber mills) and no longer serve their
inspection, emergency action planning, and original purpose. These dams present a public
mitigation or removal. Specifically, risks to public safety hazard, impediment to fish migration
safety posed by dams include structural dam failure, and ecological continuity, as well as ongoing
flooding induced by mechanical failures of dam unnecessary maintenance burdens. Retiring dams
appurtenances (accessory parts), uncontrolled from service, also a nationwide trend, is driving an
overtopping during flooding, and recreational overall movement toward dam mitigation in Iowa.
hazards posed by low head dams. Additional risks can This includes modifications to reduce the hazard or
include public health issues associated with stagnant complete removal of the dam and restoration of the
water in reservoirs, nuisances such as blockage of fish natural river channel.
migration routes or harboring of invasive species in
reservoirs, among others. Since 2008, a total of 21 hazardous low head dams
have already been mitigated or removed across
There have been 172 dam related fatalities in Iowa Iowa. The option to innovatively re-purpose vestigial
since record keeping began in the early 1900s, with low head dams and transform the hydraulic head
the trend being relatively constant at just under two differential into recreational amenities is creating an
per year. While most fatalities are accidental, many encouraging, value-added economic incentive for
recreational injuries and fatalities occur because Iowa communities. Manchester, Charles City, and
citizens underestimate the dangerous recirculating Elkader, among others, have removed or modified
currents present at low head (aka roller) dams and their dams, and created entirely new recreation
dam outfall structures. Indeed, low head dams economies and river based public park spaces in their
have earned the nickname “drowning machines” wake. Dam conversions carry the additional benefits
by industry officials, partly to serve as a warning to of removing the former safety hazard, reducing
recreationists, and partly because so many dam- maintenance, reconnecting fish passage and
related fatalities occur on low head dams where the ecological corridors, and improving water quality. The
low, rolling structures don’t typically appear life- Iowa Dam Mitigation Manual lists 82 dams that have
threatening. strong potential for removal or mitigation based on
both ecological and safety/navigation benefits (50th
percentile or greater based on specific factors).
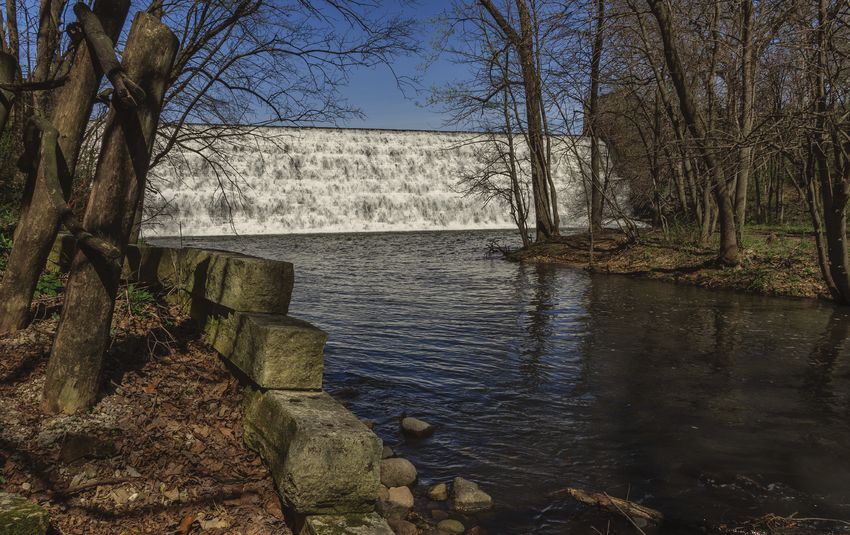
Photo 1: Pinicon Ridge Park Dam in Central City, Iowa -
Low Head/Roller Dam (Photo Credit: Nate Hoogeveen, Iowa DNR)
24
DAMSPhoto 1: Manchester, Iowa’s Former Dam Site, After Conversion to a Public
Recreational Amenity (Photo Credit: Iowa Rivers Revival)
Recommendations
Develop and implement Emergency Action Resources
Plans for all high hazard dams in the state. Iowa DNR Dam Safety Program – multiple websites
Increase state funding for dam inspection, IDNR – DSP - Jonathon Garton, PE (personal
communications)
Emergency Action Plan development, analysis
and enforcement to levels that match or exceed Iowa DNR Rivers Program – Multiple websites
the national averages.
National Inventory of Dams - Iowa, United States Army
Implement a State Revolving Fund for repair Corps of Engineers
and maintenance of dams owned by cities,
counties, and private entities (the vast majority Dam Safety Performance Report – Iowa, Association of
State Dam Safety Officials, 2018
of dams in Iowa).
Iowa Rivers Revival – Images and data
Increase funding and create a separate
revolving fund program for the state water American Rivers – General data
trails program and dam removal, mitigation,
and safety improvements. Reconnecting Rivers: Natural Channel Design in Dam
Removal and Fish Passage, Minnesota DNR, 2010
The Environmental Protection Commission
Iowa Whitewater Coalition – Iowawhitewater.org – Dam
should approve the draft 2018 Iowa Dam related fatality data
Safety Rule Updates.
The Gazette – 2018-12-07 – Iowa gives new life to rivers by
Expedite the removal of vestigial dams that removing over 20 dangerous dams
pose risks to public safety, obstruct navigation,
create liability for owners, and create
unnecessary ecological discontinuity.
25
DAMSYou can also read


