IRLCov19 : A Large COVID-19 Multilingual Twitter Dataset of Indian Regional Languages
←
→
Page content transcription
If your browser does not render page correctly, please read the page content below
IRLCov19 : A Large COVID-19 Multilingual
                                             Twitter Dataset of Indian Regional Languages

                                                               Deepak Uniyal1      ⋆
                                                                                       and Amit Agarwal2   ⋆

                                                                     1
                                                                         Graphic Era University, India
                                                                         deepak.uniya08@gmail.com
arXiv:2107.12360v1 [cs.SI] 26 Jul 2021

                                                                             2
                                                                               IIT Roorkee, India
                                                                          aagarwal3@cs.iitr.ac.in

                                                 Abstract. Emerged in Wuhan city of China in December 2019, COVID-
                                                 19 continues to spread rapidly across the world despite authorities hav-
                                                 ing made available a number of vaccines. While the coronavirus has been
                                                 around for a significant period of time, people and authorities still feel
                                                 the need for awareness due to the mutating nature of the virus and there-
                                                 fore varying symptoms and prevention strategies. People and authorities
                                                 resort to social media platforms the most to share awareness information
                                                 and voice out their opinions due to their massive outreach in spreading
                                                 the word in practically no time. People use a number of languages to
                                                 communicate over social media platforms based on their familiarity, lan-
                                                 guage outreach, and availability on social media platforms. The entire
                                                 world has been hit by the coronavirus and India is the second worst-hit
                                                 country in terms of the number of active coronavirus cases. India, being a
                                                 multilingual country, offers a great opportunity to study the outreach of
                                                 various languages that have been actively used across social media plat-
                                                 forms. In this study, we aim to study the dataset related to COVID-19
                                                 collected in the period between February 2020 to July 2020 specifically
                                                 for regional languages in India. This could be helpful for the Government
                                                 of India, various state governments, NGOs, researchers, and policymak-
                                                 ers in studying different issues related to the pandemic. We found that
                                                 English has been the mode of communication in over 64% of tweets while
                                                 as many as twelve regional languages in India account for approximately
                                                 4.77% of tweets.

                                                 Keywords: COVID-19 · Twitter · Indian Regional Languages · Natural
                                                 Language Processing

                                         1     Introduction

                                         The novel coronavirus that erupted in December 2019 from Wuhan, China
                                         marked the beginning of the COVID-19 pandemic. With COVID-19 insurgence
                                         around the world, people are heavily dependent on social media platforms (SMPs)
                                         like Twitter to post their opinions, raise awareness among the general public,
                                         ⋆
                                             Both authors contributed equally to this work.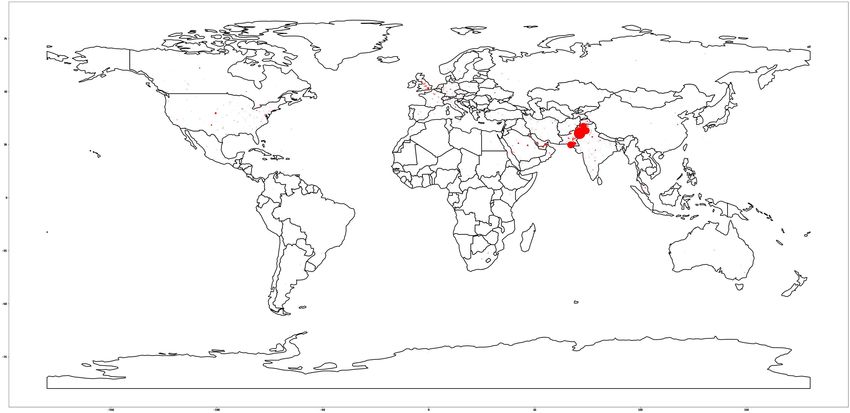
2         Deepak, Amit

show their fear, ask for help, and communicate with fellow citizens. Studies show
that SMPs like Twitter has the potential to track emergencies in real-time that
can be utilized by health officials, government agencies, and NGOs to respond
quickly and more effectively[1][2].
    Since the outbreak of the COVID-19 pandemic, most countries around the
world have enforced several preventive and control measures to limit the spread of
the virus. The measures range from early screening, isolation of patients, school
and workplace closures, curfews, limited numbers of people in social gatherings,
travel restrictions, social distancing to even complete lockdown in chosen cities
or country as a whole[3][4]. The success of these preventive measures would
effectively imply people maintaining social distance as far as possible and use
technology to interact and fulfill their day-to-day needs. In scenarios like this,
SMPs like Twitter, Facebook, YouTube, Instagram, Snapchat, Reddit, Pinterest,
and LinkedIn, etc. play a vital role by allowing individuals to interact thus
helping them to alleviate social isolation. Contrary to the studies which suggest
increased loneliness in people by excessive use of social media[5], SMPs have
rather emerged as a friend to reduce isolation and boredom during the COVID-
19 pandemic[6].
    Social media users may use a global or regional language to communicate on
the platform based on their understanding of the language and ease of communi-
cation with other users producing a lot of data. With a plethora of unstructured
data available on social media, it becomes crucial as to how one comprehends
the information and uses it effectively to combat COVID-19. India, the second-
most populous country in the world, has 23 constitutionally recognized official
languages which people may use to communicate. According to a census in 2001,
Hindi is the most widely used language in India and is spoken by 53.6% of the
Indian population as their first language[7].
    A major portion of the social media studies available today is based on the
datasets in English. However, to better understand the information posted in
the low-resource languages of the largest democracy in the world, we need to
study the communication revolving around various Indian languages. Therefore,
in this study, we have presented IRLCov19, a large COVID-19 Twitter dataset
on various Indian regional languages which we collected between 01 February
2020 to 31 July 2020[8]. We collected nearly 330 million tweets irrespective of
the language used and refined it further to remove tweets with duplicate IDs
to make the final tweet count to 280 million. We subsequently identified more
than 13 million tweets in twelve Indian Regional Languages (IRL) from the
dataset collected. This dataset can be advantageous for researchers, Government
authorities, and policymakers in studying the pandemic from a varied perspective
as listed below[9][10][11][12] [13][14]:

    – Public health strategies: People post the situational information or con-
      tent on social media corresponding to the need or availability of resources
      related to various emergency services such as medical supply, bed availabil-
      ity, blood or plasma donation, etc. The dataset we provided, can be used in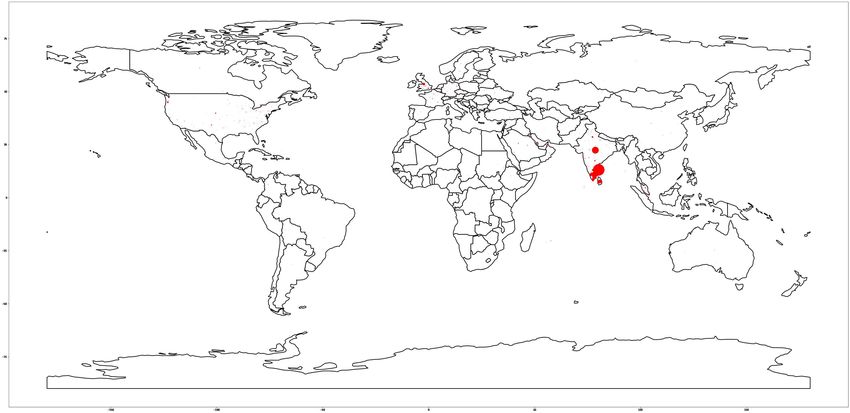
IRLCov19: A Large COVID-19 Multilingual Twitter Dataset           3

    developing suitable information publishing strategies by studying situational
    information to effectively respond in a pandemic situation.
–   Identification of echo chambers in social media: Misinformation or
    rumors are said to be escalated by a group of users having similar ideologies
    or interests, known as an echo chamber of social media. This kind of dataset
    can be of great help in the identification and investigation of the characteris-
    tics or social properties of echo chambers which can be helpful in preventing
    rumor propagation in the early stage.
–   Understanding public reactions and opinions: Public post their reac-
    tions, sentiments, and opinions on the various events, announcements, and
    actual implementation of fiscal and monetary policies initiated by the gov-
    ernment during or after the pandemic. This kind of dataset can be used to
    study the pandemic from a social perspective, as well as analyzing the pub-
    lic opinions, human behavior, and information spreading pattern across the
    network.
–   Individual reaction on different policies roll-out by government:
    The Reserve Bank of India, along with the government of India and other
    regulatory bodies, announced various fiscal and monetary measures to aid
    businesses during the lockdown. Several fiscal benefits by the government
    include cash transfers to lower-income households, wage support and em-
    ployment provision to low-wage workers, and insurance coverage for workers
    in the healthcare sector etc. The monetary benefits include a reduction in
    the repo and the reverse repo rate by RBI. The government also announced
    several measures to ease the tax compliance burden such as postponing the
    tax and GST fillings. The analysis of the Twitter dataset can help gauze the
    public sentiment related to these policies. This would also help the govern-
    ment and authorities review how strategically the policies were implemented
    and were able to provide relief to the public.
–   Early detection and surveillance of the pandemic: Early detection of
    the pandemic can be helpful in preventing the further spread of the disease
    and loss of casualties. The analysis of Twitter data can help in the identi-
    fication of content where masses may report their symptoms, reports, and
    localities, etc. which can be further used to identify the disease hot spots for
    prioritizing the further course of actions.
–   Identification of local or global leaders: Identification of leaders or in-
    fluencers is very significant during various emergency situations or natural
    disasters [15] such as Covid-19, earthquake, glacier outbursts, floods, land-
    slides, and wildfires, etc. because of their wide network, reach, popularity,
    or popular links. Such kind of users could use their remarkable network to
    spread the awareness information, debunk the misinformation or rumors as
    quickly as possible, ask for or provide help to the needy, communicate to
    authorities more effectively during the pandemic.
–   Tracking and debunking misinformation: During critical and emer-
    gency situations it’s of utmost importance to identify the misinformation,
    fake news, propaganda, or rumors and curb them as quickly as possible. It has
    been observed in the past studies that such kind of information spreads more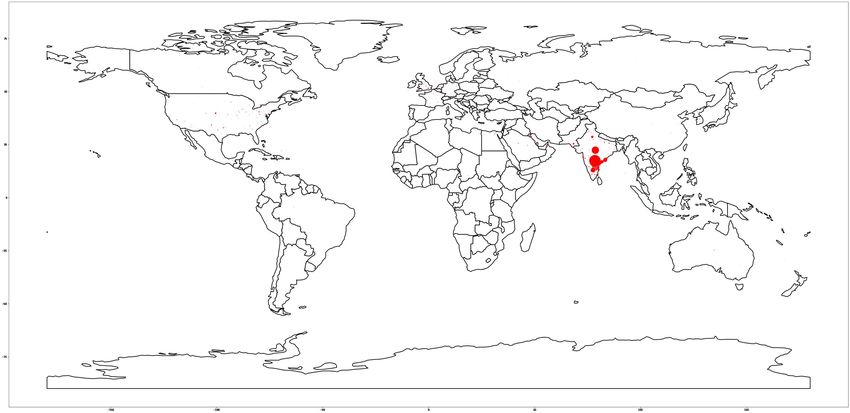
4      Deepak, Amit

    quickly than the correct and factual information and therefore it becomes
    more important to identify and debunk such kind of unverifiable content
    that endangers public safety at a time when awareness and suitable preven-
    tive measures are of utmost importance and avoid any kind of panic in the
    public.
    The rest of the paper is organized as follows. In the next section 2, we de-
scribe COVID-19 related studies and datasets. In Section 3, we provide the data
collection and description in detail. Section 4 is about geo-spatial analysis of
tweets and section 5 is about identification and analysis of user influence over
the Twittersphere. Section 6 and section 7 explains a way to access dataset and
conclusion respectively.

2   RELATED WORK
There are a number of studies related to COVID-19 analysis of social me-
dia data being focused on various aspects such as human behavior and reac-
tions analysis [16][17], preparedness for emergency management[10], identify-
ing and debunking conspiracy theories, misinformation, propaganda and fake
news[18][19][20][21]. Many other studies have collected and shared the COVID-
19 related datasets from various social media platforms such as Twitter[22],
Instagram[23], Weibo[24] etc. Some of the studies have released datasets belong-
ing to single language such as Arabic[4][25], while others include multilingual
datasets[26][27][28][29][30].
    The largest available dataset contains 800 million tweets that are collected
from 1 Jan 2020 to 8 Nov 2020 [22]. The clean version of the dataset with no
retweets is also provided which contains around 194 million tweets. Another large
dataset that is collected from 1st Feb 2020 to 1st May 2020 contains 524 million
multilingual tweets[26]. It also provides location information in the form of GPS
coordinates and places information for some of the tweets as per the availability.
The longest-running dataset is of Arabic language[25] which is collected between
27 Jan 2020 to 31 Jan 2021. It also provides information related to propagation
networks of the most-retweeted and most-liked tweets that include retweets and
conversational threads i.e. threads of replies. However, none of the above datasets
focus on the IRL and their research implications. We have included 12 Indian
languages in our dataset, IRLCov19 which also includes location information
with a subset of tweets depending on the availability of information. We have
also analyzed the dataset to compute the local or regional influencers or leaders
on the basis of various influencing measures such as followers, retweet count,
favourite count and number of mentions, which is discussed in detail in section
5.

3   DATA COLLECTION AND DESCRIPTION
We collected Twitter datasets on COVID-19 during the period from Feb 01 2020
to July 31 2020 using publicly available Twitter streaming API. To download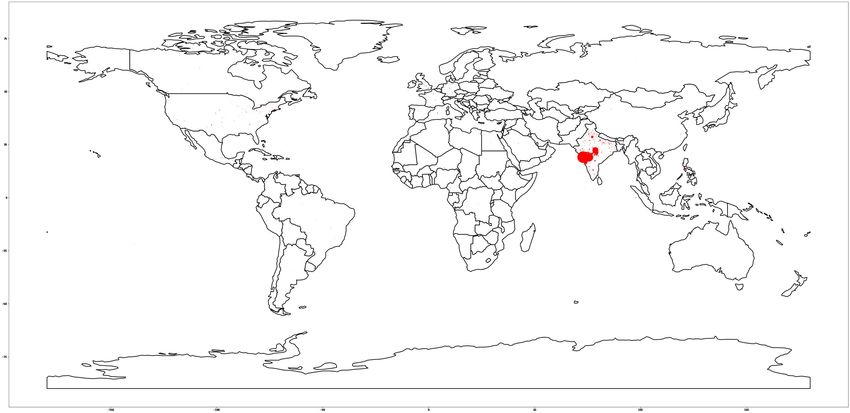
IRLCov19: A Large COVID-19 Multilingual Twitter Dataset                           5

                              Table 1: Language Wise Tweets Distribution
Language     Percentage   Language       Percentage Language Percentage    Language         Percentage
English      64.11        Marathi        0.19       Danish     0.018       Latvian          0.003
Spanish      14.08        Greek          0.14       Malayalam 0.017        Sindhi           0.003
French       5.003        Telugu         0.11       Swedish    0.017       Hebrew           0.002
Hindi        3.36         Chinese        0.101      Finnish    0.017       Maldivian        0.001
Italian      2.1          Tagalog        0.09       Basque     0.0127      Amharic          0.001
Thai         1.8          Polish         0.09       Slovenian  0.012       Icelandic        0.001
Undefined    1.76         Gujarati       0.071      Czech      0.0106      Bulgarian        0.001
Portuguese   1.45         Persian        0.07       Punjabi    0.01        Sorani Kurdish   0.001
German       0.96         Kannada        0.059      Sinhala    0.01        Armenian         0.0001
Turkish      0.87         Russian        0.05       Ukrainian  0.007       Burmese          0.0001
Indonesian   0.71         Estonian       0.04       Welsh      0.006       Georgian         0.00005
Tamil        0.55         Bengali        0.028      Serbian    0.005       Khmer            0.00004
Catalan      0.5          Haitian Creole 0.025      Lithuanian 0.005       Laotian Lao      0.00004
Arabic       0.42         Romanian       0.023      Norwegian 0.005        Uyghur           0.00003
Urdu         0.36         Korean         0.02       Hungarian 0.005        Tibetan          0.00002
Dutch        0.33         Oriya          0.02       Pashto     0.005
Japanese     0.29         Nepali         0.019      Vietnamese 0.003

the dataset we utilized a list of trending keywords and hashtags such as corona,
Covid-19, #COVID19, #COVID2019, #Covid 19, #CoronaVirusUpdates etc.
We kept updating the list of keywords and hashtags as and when they were
available daily.
    Initially, we collected a dataset of nearly 330 million tweets irrespective of the
language of communication. The Table 1 gives the percentage-wise distribution
of tweets collected between a given time period. The downloaded tweets may be
redundant as a tweet may contain multiple search keywords and therefore get
downloaded multiple times for each such keyword. It is imperative to remove
such occurrences for a more robust dataset. We pruned the dataset to remove
the redundant tweets to result in over 280 million final tweets. We extracted
the tweets specific to 12 Indian languages marked in bold in Table 1. Owing
to a small percentage, we could infer from the dataset that not many people
were using regional languages for communicating on Twitter. Another reason
for this could be that the hashtags or mentioned used by regional languages’
users could not find a place in the trending list of keywords. We have utilized
trending hashtags or keywords and hence the latter could be a strong possibility.
It is evident from the dataset that people have used various global, national
or regional languages to voice out their opinions on varying matters. English
comprises 64.11% of the total tweets out of all 65 languages in the dataset.
    In this study, we have focussed on studying the dataset on IRL that constitute
approximately 13 Million (1,33,63,294) tweets which are about 4.77% of the total
collected tweets. The daily distribution of the tweets corresponding to various
regional languages is shown in Fig. 1 on a logarithmic scale. It represents the
volume of tweets against each language for a period of six months starting Feb
01 2020 to July 31 2020. The data in the table shows that tweets in the Hindi
language are consistently high in numbers compared to other IRL. The findings
coincide with the fact that Hindi is the most spoken language in the country.
The high spikes in the graph after mid-March mark the beginning of a voluntary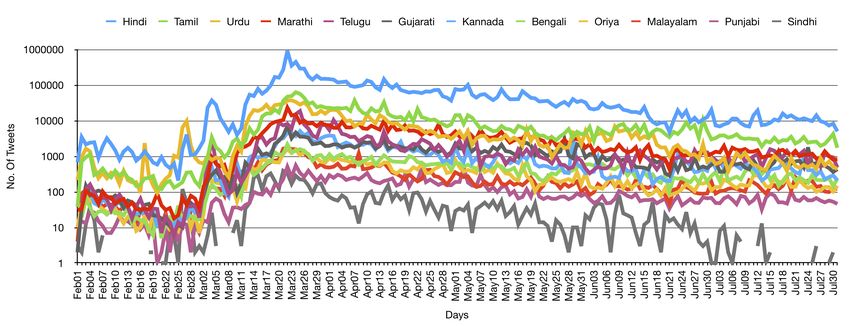
6       Deepak, Amit

    Fig. 1: Day Wise Tweets Distribution for Indian Regional Languages on Logarithmic Scale

public curfew on March 22 2020. As evident from the plot, this was followed
by a 21-day nationwide lockdown starting from March 25 2020, which resulted
in masses expressing themselves on various SMPs. Table 2 has the count of
users with original as well as re-tweeted tweets. The data shows that a total
of 14,28,876 unique users were involved in exchanging thoughts and opinions in
IRL. While most of these users are non-verified users, a little less than 1% are
verified.
    The dataset prepared is for research and non-profit uses and includes key-
words used for dataset extraction, unique tweet IDs, and everyday language-wise
tweet count. We first removed all duplicate entries by keeping the first instance
of a tweet and kept a list of tweets corresponding to each language for all days.
Later, we identified the location information from each tweet using the metadata
in a tweet.
    Identification of Location Information From Tweets The location in-
formation in a tweet can be identified in three different ways i.e by extract-
ing the location information in the form of GPS coordinates from the down-
loaded JSON Twitter data, using the place or location information from the
Tweet object[31][32][33] and extracting the location information from the tex-
tual content[34]. The previous studies show that only 1% of the tweets contain
GPS coordinates despite Twitter providing an option to capture the exact lo-
cation of Tweet by enabling geolocation service on mobile devices. We can also
deduce the location from the place and location fields in the JSON data. It can
correctly identify the approximate location of the user but not the location of
the tweet in all cases. Not all the values in these fields are valid locations; for
example, Universe, Moon, Planet Earth, Heaven etc. Invalid locations can be
handled by transforming them to coordinates i.e. latitude and longitude, by us-
ing a python library called GeoPy. It returns coordinates for only valid locations
by discarding invalid locations. The library may not always correctly classify
valid locations due to misspellings or other possible errors in the text. This in-
hibits its ability to correctly map the geocode from a given location and such
scenarios have been handled manually. The location of a tweet can also be de-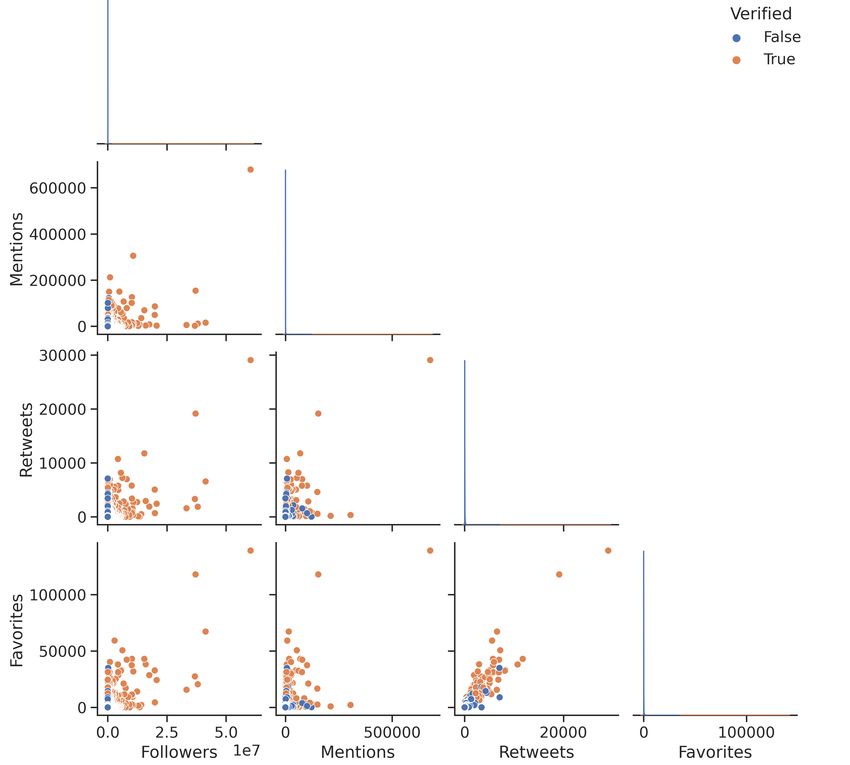
IRLCov19: A Large COVID-19 Multilingual Twitter Dataset                7

       Table 2: Users Details Corresponding To Indian Regional Languages (IRLCov19 )
                       Count
                               Verified Non-Verified Total       Verified %
             Unique
             Original Users    3498      437339          440837 0.79%
             Retweet Users     4146      1178347         1182493 0.35%
             All Users         5284      1423592         1428876 0.37%

duced by exploiting the information in the text or by looking at its network of
followers or friends. This method of capturing locations can be explored further
in future works.
    In this study, we have used two parsers i.e. P 1 and P 2 to extract the location
information from Tweets. The extracted location could be in terms of the GPS
coordinates or place and location fields as extracted from the profile informa-
tion. Parser (P 1) looks for the geo-coordinates that comprise both latitude and
longitude in a tweet. Parser (P 2), however, extracts the place and location fields
from the JSON data of the tweet in case (P 1) could not find geo-coordinates. A
retweet contains the profile information of both the original user, known as the
source of the tweet, and of the user who retweeted it. Parser P 2 prioritizes the
information of retweeting users over original users while searching for a place
or location information as multiple retweets are possible for a tweet across the
globe.

4   Geo-Spatial Analysis of Tweets
Geo-Spatial analysis of tweets during emergencies, such as pandemics and natu-
ral disasters, plays a vital role in identifying the pattern of information propaga-
tion in the affected areas of the leaders involved in the communication. Therefore,
the information gathered can be helpful for various regional, national, and global
organizations to evaluate the circumstances and develop a strategy to combat
the crises. Notably, it can be utilized to identify the prominent leaders around
a region working as spreaders of information or misinformation on the social
network. This could essentially be used in numerous ways like disseminating the
awareness information, communicating the policies or schemes launched by Gov-
ernments, reaching out to needy people promptly, and tracking down the source
of misinformation to put measures in place, etc.
    To analyse the locations of IRLCov19 dataset with respect to each lan-
guage, we have transformed identified valid locations to their corresponding
geo-coordinates with the help of GeoPy[35] - A Python client for several popu-
lar geocoding web services, that includes geocoder classes for the OpenStreetMap
Nominatim, Google Geocoding API (V3), and many other geocoding services. We
have used Nominatim, for:
1. Geocoding - the process of obtaining GPS coordinates cooresponding to a
valid location.
2. Reverse Geocoding - the process of obtaining location names using GPS co-
ordinates.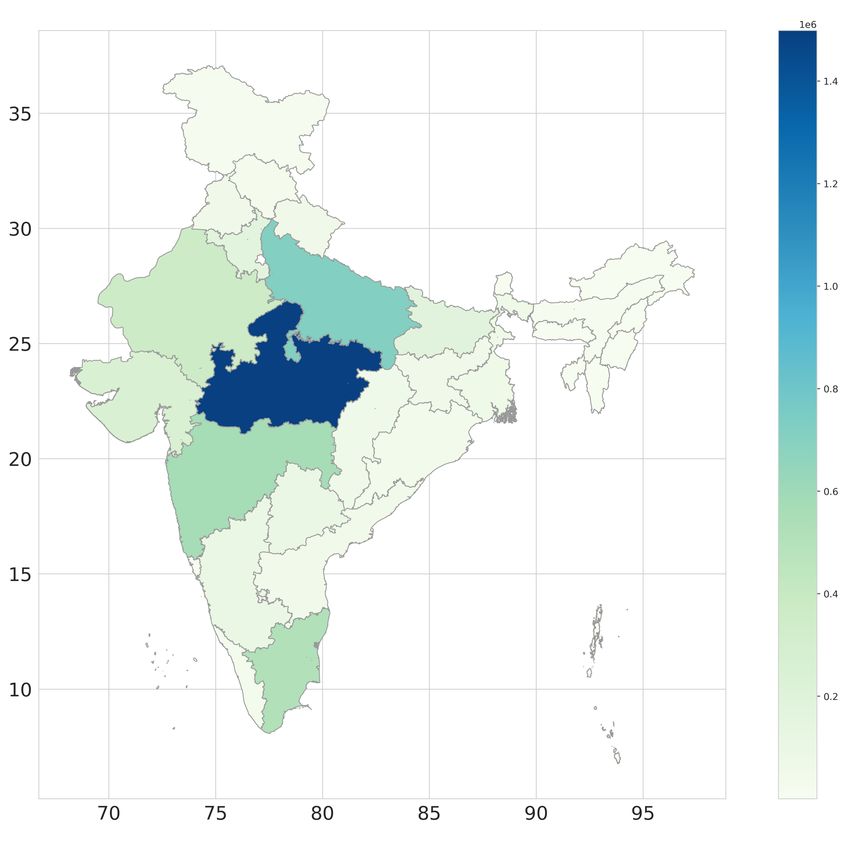
8 Deepak, Amit
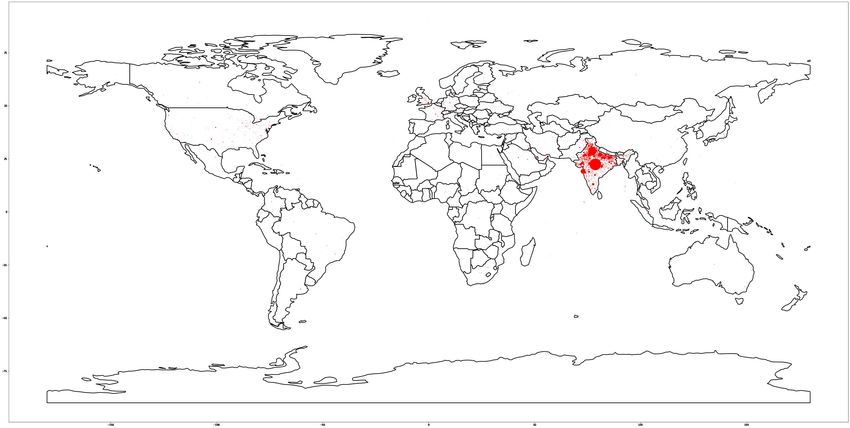
(a) Hindi (b) Tamil (c) Urdu (d) Marathi
(e) Telugu (f) Gujarati (g) Kannada (h) Bengali
(i) Malayalam (j) Oriya (k) Punjabi (l) Sindhi
Fig. 2: Visualization of Locations from Indian Regional Languages Tweets
Firstly, we listed all the locations and coordinates along with their number of
occurrences corresponding to each language.Given that some of these locations
were already in the form of coordinates, we transformed the remaining loca-
tions available in the textual format into coordinates using geocoding service
of Nominatim. We plotted the coordinates over a world map where the size of
a RED dot is directly proportional to the frequency or number of tweets done
around that location as shown in Fig. 2. The map shows that most of the tweets
corresponding to each language have originated from the region of the country
where the language is accepted as a regional language. In certain cases, tweets
of an otherwise regional language could also originate from a location around
the globe based on where the users of the language reside.
Tweets that mention India as their location are by default mapped to the
common latitude and longitude coordinates 22.3511148 , 78.6677428 and can
be seen marked in red in most of the maps. The distribution of state-wise tweets
is also shown in Fig. 3. The colour intensity shows the frequency of tweets with
the maximum intensity denoting the highest frequency.IRLCov19: A Large COVID-19 Multilingual Twitter Dataset 9
Fig. 3: State Wise Tweets Distribution
5 Identification and Analysis of User Influence Over The
Twittersphere
There are multiple ways to identify a user’s influence over the network, such as
In-degree (number of followers), number of retweets, number of favourites (likes)
received by the user on tweets, and number of mentions for the user in related
discussions over a period of time. The metrics, In-degree, retweets, favorites, and
mentions, in the aforementioned order, represent the user’s popularity, content
value, the preference among followers, and the user’s name value. These metrics
are collectively called influencing measures[9] and is crucial in identifying the
influence of a user over the network. Studies suggest that having millions of
followers doesn’t necessarily prove the influence of the user over the network
and is known as A millions followers fallacy[36]. Rather, an active audience who
mentions a user, likes, and retweets his or her tweets, makes more contribution
to the user’s influence.
Methodology for Comparing User Influence
We evaluated the influence measure for each user and used the relative or-
der of ranks as a measure of comparison for all 440,837 original users from the
dataset. We sorted the users in decreasing order of their influence measure where
rank 1 indicated a user with the highest influence. The ranks assigned to mea-
sures were further used to analyze how ranks varied across various influencing
measures and which categories of users were the top influencer for a measure.10 Deepak, Amit
Fig. 4: Scatterplots of Influencing Variables
We can utilise both the Pearson correlation coefficient or Spearman rank
correlation coefficient to measure the strength of an association between two
variables. Spearman rank correlation is preferred over Pearson correlation as it
can capture the non-linear association between two variables while the latter
can only capture the linear relation. Also, Pearson correlation works better on
normally distributed data which is quite not the scenarios as visible in Fig. 4.
The Spearman does not require data to be normally distributed and is better
suited to the need. Spearman correlation coefficient can be calculated by using
Eq.1 where Xi and Yi are the ranks of users based on two different influence
measures in a dataset of N users. A perfect positive correlation of +1 or a
negative correlation of -1 occurs when each of the variables is a perfect monotone
function of the other.
6Σ(Xi −Yi )2
ρ=1− N (N 2 −1) (1)
To investigate the correlation between four influencing measures for 4,40,837
original users, we calculated the Spearman rank correlation coefficient between
each pair of measures for each regional language as well as for all languages
combined as shown in Table 3. A moderately high correlation (above 0.5) exists
across the combinations of mention, retweet, and favourite measures. It indicates
that, in general, the users who are mentioned and liked more often are mostIRLCov19: A Large COVID-19 Multilingual Twitter Dataset 11
Table 3: Spearman’s Rank-Order Correlation Coefficients
Language Codes: Hindi - hi, Tamil - ta, Urdu - ur, Marathi - mr, Telugu - te, Gujarati - gu
Kannada - kn, Bengali - bn, Malayalam - ml, Oriya - or, Punjabi - pa, Sindhi - sd, All Languages - all
Language
hi ta ur mr te gu kn bn ml or pa sd all
Correlation
Follow-Favorite 0.388 0.492 0.471 0.453 0.587 0.427 0.58 0.51 0.561 0.579 0.395 0.501 0.41
Follow-Retweet 0.37 0.476 0.447 0.427 0.539 0.399 0.502 0.355 0.282 0.48 0.384 0.449 0.393
Follow-Mention 0.462 0.524 0.492 0.498 0.586 0.475 0.563 0.445 0.384 0.591 0.458 0.502 0.477
Favorite-Retweet 0.641 0.769 0.696 0.67 0.745 0.677 0.756 0.578 0.601 0.664 0.647 0.707 0.657
Favorite-Mention 0.591 0.711 0.649 0.648 0.712 0.657 0.734 0.573 0.614 0.672 0.607 0.697 0.61
Retweet-Mention 0.782 0.843 0.834 0.807 0.855 0.82 0.852 0.778 0.807 0.744 0.782 0.84 0.791
Table 4: Influencers Category and Corresponding Frequency
O - Overall Count, Fo - Followers, M - Mentions, R - Retweets, Fa - Favorite
Categories O, Fo, M, R, Fa Categories O, Fo, M, R, Fa
Politics 65,32,28,29,30 Religious 5,0,4,1,1
Media Org. 54,18,40,2,1 Sports 4,2,0,2,0
Media Person 29,9,13,20,18 NA 4,0,1,2,1
Entertainment 26,8,4,15,17 Others 2,0,1,1,0
Actor 20,12,0,12,15 Advocate 2,0,1,2,1
Cricket 15,14,0,3,8 YouTuber 1,1,0,0,0
Law 8,2,3,3,4 Suspend 1,0,0,1,0
Health 6,0,4,2,1 NGO 1,0,1,0,0
Corporate 6,2,0,4,2 Activist 1,0,0,1,1
retweeted. While there is a positive correlation of followers with the other three
measures, it doesn’t appear to be as prominent as with a combination of the
other three measures. This indicates that users with the most followers are not
necessarily most mentioned. Also, they may not always produce content that is
liked or retweeted most often. Effectively, the users with the most connections
may not necessarily be the most influential people in terms of engaging the
audience and having a significant outreach to the masses.
The influential users may fall into various categories of people or organiza-
tions based on their profession. We collected the Twitter profiles of the top 100
users of each measure to identify the category where the most influential users
might belong. These users were categorized into high-level categories such as
people, or organizations belonging to politics, media, entertainment, and sports,
etc. The data from Table 4 shows that most users across influencing categories
belong to people or organizations related to politics (Narendra Modi, PMO In-
dia, Amit Shah, Rahul Gandhi, Arvind Kejriwal, etc.), sports and entertain-
ment industry such as comedian, musicians, actors, cricketers (Salman Khan,
Virat Kohli, Kapil Sharma, Kumar Vishwas, Filmfare, Saloni Gaur, etc.), me-
dia persons or organizations (NDTV, Times of India, Aaj Tak, ABP News, Rajat
Sharma, Sweta Singh, Sudhir Chaudhary, etc.). Most of the users in the top 100
across measures are verified.
Users with a large number of followers get a lot of public attention owing
to the fact they are directly connected to people in large number. Those with a
relatively higher number of retweets or favourites have more engaging content
that people tend to like or even retweet to propagate information further. On the
other hand, users mentioned are notably political dignitaries such as the prime12 Deepak, Amit
minister and union ministers of the country, chief ministers of various states and
media persons or organizations. This indicates a deeper level of engagement or
communication among users. It could be in response to the various government
policies enacted during the pandemic, people voicing their opinions on the latest
policy updates or advisories issued by the government or health organizations,
or seeking help from individuals or organizations in emergencies.
We extracted the top 20 frequently occurring mentions from the IRLCov19
as shown in Table 5. The findings show that people who post content in their
regional languages generally prefer to mention regional media channels, local
or state leaders and authorities. The analysis could be useful to identify local
leaders and authorities that could eventually help raise awareness and propagate
help to the masses during the pandemic. The data further shows that most
of the users mentioned are political dignitaries, be it regional ministers, chief
ministers of states, prime minister of the country, along with the media persons
or organizations. A significant portion of the mentioned users is verified, while
those retweeting or posting the tweets are mostly non-verified.
The top influential users, across all four influential measures, are mostly
pre-eminent public figures. Further, the top 100 users in each category show a
significant overlap with one or the other. A combined list of the top 100 users
from each category contains just 250 unique users. We exploited the inference
drawn earlier about the three influential measures - mention, retweet and favorite
showing the highest correlation among them to pick up the top twenty mentions
across various regional languages as shown in Table 5. The data shows that
local leaders dominate in their corresponding region as per the regional language
spoken. We have categorized these mentions in various categories as indicated on
the top of the table. Each user in the table belongs to the category as indicated
by the symbol in () and a verified tag, used as subscript v, corresponding to
a verified Twitter profile. The prime ministers of countries and those related
to the prime minister’s office are shown in bold italics. The chief ministers,
deputy chief ministers and their offices are shown in bold only. For example
- narendramodi (Pv ) indicates that the user narendramodi is a PM, has a
verified Twitter profile and is related to politics.
6 DATASET ACCESS
The dataset is accessible on GitHub[8]. However, to comply with Twitter’s con-
tent redistribution policy[37], we are distributing only the IDs of the collected
tweets. Tools such as Hydrator[38] can be used to retrieve the full tweet object.IRLCov19: A Large COVID-19 Multilingual Twitter Dataset 13
Table 5: Top 20 Mentions Corresponding To Indian Regional Languages (IRLCov19 )
P - Related to Politics, MP/MO - Media Person/Org., HP/HO - Health Person/Org.
G/O - Govt. Org./Org., A - Artist, L - Related to Law, C - Corporate Person, R - Related to Religion
N - NGO, S - Account Suspended, W - Account Withheld, NA - Account Doesn’t Exist, OT - Others
HINDI TAMIL URDU MARATHI
narendramodi (Pv ) pttvonlinenews (MOv ) siasatpk (MOv ) rajeshtope11 (HPv )
aajtak (MOv ) news7tamil (MOv ) dawn news (MOv ) mahadgipr (Gv )
zeenews (MOv ) thatstamil (MOv ) urduvoa (MOv ) cmomaharashtra (Pv )
dchaurasia2312 (MPv ) cmotamilnadu (Pv ) bolnetwork (MOv ) abpmajhatv (MOv )
pmoindia (Pv ) polimernews (MOv ) nabthedentist (HP) pawarspeaks( Pv )
abpnews (MOv ) mkstalin (Pv ) arynewsud (MOv ) mataonline (MOv )
1stindianews (MO) sunnewstamil (Pv ) maizahameed (P) dev fadnavis (Pv )
lambaalka (Pv ) news18tamilnadu (MOv ) dunyanews (MOv ) officeofut (Pv )
chouhanshivraj (Pv ) thanthitv (MOv ) sheikhsafina (A) zee24taasnews (MOv )
opindia in (MO) ishatamil (N) maleehahashmey (MPv ) loksattalive (MOv )
myogiadityanath (Pv ) kalaignarnews (MO) imrankhanpti (Pv ) supriya sule (Pv )
mohfw india (HOv ) tamilthehindu (MOv ) gnnhdofficial (MO) marathi rash (MP)
ndtvindia (MOv ) jayapluschannel (MOv ) ptiofficial (Pv ) bbcnewsmarathi (MOv )
drharshvardha (HPv ) dinakaranonline (MOv ) dr firdouspti (Pv ) dgpmaharashtra (Lv )
ashokgehlot51 (Pv ) drramadoss (Pv ) fawadchaudhry (Pv ) narendramodi (Pv )
arvindkejriwal (Pv ) rajinikanth (Av ) hamidmirpak (MPv ) anildeshmukhncp (Pv )
vikasbhaabp (NA) vikatan (MPv ) bbcurdu (MPv ) smartpune (O)
drkumarvishwas (Av ) aloor shanavasPv ) psppakistan (Pv ) milokmat (MOv )
ashutosh83b (MPv ) narendramodi (Pv ) pakpmo (Pv ) ajitpawarspeaks (Pv )
sardanarohit (MPv ) arjunsaravanan5 (L) tahirulqadriur (R) pmoindia (Pv )
TELUGU GUJARATI KANNADA BENGALI
ntvjustin (MO) vtvgujarati (MO) bsybjp (Pv ) banglargorbomb (Pv )
arogyaandhra (HOv ) vijayrupanibjp (Pv ) cmofkarnataka (Pv ) abpanandatv (MOv )
janasenaparty (Pv ) news18guj (MOv ) siddaramaiah (Pv ) bbcbangla (MOv )
bbcnewstelugu (MOv ) narendramodi (Pv ) srisamsthana (R) bjp4bengal (Pv )
ysjagan (Pv ) cmoguj (Pv ) sriramulubjp (Pv ) ei samay (MOv )
pawankalyan (Pv ) sandeshnews (MO) publictvnews (MOv ) didikebolo (Pv )
telanganacmo (Pv ) ddnewsgujarati (MOv ) suvarn (OT) mamataofficial (Pv )
tarak9999 (Av ) divya bhaskar (MOv ) kumarishobakka (S) dailystarnews (MOv )
jaitdp (Pv ) bsnl gj (Gv ) prajavani (MOv ) airnews ghy (MOv )
urstrulymahesh (Av ) jitu vaghani (Pv ) narendramodi (Pv ) cpkolkata (Lv )
narendramodi (Pv ) zee24kalak (MOv ) kicchasudeep (Av ) cpim westbengal (Pv )
jspveeramahila (P) tv9gujarati (MOv ) shakunthalahs (P) aitcofficial (Pv )
bharatysrcp (Pv ) pibahmedabad (MOv ) bjp4karnataka (Pv ) dw bengali (MOv )
tv9telugu (MOv ) gujaratpolice (Lv ) oneindiakannada (MOv ) news18bengali (MOv )
bolisetti satya (P) nitinbhai patel (Pv ) vijaykarnataka (MOv ) narendramodi (Pv )
jspshatagniteam (MP) aravindchaudhri (MPv ) news18kannada (MOv ) kpeastsubndiv (Lv )
uttarandhranow (MO) bjp4gujarat (Pv ) inckarnataka (Pv ) pib india (MOv )
ncbn(Pv ) sanjayezhava (MP) anilkumble1074 (Av ) myanandabazar (MOv )
manvidad (OT) gujratsamachar (MOv ) puneethrajkumar (Av ) dailyittefaq (MO)
ktrtrs (Pv ) collectorbk (L) bbmpcomm (Lv ) mohfw india (HOv )
ORIYA MALAYALAM PUNJABI SINDHI
kanak news (MOv ) cmokerala (Pv ) jagbanionline (MOv ) khalidkoree (OT)
news18odia (MO) asianetnewstv (NA) dailyajitnews (MO) muradalishahppp (P)
sambad odisha (MO) vijayanpinarayi (Pv ) capt amarinder (Pv ) sialrabail (S)
otvkhabar (MO) manukumarjain (Cv ) ptc network (MOv ) mukhtar soomro (OT)
naveen odisha (Pv ) pibtvpm (MOv ) ptcnews (MO) mahamsindhi (MP)
cmo odisha (Pv ) thekeralapolice (Lv ) ishehnaaz gill (Av ) faraz aligg (OT)
hfwodisha (HOv ) manoramaonline (MOv ) punjabpmc (Pv ) bbhuttozardari (Pv )
odishareporter (MOv ) nishthvanth (OT) punjabgovtindia (Gv ) ayazlatifpalijo (Pv )
narendramodi (Pv ) news18kerala (MOv ) pib india (MOv ) dadu plus (S)
ipr odisha (MOv ) sathyamaanu (OT) mib india (MOv ) drhamadwassan (OT)
drgynaec (OT) thatsmalayalam (MOv ) gurmeetramrahim (W) ahtishamqhala (OT)
anandstdas (MP) ddnewsmalayalam (MOv ) narendramodi (Pv ) abbasimehwish (OT)
dpradhanbjp (Pv ) zhmalayalam (MO) newscheckerin (MOv ) sindhcmhouse (P)
nandighoshatv (MO) mfwaikerala (OT) cmopb (Pv ) sindhikhabroon (MO)
zeeodisha (MO) vikramanmuthu (OT) pibchandigarh (MOv ) najeebabro2 (P)
pmoindia (Pv ) avs ind (OT) incpunjab (Pv ) sangrisaeed (OT)
skilledinodisha (C) comrademallu (P) harsimratbadal (PV ) sama4newz (NA)
bjd odisha (Pv ) ambath (OT) punjabpoliceind (Lv ) mnavax (OT)
satyaparida01 (OT) kavyasree19941 (NA) sportsperson5 (OT) chandio gs (MP)
theargus in (NA) manoramanews (MOv ) derasachasauda (W) sindhicongress (N)14 Deepak, Amit
7 CONCLUSION AND FUTURE WORK
This paper presents IRLCov19 - a Twitter dataset of Indian regional languages
on the Covid-19 pandemic. The dataset has been collected over a period of 6
months between Feb 01, 2020, to July 31, 2020, and consists of over 13 million
multilingual tweets. The tweets in the IRLCov19 are from more than 1.4 million
Twitter users that includes more than 5k verified users. The tweets in the dataset
span 12 different Indian regional languages. The dataset can be advantageous for
researchers, Government authorities, and policymakers in studying the pandemic
from a varied perspective such as understanding public reactions and opinions,
early detection and surveillance of the pandemic etc.
Identifying influencers and their locations is a crucial task amid a crisis or
emergency. It paves the way for disease hotspot detection, employing suitable and
effective information publishing strategies, and tracking and debunking misinfor-
mation floating in the network. We utilized GeoPy, a python library, to extract
the location of a tweet and use it to collect relevant tweets from the identified
location. We further exploited the collected information to identify the top local
leaders or influencers and the profiles to which influencers belong. We plan to
update the dataset with more paradigms about the COVID-19 dataset related to
Indian Regional Languages. Future studies could explore the information-sharing
behaviour among the users and how different groups respond to the pandemic.
References
1. David A Broniatowski, Michael J Paul, and Mark Dredze. National and local
influenza surveillance through twitter: an analysis of the 2012-2013 influenza epi-
demic. PloS one, 8(12):e83672, 2013.
2. Sarah Vieweg, Amanda L Hughes, Kate Starbird, and Leysia Palen. Microblogging
during two natural hazards events: what twitter may contribute to situational
awareness. In Proceedings of the SIGCHI conference on human factors in computing
systems, pages 1079–1088, 2010.
3. HATİCE RAHMET GÜNER, Imran Hasanoğlu, and Firdevs Aktaş. Covid-19:
Prevention and control measures in community. Turkish Journal of medical sci-
ences, 50(SI-1):571–577, 2020.
4. Sarah Alqurashi, Ahmad Alhindi, and Eisa Alanazi. Large arabic twitter dataset
on covid-19. arXiv preprint arXiv:2004.04315, 2020.
5. Brian A Primack, Ariel Shensa, Jaime E Sidani, Erin O Whaite, Liu yi Lin, Daniel
Rosen, Jason B Colditz, Ana Radovic, and Elizabeth Miller. Social media use
and perceived social isolation among young adults in the us. American journal of
preventive medicine, 53(1):1–8, 2017.
6. Daniel A González-Padilla and Leonardo Tortolero-Blanco. Social media influence
in the covid-19 pandemic. International braz j urol, 46:120–124, 2020.
7. 2001 Census. https://en.wikipedia.org/wiki/2001_Census_of_India, 2021.
(Accessed: 2021-04-01).
8. Github. https://github.com/deepakuniyaliit/Covid19IRLTDataset, 2021. (Ac-
cessed: 2021-04-01).IRLCov19: A Large COVID-19 Multilingual Twitter Dataset 15
9. Meeyoung Cha, Hamed Haddadi, Fabricio Benevenuto, and Krishna Gummadi.
Measuring user influence in twitter: The million follower fallacy. In Proceedings of
the International AAAI Conference on Web and Social Media, volume 4, 2010.
10. Lifang Li, Qingpeng Zhang, Xiao Wang, Jun Zhang, Tao Wang, Tian-Lu Gao, Wei
Duan, Kelvin Kam-fai Tsoi, and Fei-Yue Wang. Characterizing the propagation of
situational information in social media during covid-19 epidemic: A case study on
weibo. IEEE Transactions on Computational Social Systems, 7(2):556–562, 2020.
11. Amit Agarwal, Deepak Uniyal, Durga Toshniwal, and Dipanjan Deb. Dense vector
embedding based approach to identify prominent disseminators from twitter data
amid covid-19 outbreak. IEEE Transactions on Emerging Topics in Computational
Intelligence, 5(3):308–320, 2021.
12. Ramez Kouzy, Joseph Abi Jaoude, Afif Kraitem, Molly B El Alam, Basil Karam,
Elio Adib, Jabra Zarka, Cindy Traboulsi, Elie W Akl, and Khalil Baddour. Coro-
navirus goes viral: quantifying the covid-19 misinformation epidemic on twitter.
Cureus, 12(3), 2020.
13. Daejin Choi, Selin Chun, Hyunchul Oh, Jinyoung Han, et al. Rumor propagation
is amplified by echo chambers in social media. Scientific reports, 10(1):1–10, 2020.
14. Alaa Alharbi and Mark Lee. Kawarith: an arabic twitter corpus for crisis events.
In Proceedings of the Sixth Arabic Natural Language Processing Workshop, pages
42–52, 2021.
15. Amit Agarwal and Durga Toshniwal. Identifying leadership characteristics from
social media data during natural hazards using personality traits. Scientific reports,
10(1):1–15, 2020.
16. Gopalkrishna Barkur and Giridhar B Kamath Vibha. Sentiment analysis of na-
tionwide lockdown due to covid 19 outbreak: Evidence from india. Asian journal
of psychiatry, 51:102089, 2020.
17. Xuehua Han, Juanle Wang, Min Zhang, and Xiaojie Wang. Using social media to
mine and analyze public opinion related to covid-19 in china. International Journal
of Environmental Research and Public Health, 17(8):2788, 2020.
18. Emilio Ferrara. What types of covid-19 conspiracies are populated by twitter bots?
First Monday, 2020.
19. Karishma Sharma, Sungyong Seo, Chuizheng Meng, Sirisha Rambhatla, and Yan
Liu. Covid-19 on social media: Analyzing misinformation in twitter conversations.
arXiv e-prints, pages arXiv–2003, 2020.
20. J Scott Brennen, Felix Simon, Philip N Howard, and Rasmus Kleis Nielsen. Types,
sources, and claims of covid-19 misinformation. Reuters Institute, 7:3–1, 2020.
21. Latika Gupta, Armen Yuri Gasparyan, Durga Prasanna Misra, Vikas Agarwal,
Olena Zimba, and Marlen Yessirkepov. Information and misinformation on covid-
19: a cross-sectional survey study. Journal of Korean medical science, 35(27), 2020.
22. Juan M Banda, Ramya Tekumalla, Guanyu Wang, Jingyuan Yu, Tuo Liu, Yuning
Ding, Katya Artemova, Elena Tutubalina, and Gerardo Chowell. A large-scale
covid-19 twitter chatter dataset for open scientific research–an international col-
laboration. arXiv preprint arXiv:2004.03688, 2020.
23. Koosha Zarei, Reza Farahbakhsh, Noel Crespi, and Gareth Tyson. A first insta-
gram dataset on covid-19. arXiv preprint arXiv:2004.12226, 2020.
24. Yong Hu, He yan Huang, An fan Chen, and Xian Ling Mao. Weibo-cov: A large-
scale covid-19 social media dataset from weibo. 2020.
25. Fatima Haouari, Maram Hasanain, Reem Suwaileh, and Tamer Elsayed. Arcov-19:
The first arabic covid-19 twitter dataset with propagation networks. In Proceedings
of the Sixth Arabic Natural Language Processing Workshop, pages 82–91, 2021.16 Deepak, Amit
26. Umair Qazi, Muhammad Imran, and Ferda Ofli. Geocov19: a dataset of hundreds
of millions of multilingual covid-19 tweets with location information. SIGSPATIAL
Special, 12(1):6–15, 2020.
27. Zhiwei Gao, Shuntaro Yada, Shoko Wakamiya, and Eiji Aramaki. Naist covid:
Multilingual covid-19 twitter and weibo dataset. arXiv preprint arXiv:2004.08145,
2020.
28. Norman Aguilar-Gallegos, Leticia Elizabeth Romero-Garcı́a, Enrique Genaro
Martı́nez-González, Edgar Iván Garcı́a-Sánchez, and Jorge Aguilar-Ávila. Dataset
on dynamics of coronavirus on twitter. Data in brief, 30:105684, 2020.
29. Gautam Kishore Shahi and Durgesh Nandini. Fakecovid–a multilingual cross-
domain fact check news dataset for covid-19. arXiv preprint arXiv:2006.11343,
2020.
30. Emily Chen, Kristina Lerman, and Emilio Ferrara. Tracking social media discourse
about the covid-19 pandemic: Development of a public coronavirus twitter data
set. JMIR Public Health and Surveillance, 6(2):e19273, 2020.
31. Deepak Uniyal and Ankit Rai. Citizens’ emotion on gst: A spatio-temporal analysis
over twitter data. arXiv preprint arXiv:1906.08693, 2019.
32. Deepak Uniyal and Sandeep Uniyal. Social media emerging as a third eye!! decoding
users’ sentiment on government policy: A case study of gst. In 2020 Fourth World
Conference on Smart Trends in Systems, Security and Sustainability (WorldS4),
pages 116–122. IEEE, 2020.
33. Amit Agarwal, Ritu Singh, and Durga Toshniwal. Geospatial sentiment analysis
using twitter data for uk-eu referendum. Journal of Information and Optimization
Sciences, 39(1):303–317, 2018.
34. Amit Agarwal and Durga Toshniwal. Face off: Travel habits, road conditions and
traffic city characteristics bared using twitter. IEEE Access, 7:66536–66552, 2019.
35. geopy. https://geopy.readthedocs.io/en/stable/, 2021. (Accessed: 2021-04-
08).
36. Mario Cataldi and Marie-Aude Aufaure. The 10 million follower fallacy: audi-
ence size does not prove domain-influence on twitter. Knowledge and Information
Systems, 44(3):559–580, 2015.
37. Twitter Developer Policy. https://developer.twitter.com/en/developer-terms/agreement-and-policy,
2021. (Accessed: 2021-04-01).
38. Hydrator. https://github.com/DocNow/hydrator, 2021. (Accessed: 2021-04-01).You can also read


