JANUARY 2019 1 - Green Growth Brands
←
→
Page content transcription
If your browser does not render page correctly, please read the page content below

JANUARY 2019
1
Disclaimer.
IMPORTANT: YOU MUST READ THE FOLLOWING BEFORE CONTINUING. The information contained                          cash flows that is based on assumptions about future economic conditions and courses of action that is
in this document has been prepared by Green Growth Brands Inc. (the “Company” or “Green Growth”).            not presented in the format of a historical statement of financial position, statement of comprehensive
The information contained in this document (a) does not purport to contain all the information that          income or statement of cash flows. Future-oriented financial information and financial outlook are made
may be necessary or desirable fully and accurately to evaluate an investment in the Company and (b) is       as of the date hereof, subject to the same assumptions, risk factors and other qualifications as all other
not to be considered as a recommendation by the Company that any person make an investment in the            forward-looking information, and presented solely for the purpose of conveying the current anticipated
Company. The information contained herein, unless otherwise stated, is provided as at the date hereof        expectations of the Company and may not be appropriate for any other purposes.
and is subject to change without notice; the Company undertakes no obligation to publicly update any
such statement or to reflect new information or the occurrence of future events or circumstances except      The forward-looking events and circumstances discussed in this release include, but are not limited to, (i)
as required by securities laws. Certain information contained herein supplied by third parties, including    the cannabis and cannabidiol industry and regulatory environment, including expected growth generally
the public disclosure made by the Aphria Inc. (“Aphria”); while the Company believes the information         and in the retail and personal care segments, (ii) the future strategy, plans and partnerships of Green
provide by third parties to be accurate, there can be no assurance of this fact.                             Growth, including following the proposed combination with Aphria (the “Offer” or the “Offering”),
                                                                                                             (iii) the Offer, the terms of the Offer and the anticipated timing of commencement of the Offer, (iv)
This document is provided solely for informational purposes and may not be reproduced, in whole or           the benefit of the Offer to both Green Growth and Aphria, including the creation of wealth and value
in part, in any form or forwarded or further distributed to any person. Any forwarding, distribution or      and the synergies that may be created by the Offer, (v) the nature of the operations of the combined
reproduction of this document in whole or in part is unauthorized.                                           company following completion of the Offer, (vi) the C$300 financing, its timing and terms, and (vi)
                                                                                                             expectations regarding the ownership, management, operation and size of Green Growth following
The Company is in the early stage of development and has a limited operational history, making it            completion of the Offer and related financing,
difficult to accurately predict business operations. The Company has limited resources and may run
out of capital prior to becoming profitable. The Company may fail and investors may lose their entire        Certain material factors and assumptions were applied in providing this forward-looking information.
investment.                                                                                                  All material assumptions used in making forward-looking statements are based on Green Growth’s
                                                                                                             knowledge of its business and the business of Aphria, and, in some cases, information supplied by third
This document may have been accessed or sent to you in an electronic form. You are reminded that             parties, including the public disclosure made by Aphria. Certain material factors or assumptions include,
documents transmitted via this medium may be altered or changed during the process of electronic             but are not limited to, (i) the current business conditions and expectations of future business conditions
transmission. You are responsible for protecting against viruses and other destructive items. Your receipt   and trends affecting Green Growth and Aphria, including the US and Canadian economy, the cannabis
of this electronic transmission is at your own risk and it is your responsibility to take precautions to     and cannabidiol industry in Canada, the US and elsewhere, and capital markets, and (ii) that there have
ensure that it is free from viruses and other items of a destructive nature. As a consequence of the         been no material changes in the business, affairs, capital, prospects or assets of the Aphria. All forward-
above, neither the Company nor any director, officer, employee or agent of any of them or any affiliate      looking statements in this document are qualified by these cautionary statements. Green Growth
of any such person accepts any liability or responsibility whatsoever in respect of any difference between   believes that the expectations reflected in forward-looking statements are based upon reasonable
the document distributed to you in electronic format and the hard copy version that may be made              assumptions; however, Green Growth can give no assurance that the actual results or developments
available to you.                                                                                            will be realized by certain specified dates or at all. These forward-looking statements are subject to a
                                                                                                             number of risks and uncertainties that could cause actual results or events to vary materially from those
                                                                                                             expressed or implied by the forward-looking statements. These risks, uncertainties and assumptions
FORWARD LOOKING INFORMATION                                                                                  could adversely affect the outcome and financial effects of the plans and events described herein. In
                                                                                                             addition to risks noted elsewhere in this document, material risks include, but are not limited to, (i) the
This document includes information, statements, beliefs and opinions which constitute “forward-              risk that the Offer will not be commenced or that the conditions to the Offer will not be met, or met
looking information” within the meaning of applicable securities laws which includes “future-oriented        on a timely basis, or that the transaction will not be consummated for any other reason, (ii) changes
financial information” with respect to prospective financial performance, financial position, EBITDA,        in general economic conditions in Canada, the United States and elsewhere, (iii) changes in operating
cash flows and other financial metrics that are presented either as a forecast or a projection. Wherever     conditions (including changes in the regulatory environment) affecting the cannabis industry, (iv)
possible, forward-looking information can be identified by the expressions “seeks”, “expects”, “believes”,   fluctuations in currency and interest rates, availability materials and personnel, and (v) Green Growth’s
“estimates”, “will”, “plans”, “may”, “believes”, “anticipates,” “target” and similar expressions (or the     ability to successfully integrate the operations of Green Growth and Aphria following completion of
negative of such expressions). The forward-looking statements are not historical facts, but reflect the      the Offer, including ability to retain key Aphria personnel and renegotiate certain contracts to obtain
current expectations of Green Growth regarding future results or events and are based on information         economies of scale or other synergies. Readers, therefore, should not place undue reliance on any
currently available to it. Future-oriented financial information is forward-looking information about        such forward-looking information. Further, forward-looking information speaks only as of the date on
prospective results of operations, financial position or cash flows, based on assumptions about future       which such statement is made. Green Growth undertakes no obligation to publicly update any such
economic conditions and courses of action, and presented in the format of a historical statement of          statement or to reflect new information or the occurrence of future events or circumstances except as
financial position, statement of comprehensive income or statement of cash flows. Similarly, a “financial    required by securities laws. Even if the outcome and financial effects of the plans and events described
outlook” is forward-looking information about prospective financial performance, financial position or       herein are consistent with the forward-looking statements contained in this document, those results

                                                                                                                                                                                                                   2
Disclaimer (cont’d).
or developments may not be indicative of results or developments in subsequent periods. Forward-                   CAUTIONARY STATEMENT RESPECTING THE OFFER
looking information contained in this presentation is based on our current estimates, expectations and
projections, which we believe are reasonable as of the current date. You should not place undue reliance           AT THE TIME OF YOUR RECEIPT OF THIS DOCUMENT, GREEN GROWTH MAY NOT HAVE
on forward-looking statements, which are based on the information available as of the date of this                 COMMENCED THE OFFER. UPON COMMENCEMENT OF THE OFFER, GREEN GROWTH WILL
document.                                                                                                          DELIVER THE TAKE-OVER BID CIRCULAR TO HOLDERS OF APHRIA’s SHARES IN ACCORDANCE
                                                                                                                   WITH APPLICABLE CANADIAN SECURITIES LAWS AND WILL FILE A TAKE-OVER BID CIRCULAR WITH
Historical statements contained in this document regarding past trends or activities should not be taken           THE SECURITIES COMMISSIONS IN EACH OF THE PROVINCES AND TERRITORIES OF CANADA.
as a representation that such trends or activities will continue in the future. In particular historical results   THE TAKE-OVER BID CIRCULAR WILL CONTAIN IMPORTANT INFORMATION ABOUT THE OFFER
of the Company should not be taken as a representation that such trends will be replicated in the future.          AND SHOULD BE READ IN ITS ENTIRETY BY APHRIA’S SHAREHOLDERS. THIS DOCUMENT IS FOR
No statement in this document is intended to be nor may be construed as a profit forecast.                         INFORMATIONAL PURPOSES ONLY AND DOES NOT CONSTITUTE OR FORM PART OF ANY OFFER
                                                                                                                   TO BUY OR INVITATION TO SELL, OTHERWISE ACQUIRE, OR SUBSCRIBE FOR ANY SECURITY. THE
NON-GAAP MEASURES                                                                                                  OFFER WILL ONLY BE MADE PURSUANT TO A FORMAL OFFER AND TAKE-OVER BID CIRCULAR.
                                                                                                                   THE OFFER WILL NOT BE MADE IN, NOR WILL DEPOSITS OF SECURITIES BE ACCEPTED FROM A
                                                                                                                   PERSON IN, ANY JURISDICTION IN WHICH THE MAKING OR ACCEPTANCE THEREOF WOULD NOT
This document contains references to certain financial measures that are not defined under the generally           BE IN COMPLIANCE WITH THE LAWS OF SUCH JURISDICTION. HOWEVER, GREEN GROWTH MAY,
accepted accounting principles applicable to the Company, being International Financial Reporting                  IN ITS SOLE DISCRETION, TAKE SUCH ACTION AS IT DEEMS NECESSARY TO EXTEND THE OFFER
Standards applicable to Canadian public companies formulated by the International Accounting                       IN ANY SUCH JURISDICTION.
Standards Board (“IFRS”).
                                                                                                                   THE CONTEMPLATED CONSUMMATION OF THE CONCURRENT BROKERED FINANCING
These non-IFRS financial measures are “EBITDA”, “EBITDA margin”, “EBITDA per Kiosk” and “TEV /                     OF C$300 MILLION DESCRIBED HEREIN, AT A PRICE PER SHARE OF C$7.00, AND THE
EBITDA”.                                                                                                           CONTEMPLATED BACKSTOP COMMITMENT IN THAT REGARD, ARE SUBJECT TO A VARIETY OF
                                                                                                                   CONTINGENCIES AND CONDITIONS, INCLUDING SATISFACTORY COMPLETION OF CUSTOMARY
The Company uses these as non-IFRS financial measures to provide investors with supplemental                       DUE DILIGENCE AS TO BOTH APHRIA AND GREEN GROWTH, AGREEMENT ON MUTUALLY
measures of its operating and financial performance (or expected operating and financial performance),             AGREEABLE DEFINITIVE DOCUMENTATION, AND OTHER CUSTOMARY UNDERTAKINGS AND
as they highlight trends in the Company’s core business that may not otherwise be apparent when one                CONDITIONS. NO BINDING COMMITMENT OF ANY KIND HAS YET BEEN MADE IN THIS REGARD,
relies solely on IFRS measures. The Company believes certain investors may also use this information to            AND READERS SHOULD NOT ASSUME ANY SUCH COMMITMENT WILL BE MADE UNLESS AND
assess the Company’s performance and determine the Company’s ability to generate cash flow.                        UNTIL REFLECTED IN A BINDING INSTRUMENT AGREED BY THE CONTEMPLATED FUNDING
                                                                                                                   SOURCES, WHICH CANNOT AND SHOULD NOT BE ASSUMED OR ASSURED.
The Company defines these non-IFRS financial measures as follows:
                                                                                                                   CAUTIONARY NOTE REGARDING UNITED STATES SECURITIES LAWS
* “EBITDA” is defined as net earnings before interest, income taxes, depreciation and amortization,
                                                                                                                   THIS PRESENTATION DOES NOT CONSTITUTE AN OFFER TO SELL OR THE SOLICITATION OF AN
* “EBITDA margin” is defined as EBITDA margin dollars divided by revenue,                                          OFFER TO BUY, NOR SHALL THERE BE ANY SALE OF THE SECURITIES IN ANY JURISDICTION IN
                                                                                                                   WHICH SUCH OFFER, SOLICITATION OR SALE WOULD BE UNLAWFUL PRIOR TO REGISTRATION
                                                                                                                   OR QUALIFICATION UNDER THE SECURITIES LAWS OF SUCH JURISDICTION. ANY SECURITIES OF
* “EBITDA per Kiosk” is defined as total annualized EBITDA for kiosks at the end of fiscal year divided by         GREEN GROWTH BRANDS HAVE NOT BEEN AND WILL NOT BE REGISTERED UNDER THE UNITED
the number of kiosks, and                                                                                          STATES SECURITIES ACT OF 1933, AS AMENDED (THE “U.S. SECURITIES ACT”), OR ANY STATE
                                                                                                                   SECURITIES LAWS AND MAY NOT BE OFFERED OR SOLD WITHIN THE UNITED STATES OR TO, OR
* “TEV / EBITDA” is defined as total enterprise value / EBITDA, where total enterprise value is calculated         FOR THE ACCOUNT OR BENEFIT OF, “U.S. PERSONS,” AS SUCH TERM IS DEFINED IN REGULATION
as at the stated date.                                                                                             S UNDER THE U.S. SECURITIES ACT, UNLESS AN EXEMPTION FROM SUCH REGISTRATION IS
                                                                                                                   AVAILABLE.
These non-IFRS financial measures do not have any standardized meaning under IFRS and therefore
may not be comparable to similar measures presented by other issuers. As such, Non-IFRS financial
measures should not be considered in isolation or as a substitute for measures prepared in accordance
with IFRS. Non-IFRS financial measures are not necessarily indicative of, and should not be construed as
alternatives to, other earnings measures determined in accordance with IFRS.

                                                                                                                                                                                                    3
BATH       AMERICAN
VICTORIA’S
 SECRET
                AND         EAGLE
                                       DSW
             BODY WORKS   OUTFITTERS

                                             4
Peter Horvath        CEO       Ed Kistner     CAO             Kellie Wurtzman        CSO         Scott Razek      CMO

Prior Roles:Chairman, CEO,     Prior Roles: EVP Merchandise   Prior Roles: SVP Stores &          Prior Roles: CMO,
CFO, COO                       Planning and Operations, SVP   Operations, VP Store Operations,   Creative Director, VP
Companies: American Eagle      Merchandise Planning, VP of    VP Head of Stores, District        Creative, VP Marketing,
Outfitters, DSW, L Brands      Finance                        Sales Manager                      Director of Marketing
(Victoria’s Secret), Mission   Companies: DSW, L Brands       Companies: Luxottica Retail,       Companies: Bath &
Essential                      (Victoria’s Secret)            L Brands (Victoria’s Secret),      Body Works, L Brands
                                                              Virgin Entertainment               (Victoria’s Secret), The
                                                                                                 Limited Stores, American
                                                                                                 Eagle Outfitters, Pillar
                                                                                                 Technologies

                                                                                                                        5
Andrew Jolley | Chief Growth Officer                Tobin Anderson | GM Brand and Product
Prior Roles: Owner, President                       Development
Companies: Nevada Organic Remedies,                 Expertise: Merchandising, product
Nevada Dispensary Association                       development, branding and design
                                                    Companies: Alex and Ani, C. Wonder, Yankee
Kent Kiffner | General Counsel                      Candle Company, Sally Beauty, LensCrafters,
Expertise: Regulatory compliance, contract          Crabtree & Evelyn, Bath & Body Works
capture, litigation and risk management
Companies: Mission Essential, US Dept.              Patrick Peters | Sales Manager
of Justice                                          Expertise: Go-to-market strategies and
                                                    execution, brand and strategies, organizational
Fritz Hoefer | Chief Merchant
                                                    effectiveness
Expertise: Creating and sourcing innovative
consumer products from concept to market            Companies: Unilever
Companies: L Brands (Victoria’s Secret),            Marc La Vorgna | Chief Political Advisor
Avon Products, Burt’s Bees, L’Oreal Paris,          Prior Roles: Press Secretary, Assistant
Dove, Lancôme, Unilever, Crabtree & Evelyn,         Director Media Relations
Abercrombie & Fitch, Johnson & Johnson,
Bath & Body Works                                   Experience: Mayor Mike Bloomberg, Obama
                                                    for America, New York and New Jersey Port
Kevin Wadhams | Director of Sourcing                Authority, Congressman Bill Pascrell
Expertise: Sourcing and vendor qualifications,
production, regulatory requirements, QA
testing, shipping, sampling, costing and delivery
Companies: Bath & Body Works, Unilever

                                                                                                      6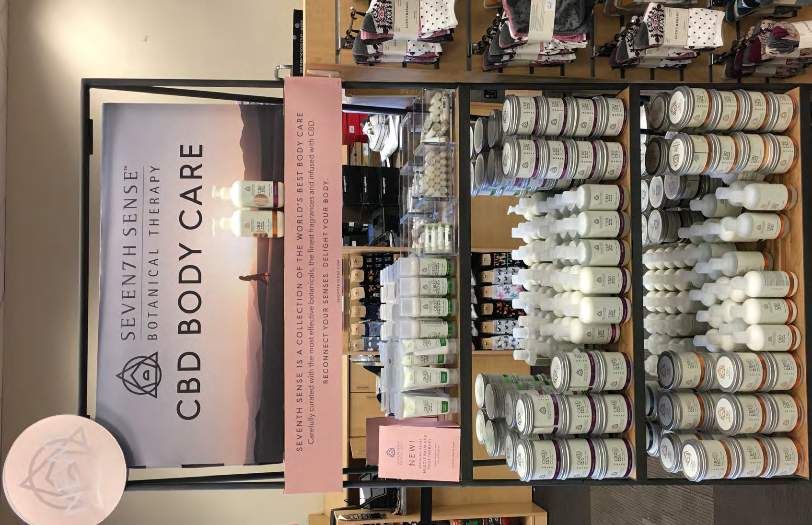
Two Booming Markets.
         One Massive

     Cannabis Retail Goods                                                 CBD Personal Care
                 Capital Intensive                                                        G&A Intensive
                 High EBITDA                                                              High EBITDA
                 Funds Constrained by the State                                           Free-Flowing Funds
                 Harsh Federal Tax 280E                                                   Normal Tax Rate
                 $12B $40B in Five Years*                                                 $200M $22B in Five Years*

                                     Dispensaries                                                             Kiosks

                                     Wholesale                                                                Wholesale

                                     E-commerce                                                               E-commerce

*Expectation based on Ackrell Capital: 2018 Cannabis Investment Report   *Expectation based on Brightfield Group research reports
                                                                                                                                    7
Strategic

Partners.
Investor

Access to

Access to

Access to   8
US CANNABIS MARKET                                              us cannabis market : sales
                                                                      (in billions usd)
                                                                                                         40
In the next 5 years,                                40

the industry is                                     35

expected to                                                         ~$28 Billion
                                                    30
generate over
$28 billion of new                                  25

revenue from an                                     20

estimated 14 million                                15            12
new customers.                                      10

                                                    5

                                                     0
                                                         2017    2018E   2019E   2020E   2021E   2022E   2023E

 Ackrell Capital: 2018 Cannabis Investment Report
                                                                                                                 9
Skate where
the puck
is going.

              We know our
              current customer –

                                   10
CURRENT LANDSCAPE
Only 28% of consumers
Retail has changed trust national brands.
(and will continue MILLENNIALS & CENTENNIALS
to change). 51% think all news is
Drinking is down 28%.
Mobile is essential.
We expect at least 50% of transactions to happen on a smart phone,
whether click and collect or delivery (where legally permissable).
Spending 17% more on self-care.
Digital will drive first Spending 24% more on food.
impressions.
Instagram will be a primary way that most customers will learn about Localization is by neighborhood,
and interact with us.
not city or state.
Sustainability is more than a
Exceptional store
experiences create loyalty.
We know that the stickiest customers come from in-store experiences. Instagram-able interiors are part
of a remarkable experience.
11ASSORTMENT ARCHITECTURE
Intentional Store Navigation
Our Approach The Results
Narrow + Deep Always In-Stock
Assortment
Consumer Store Related Selling +
Exploration Tier Migration
Associate Ease of Higher Average
Understanding Spend
12OUR FAVORITE EXISTING CUSTOMER EXPERIENCE
The top 100
cannabis stores are
$17 Million
an n u al trailing revenue *
all underperforming
their market potential.
transactions
PER DAY
Then there’s
$14k >20%
PRODUCTIVITY E BI T DA
What we saw made us want to own it. In addition to being one of the
most productive stores we’ve ever seen, The Source leads in customer
experience due to its meticulous layout, efficient operation
per sq. ft. **
MARGIN
and incredibly knowledgeable and friendly staff.
PLANTING THE SEEDS, SCALE FAST.
*net sales after taxes + discounts
**trailing 12 month revenue / 1,200 selling square feet
13THE SOURCE.
The
Flower
Shop
142021 revenue of $439 m across 37 stores with ebitda rate of 26%
Cannabis OPPORTUNITY OVERVIEW
Dispensaries • Own and operate The+Source (Las Vegas) and own an irrevocable option for The+Source (Henderson)
(Excludes • Own license for three Massachusetts dispensaries acquired via Just Healthy (plans for Northampton and Cambridge, MA locations
underway)
Cultivation) • Awarded seven additional dispensary licenses by Nevada, for greater Las Vegas and Reno (first of new Nevada dispensaries to open
in Q2, 2019)
• Retail locations offer an exceptional customer experience, resulting in optimized sales per selling square foot and high transaction
frequency
• Stores to be branded Camp, Meri +Jayne, Green Lily and other Green Growth Brands concepts, based on neighborhood and
location
• NOTE: Two Nevada cultivation facilities (Las Vegas and Pahrump) and one Massachusetts cultivation facility license (acquired via
Just Healthy) revenues and EBITDA are not included in the chart below
FINANCIAL IMPACT
(US$)
Cannabis Stores 2019E 2020E 2021E
Total Stores at Year End 17 27 37
Total Revenue $101,087,136 $312,516,119 $438,891,925
Total EBITDA $27,486,462 $83,316,933 $115,170,279
EBITDA Margin 27% 27% 26%
Per Store Metrics 2019E 2020E 2021E
Buildout Capex per Store $1,000,000 $1,000,000 $1,000,000
Avg. Selling Sq. Ft. per Store 1,200 1,200 1,200
Annual Sales per Sq. Ft. $12,138 $11,266 $11,315
Annualized Sales per Store $14,566,729 $13,519,116 $13,578,160
EBITDA Margin 27% 26% 26%
Annualized EBITDA per Store $3,932,321 $3,571,923 $3,541,764 ™
EBITDA is net income (loss), plus (minus) income taxes (recovery) plus (minus) finance income, net, plus amortization, plus share-based compensation, plus (minus)
non-cash fair value adjustments on sale of inventory and on growth of biological assets, plus impairment of intangible assets, plus transaction costs, plus (minus) loss
(gain) on disposal of capital assets, plus (minus) loss (gain) on foreign exchange, plus (minus) loss (gain) on marketable securities, plus (minus) loss (gain) from equity
investee, minus deferred gain on sale of intellectual property, plus (minus) loss (gain) on dilution of ownership in equity investee, plus (minus) unrealized loss (gain)
on convertible notes receivable, plus (minus) loss (gain) on long-term investments and certain one-time non-operating expenses, as determined by management.
Management believes this measure provides useful information as it is a commonly used measure in the capital markets and as it is a close proxy for repeatable cash
generated by operations.
15THE CANNABIDIOL (CBD) MARKET cbd market : sales
(in billions)
From $200 million 30B
in 2017, expected to
grow to over 22B
$22 billion 20B 18B
by 2022.
11B
10B
5B
500M
200M
0
2017 2018E 2019E 2020E 2021E 2022E
Expectation based on Brightfield Group research reports
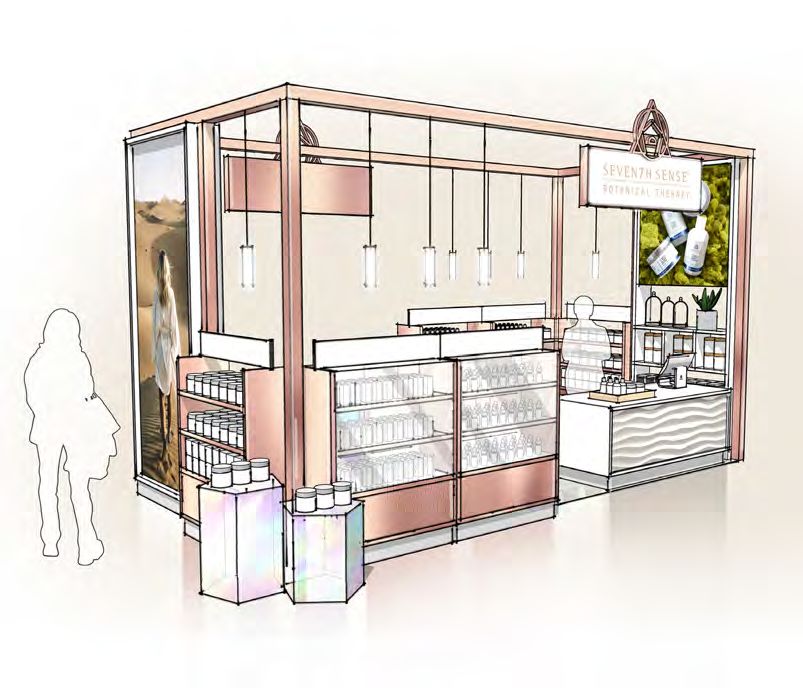
16Mall 2021 revenue of $120m across 450 mall kiosks with ebitda rate of 32%
Kiosks
OPPORTUNITY OVERVIEW
• Open 450 CBD focused kiosks in prime mall locations
• Prime locations located within high-traffic, desirable sections of the mall (i.e. near Apple, Tesla, etc.)
• Partnering with property groups that own, manage and develop premier shopping, dining, entertainment and mixed-used destinations
FINANCIAL IMPACT
(US$)
Kiosks 2019E 2020E 2021E
Total Kiosks at Year End 302 450 450
Total Revenue $30,000,000 $100,000,000 $120,000,000
Total EBITDA $9,720,000 $32,400,000 $38,880,000
EBITDA Margin 32% 32% 32%
Per Kiosk Metrics 2019E 2020E 2021E
Buildout Capex per Store $150,000 $150,000 $150,000
Selling Sq. Ft. per Store 183 183 183
Annual Sales per Sq. Ft $1,250 $1,265 $1,460
Annual Sales per Kiosk $228,270 $230,988 $266,667
EBITDA Margin 32% 32% 32%
EBITDA per Kiosk $73,960 $74,840 $86,400
EBITDA is net income (loss), plus (minus) income taxes (recovery) plus (minus) finance income, net, plus amortization, plus share-based compensation, plus (minus) non-cash fair value
adjustments on sale of inventory and on growth of biological assets, plus impairment of intangible assets, plus transaction costs, plus (minus) loss (gain) on disposal of capital assets,
plus (minus) loss (gain) on foreign exchange, plus (minus) loss (gain) on marketable securities, plus (minus) loss (gain) from equity investee, minus deferred gain on sale of intellectual
property, plus (minus) loss (gain) on dilution of ownership in equity investee, plus (minus) unrealized loss (gain) on convertible notes receivable, plus (minus) loss (gain) on long-term
investments and certain one-time non-operating expenses, as determined by management. Management believes this measure provides useful information as it is a commonly used
measure in the capital markets and as it is a close proxy for repeatable cash generated by operations.
17E verydollar in revenue from CBD retail should translate into a
E-Commerce dollar revenue in e - commerce
OPPORTUNITY OVERVIEW
• E-commerce will be our biggest revenue and EBITDA store
• E-commerce sites retailing our selection of CBD products, allowing consumers to browse and shop online
• Our Pro Forma assumes 35% of all CBD orders to be placed through site
• Will support additional purchases after initial purchases from brick and mortar channels
• Seventh Sense website launch scheduled for early February 2019
FINANCIAL IMPACT
(US$)
CBD 2019E 2020E 2021E
Annual E-com Revenue $15,000,000 $70,000,000 $84,000,000
Total EBITDA $5,400,000 $25,200,000 $30,240,000
EBITDA Margin 36% 36% 36%
EBITDA is net income (loss), plus (minus) income taxes (recovery) plus (minus) finance income, net,
plus amortization, plus share-based compensation, plus (minus) non-cash fair value adjustments
on sale of inventory and on growth of biological assets, plus impairment of intangible assets, plus
transaction costs, plus (minus) loss (gain) on disposal of capital assets, plus (minus) loss (gain) on
foreign exchange, plus (minus) loss (gain) on marketable securities, plus (minus) loss (gain) from
equity investee, minus deferred gain on sale of intellectual property, plus (minus) loss (gain) on
dilution of ownership in equity investee, plus (minus) unrealized loss (gain) on convertible notes
receivable, plus (minus) loss (gain) on long-term investments and certain one-time non-operating
expenses, as determined by management. Management believes this measure provides useful
information as it is a commonly used measure in the capital markets and as it is a close proxy for
repeatable cash generated by operations.
18Retail 2021 revenue of $41m across 1,000 stores with ebitda rate of 40%
Partnerships
OPPORTUNITY OVERVIEW
• Partnering with retailers that have global and North American footprints to sell CBD personal care products
• The recent passing of the updated Farm Bill (replacing The Agricultural Act of 2014) included the declassification of hemp as a controlled
substance and opens the door for the retail sale of CBD products
• Partnership allows for accesss to most valuable demographic of millennials
• Retailer A generated US$3.8 billion in net sales in FY2017 and operates more than 1,000 stores
• Retailer B generated US$2.8 billion in net sales through its retail network in FY2017 and operates more than 500 stores
RETAILER A: FINANCIAL IMPACT RETAILER B: FINANCIAL IMPACT
(US$) (US$)
Retailer A 2019E 2020E 2021E Retailer B 2019E 2020E 2021E
Total Stores at Year End 500 500 500 Total Stores at Year End 500 500 500
Total Revenue $4,815,000 $15,000,000 $20,626,419 Total Revenue $5,529,000 $15,000,000 $20,000,000
Total EBITDA $1,733,400 $5,700,000 $8,250,568 Total EBITDA $1,990,440 $5,700,000 $8,000,000
EBITDA Margin 36% 38% 40% EBITDA Margin 36% 36% 40%
Per Store Metrics 2019E 2020E 2021E Per Store Metrics 2019E 2020E 2021E
Average SKUs per Store 50 119 155 Average SKUs per Store 50 125 132
Units per SKU per Store 12 12 12 Units per SKU per Store 12 12 12
Min. Inventory per SKU 7 7 7 Min. Inventory per SKU 7 7 7
Avg. Wholesale Unit Price $6.00 $6.30 $6.90 Avg. Wholesale Unit Price $6.00 $6.00 $6.90
% of Inventory Sold Weekly 7.0% 7.0% 7.0% % of Inventory Sold Weekly 8.0% 8.0% 8.0%
Digital Sales % of Shelf Sales 33.4% 33.4% 33.4% Digital Sales % of Shelf Sales 33.4% 33.4% 33.4%
EBITDA is net income (loss), plus (minus) income taxes (recovery) plus (minus) finance income, net, plus amortization, plus share-based compensation, plus (minus) non-cash fair value
adjustments on sale of inventory and on growth of biological assets, plus impairment of intangible assets, plus transaction costs, plus (minus) loss (gain) on disposal of capital assets,
plus (minus) loss (gain) on foreign exchange, plus (minus) loss (gain) on marketable securities, plus (minus) loss (gain) from equity investee, minus deferred gain on sale of intellectual
property, plus (minus) loss (gain) on dilution of ownership in equity investee, plus (minus) unrealized loss (gain) on convertible notes receivable, plus (minus) loss (gain) on long-term
investments and certain one-time non-operating expenses, as determined by management. Management believes this measure provides useful information as it is a commonly used
measure in the capital markets and as it is a close proxy for repeatable cash generated by operations.
19Expectations
MASS Market appeal at
1/3 the price of competition
Seventh Sense product is selling
through at THREE times typical
performance of personal care products
Product sold out in FOUR weeks
Top performers:
Muscle Balm, Foot Cream, Body
Lotion and Lip Balm
Never before seen brand. Zero
marketing beyond point of sale.
20ggb summary
000,000s USD
FINANCIALS
Geranium Financial Forecast – Organic Growth Only
• 2021 revenue, excluding license capture, of $563M with EBITDA rate of 26%
If we limit our pro-forma to organic growth only, Geranium is projected to grow
z
• to2021 revenue,
generate overwith additional
$200 millionlicense capture,
in EBITDA of $784M with EBITDA rate of 26%
in 2021
Segmented Forecast
Pro forma (US$ millions) Trailing 12
Stores/
Cult Sales
Stores/
Cult
2019 (proj)
Sales EBITDA
2020 (proj)
Sales EBITDA
2021 (proj)
Sales EBITDA
financials Cannabis
Nevada existing 2/1 $39.4 2/1 $48 $15 $50 $15 $52 $16
Pahrump - 0/1 18 7 43 17 43 17
New Nevada Licenses - 7/0 38 10 112 31 118 32
New Massachusetts - 3/1 21 7 95 32 98 33
CBD / Personal Care
Kiosks - 302 30 10 100 32 120 39
Web - 4 15 5 70 25 84 30
Stores - 5 3 1 5 2 5 2
Retailer B - 500 6 2 15 6 20 8
Retailer A - 500 5 2 15 6 21 8
Total GGB (current assets + G&A) $184 $22 $507 $128 $563 $146
Total GGB (current assets + capture + G&A) $196 $25 $612 $154 $784 $201
C$ Total GGB (current assets + capture + G&A) $267 $34 $831 $210 $1065 $273
%Capture
(1) Changeassumes
from Street Consensus
5 licenses (through Estimates 89%
application) in 2019, 10 in 2020, 10 in 2021.3% 88% 103% 35% 50%
(2) EBITDA is net income (loss), plus (minus) income taxes (recovery) plus (minus) finance income, net, plus amortization, plus share-
Source: Company Disclosure
based
To compensation,
us there plus (minus)
are no foreign markets.™ non-cash fair value adjustmentsPage
on5 sale of inventory and on growth of biological assets, plus im-
pairment of intangible assets, plus transaction costs, plus (minus) loss (gain) on disposal of capital assets, plus (minus) loss (gain) on
foreign exchange, plus (minus) loss (gain) on marketable securities, plus (minus) loss (gain) from equity investee, minus deferred gain
on sale of intellectual property, plus (minus) loss (gain) on dilution of ownership in equity investee, plus (minus) unrealized loss (gain)
on convertible notes receivable, plus (minus) loss (gain) on long-term investments and certain one-time non-operating expenses, as
determined by management. Management believes this measure provides useful information as it is a commonly used measure in the
capital markets and as it is a close proxy for repeatable cash generated by operations.
21Proposed Combination
Transaction With Aphria
22Key Terms of EXCHANGE RATIO/ CONSIDERATION
• 100% share consideration
Proposed • Shareholders of Aphria would be entitled to receive 1.5714 GGB common shares for each Aphria share held
Combination
• GGB to acquire the outstanding shares of Aphria at a per share value of CAD$11.00 based on a GGB per share value of
CAD $7.00
Transaction PREMIUM
• Offer price represents a premium of 45.5% over Aphria’s closing price of CAD$7.56 on the TSX on December 24, 2018 (the
With Aphria last trading day before the company announced its intention to make the offer), based on a GGB per share value of CAD
$7.00
• 46.0% premium to Aphria’s 10-day VWAP on the TSX as at December 24, 2018 close of CAD$7.5328
GGB FINANCING
• GGB will complete a concurrent brokered financing of CAD$300 million, at a price per share of CAD$7.00, to both
illustrate the confidence in the value of the consideration under the combination and to fund business growth of the
combined entity
• Certain existing GGB shareholders have committed to backstop the entire CAD$300 million financing
PRO FORMA OWNERSHIP
• ~60% Aphria; ~34% GGB; ~6% financing subscribers
SHAREHOLDER SUPPORT / LOCK-UPS
• GGB believes it already has support for the proposed transaction of Aphria shareholders holding approximately 10% of the
outstanding shares
• GGB has also acquired a meaningful position in Aphria
23Creates an Unparalleled North American Player with Canadian and U.S. Operations
• Aphria has a large market position in Canada and supply agreements with all provinces and the Yukon
Territory, as well as strong strategic partnerships establishing wholesale supply agreements
• GGB operates vertically integrated cannabis operations including cultivation, manufacturing and retail assets
GGB + •
in Nevada, in addition to recently being awarded seven incremental retail cannabis dispensary licenses
Together, the pro forma company will have a strong foundation, extensive retail relationships and
Aphria: infrastructure to capture significant future growth as international markets evolve
Strategic Increases Scale and Footprint, While Creating the Preeminent U.S. Consolidator
• The combined company will be the largest U.S. operator by market capitalization, the largest North American
Rationale cannabis operator, and the only North American operator at significant scale
• Benefits of scale are evident in both Canada and the U.S. when examining comparable company trading metrics
• Given the pro forma company’s increased size, both Aphria and GGB shareholders are expected to benefit from a
trading multiple expansion
Combines Aphria’s Cultivation and Production Capacity with GGB’s Retail Strength
• The combined company will marry Aphria’s low-cost cultivation and near-term production capacity with GGB’s
vast retail know-how to capture market share while maintaining lean margins
• Aphria’s current cash cost per gram is $1.30 and is expected to further decrease to C$0.95 per gram with projected
annual capacity of over 250,000 kg by early 2019
• GGB’s strong management team has a proven track record of delivering at the retail level and is already operating
a best-in-class dispensary in Las Vegas. GGB was also recently awarded seven incremental retail cannabis dispensary
licenses in Nevada
Poised to Benefit from Transformational Cannabis-Related Regulatory Changes in the World’s
Largest Cannabis Market
• GGB will soon be rolling out a consumer-focused line of CBD products, including topicals and balms, and is
working with six different large developers who represent a vast network of malls in the U.S., to launch over 450
mall kiosks in prime locations
• GGB is well-positioned to benefit from further pro-cannabis U.S. regulation
Unites Best-in-Class Management Teams: Aphria’s Pharmaceutical and Greenhouse Operational
Experience and GGB’s Proven Retail Expertise
• Aphria’s team is comprised of greenhouse industry veterans and proven operators of large pharma companies
• GGB’s CEO held senior positions at a number of well-known retailers, including Designer Shoe Warehouse Inc.
and L Brands (Victoria’s Secret)
24GGB +
Aphria:
North
American
Presence
1. Aphria owns 51% of Aphria Diamond, with all production from the facility to be sold to Aphria at an agreed upon transfer price
2. 300,000 sq. ft. operational
3. 26,000 sq. ft. operational and 18,000 sq. ft. expansion to be completed soon
Source: Public disclosure
25GGB + Aphria:
Pro Forma Market
Capitalization
1. Assumes $300 million financing is completed and pro forma company trades in-line with U.S. operators > $1 billion at 8.7x 2020E
EBITDA (or North American operators >$300 million at 9.6x 2020E EBITDA)
Source: Company Filings, Capital IQ, Public Disclosure, as at December 24, 2018
Note: Analyst consensus estimates, aside from GGB, which are management estimates
Note: Adjusted for subsequent events from most recent filings
Note: Adjusted average excludes outliers
26Illustrative
Pro Forma
Share Price
Implied
Implied
1. Assumes that financing subscribers will own ~6% pro forma the business combination
Note: Analyst consensus estimates, aside from GGB, which are management estimates
Note: Adjusted for subsequent events from most recent filings
Note: Adjusted average excludes outliers
Source: Company Filings, Capital IQ, Public Disclosure, as at December 24, 2018
27U.S. Public Cannabis Comparable Companies
U.S. Public U.S. Licensed Operators
TEV / Revenue TEV/EBITDA Revenue CAGR
Cannabis
(C$ millions, except per share amounts) Mkt. Cap TEV CY19E CY20E CY21E CY19E CY20E CY21E
Curaleaf $2,772 $2,367 5.7x 2.9x na 14.7x 5.9x na
MedMen $2,617 $2,642 5.4x 2.9x 1.8x 85.5x 10.7x 6.0x
Comparable
Acreage $2,227 $1,731 4.4x na na 17.7x na na
Cresco Labs $2,104 $1,852 4.5x 2.6x na 13.6x 6.6x na
GTI $1,902 $1,859 6.5x 2.9x na 21.4x 6.8x na
Companies
Harvest $1,692 $1,487 4.7x 1.9x 1.9x 18.8x 4.9x 4.7x
iAnthus $1,595 $1,575 5.1x 2.6x na neg 20.4x na
Charlotte's Web $1,301 $1,194 5.2x 3.0x 0.9x 14.9x 8.9x 3.1x
Trulieve $1,043 $1,022 3.2x 2.5x 2.2x 7.6x 5.6x 5.3x
GGB $911 $916 3.4x 1.1x 0.9x 27.2x 4.4x 3.4x
Origin House $348 $292 1.7x 1.0x 0.8x 11.7x 5.2x 3.9x
Liberty Health $289 $278 3.7x 1.7x 1.3x 18.3x 4.8x 3.5x
MJardin $206 $284 1.8x 0.9x na 4.7x 1.9x na
Planet 13 $165 $119 0.7x na na 2.2x na na
Sunniva $108 $94 0.4x 0.2x 0.2x 1.9x 0.7x 0.6x
1933 Industries $80 $79 2.2x na na 11.2x na na
Golden Leaf $66 $79 0.8x 0.6x na 2.5x 1.7x na
Straight Average 3.5x 1.9x 1.2x 17.1x 6.3x 3.8x
Adjusted Average 3.8x 2.0x 1.2x 12.6x 5.6x 4.0x
> $1B Adjusted Average 5.0x 2.7x 1.7x 24.3x 8.7x 4.8x
< $1B Adjusted Average 1.8x 0.9x 0.8x 10.0x 3.1x 2.8x
Note: Adjusted for subsequent events from most recent filings
Note: Adjusted average excludes outliers
Note: Analyst consensus estimates, aside from GGB, which are management estimates
Source: Company
excludes outliersFilings, Capital IQ, Public Disclosure, as at December 24, 2018
Note: Adjusted for subsequent events from most recent filings
Note: Adjusted average
Note: Analyst consensus estimates, aside from GGB, which are management estimates
Source: Company Filings, Capital IQ, Public Disclosure, as at December 24, 2018
To us there are no foreign markets.™ Page 1
28Canadian Public Cannabis Comparable Companies
Canadian
Canadian Licensed Producers TEV / Revenue TEV/EBITDA Revenue CAGR
(C$ millions, except per share amounts) Mkt. Cap TEV CY19E CY20E CY21E CY19E CY20E CY21E
Canopy Growth $12,773 $9,097 13.8x 7.6x 4.8x 78.4x 28.5x 15.9x
Public
Tilray $9,743 $9,710 53.2x 24.2x 14.4x nmf nmf 42.5x
Aurora $6,906 $6,817 11.0x 6.1x 4.4x 28.2x 16.4x na
Cronos Group $4,729 $2,316 19.3x 9.2x 5.2x 55.9x 24.6x 15.5x
Cannabis Aphria
Hexo
CannTrust
$1,909
$873
$713
$1,433
$701
$640
3.3x
4.6x
3.6x
1.7x
2.4x
2.2x
0.9x
1.6x
1.7x
11.4x
33.0x
12.3x
5.7x
9.7x
6.6x
3.2x
7.5x
4.9x
Comparable TGOD
OrganiGram
$636
$572
$365
$546
1.0x
3.4x
0.6x
2.1x
na
1.6x
7.9x
12.2x
2.6x
5.5x
2.2x
na
Companies
Supreme $378 $397 3.4x 2.1x na 10.0x 6.0x na
Flowr $351 $317 16.4x 2.3x na neg 6.9x na
Emerald Health $328 $277 na 2.2x na na na 3.8x
Wayland Group $287 $251 2.0x 1.9x na 16.2x 5.8x 7.2x
Village Farms $213 $230 1.0x 1.0x na 6.6x 4.6x na
VIVO $178 $168 5.1x 2.1x 0.4x 69.9x 3.1x 1.1x
Valens $133 $93 1.6x na na 3.6x na na
WeedMD $117 $81 1.2x 0.6x na 4.7x 1.9x 1.7x
Invictus MD $104 $90 1.3x 1.4x 1.2x 4.0x na na
Delta 9 Cannabis $84 $61 0.6x 0.3x 0.4x 2.6x 1.9x 2.1x
Harvest One $69 $20 0.3x na na 1.0x na na
Beleave $32 $36 0.8x 0.3x 0.2x neg 4.2x 1.2x
Indiva $28 $14 0.7x 0.2x na neg 0.7x na
Straight Average 7.0x 3.5x 3.1x 21.1x 7.9x 8.4x
Adjusted Average 4.0x 2.1x 2.0x 11.0x 4.6x 5.5x
Big 4 Adjusted Average 14.7x 7.6x 4.8x 67.2x 26.5x 15.7x
$250 - $2,000 Adjusted Average 3.0x 2.1x 1.6x 10.8x 6.1x 4.0x
Other Canadian Adjusted Average 1.0x 0.6x 0.3x 3.8x 2.7x 1.3x
N.A. > $300M Adjusted Average 8.3x 3.9x 3.1x 25.4x 9.6x 8.7x
Note: Adjusted for subsequent events from most recent filings
Note: Adjusted average excludes outliers
Note: Analyst consensus estimates, aside from GGB, which are management estimates
Note: Adjusted for subsequent events from most recent filings
Source: Company Filings, Capital IQ, Public Disclosure, as at December 24, 2018
Note: Adjusted average excludes outliers
To us there are no foreign markets.™ Page 2
Note: Analyst consensus estimates, aside from GGB, which are management estimates
Source: Company Filings, Capital IQ, Public Disclosure, as at December 24, 2018
29Present.
Connected.
Alive.
3031
32
FRONT
FRONT
NE201
NE201
IMPRINT AREA: 1.9” X 2.5”
COLORWAY: GRAPHITE
IMPRINT AREA: 2.5” X 1.1”
COLORWAY: WHITE
FRONT
PMS 172 FRONT
PMS 172
white
Black
NE9FIFTY
NEW ERA 201
ADJUSTABLE UNSTRUCTURED CAP NE201
NEW ERA 201
ADJUSTABLE UNSTRUCTURED CAP
IMPRINT AREA: 2.5” X 2.171”
COLORWAY: STONE
FRONT IMPRINT AREA: 2.5” X 5.5”
PMS 172 COLORWAY: DARK NAVY
FRONT
Black PMS 172
White
NE403
NE201
NEW ERA 201 NEW ERA 9FIFTY
FLAT BILL SNAPBACK
ADJUSTABLE UNSTRUCTURED CAP
IMPRINT AREA: 2.5” X 5.5”
COLORWAY: CAMO/BLACK
IMPRINT AREA: 1.9” X 2.5”
COLORWAY: GRAPHITE
PMS 172
PMS 172
white
NEW ERA 403
TRUCKER SNAPBACK
NEW ERA 201
ADJUSTABLE UNSTRUCTURED CAP
Size: 2.5”x1.5” Pantones
Size: 3”x3” Pantones
Camp Patches Size: 3”x3” Pantones
dieline: do not print
Camp Patches Size : 3”x3” Pantones
Camp Patches Size: 4.5”x4.5” Pantones
33
Camp Patches Size: 4.5”x4.5” Pantones
Size: 2.5”x1.5” Pantones
BELLA + CANVAS T-SHIRT COLOR SCREENPRINT COLORS
BELLA + CANVAS T-SHIRT COLOR SCREENPRINT
HeatheredCOLORS
Navy BlueBold.
Carefree.
Edgy.
3435
36
TRUST
             THE
Mystical.
             PATH
Curious.
Confident.   UNSEEN
                      37
38
39
™

              Women
              are the

                             ™
Wise.
Beautiful.   key to life,
Nourished.

                            40
™ 41
Relax
                                             C B D + W AT E R

                                              Green Lily
                                   .05 oz

                                                 1 oz

                                                                 ™
                   CBD

                FACE SERUM
C HAM OM IL E

                    SP EA RMI NT

                                                                42
Investment
Highlights.
Retail & CPG Talent
Capital Raise
Acquire Assets
Build Emotional Brands
Scale CBD CPG
Accelerated Growth
43Risk Factors.
There are a number of risk factors that could cause future results to differ materially from those described the applicable licensing requirements or regulatory framework enacted in the states in which any of the
herein. The risks and uncertainties described herein are not the only ones GGB (“the Company”) faces. Company’s operations occur.
Additional risks and uncertainties, including those that the Company does not know about now or that it
currently deems immaterial, may also adversely affect the Company’s business. If any of the following risks In February 2017, the Task Force on Crime Reduction and Public Safety was established through an
actually occur, the Company’s business may be harmed and its financial condition and results of operations executive order by the President of the United States. Names of those serving on the taskforce have
may suffer significantly. not been published, and the group was supposed to deliver its recommendations by July 27, 2017. The
recommendations of the group were not made public on that date, but the Attorney General issued a public
Cannabis is Illegal under U.S. Federal Law statement which said he had received recommendations “on a rolling basis” and he had already “been
acting on the taskforce’s recommendations to set the policy of the department.” Based on previous public
The Company is involved in the cannabis industry in the United States where local state law permits such statements made by the Attorney General, there had been some expectation that the taskforce may make
activities. However, the distribution, possession and consumption of cannabis remain illegal under U.S. some recommendations with respect to laws relating to cannabis. However, to date there has been no public
Federal Law. announcement in this regard from the Attorney General.
Investors are cautioned that unlike in Canada, in the United States, cannabis is largely regulated at the state The Company is subject to a variety of laws and regulations domestically and in the United States that involve
level. To the Company’s knowledge there are to date, 28 states of the United States plus the District of money laundering, financial record keeping and proceeds of crime, including the Currency and Foreign
Columbia that have laws and/or regulations that recognize, in one form or another, legitimate medical uses Transactions Reporting Act of 1970 (commonly known as the Bank Secrecy Act), as amended by Title III of
for cannabis. Many other states are considering similar legislation. Notwithstanding the permissive regulatory the Uniting and Strengthening America by Providing Appropriate Tools Required to Intercept and Obstruct
environment of medical cannabis at the state level, cannabis continues to be categorized as a controlled Terrorism Act of 2001 (USA PATRIOT Act), the Proceeds of Crime (Money Laundering) and Terrorist
substance under the Controlled Substances Act (the “CSA”) in the United States and as such, may be in Financing Act (Canada), as amended and the rules and regulations thereunder, the Criminal Code (Canada)
violation of federal law in the United States. and any related or similar rules, regulations or guidelines, issued, administered or enforced by governmental
authorities in the United States and Canada. In the event that any of the Company’s operations, or any
Violations of any federal laws and regulations could result in significant fines, penalties, administrative
proceeds thereof, any dividends or distributions therefrom, or any profits or revenues accruing from such
sanctions, convictions or settlements arising from civil proceedings conducted by either the federal
operations in the United States were found to be in violation of money laundering legislation or otherwise,
government or private citizens, or criminal charges, including, but not limited to, disgorgements of profits,
such transactions may be viewed as proceeds of crime under one or more of the statutes noted above or any
cessation of business activities or divestiture.
other applicable legislation. This could restrict or otherwise jeopardize the ability of the Company to declare
As a result of the conflicting views between state legislatures and the federal government regarding cannabis, or pay dividends, effect other distributions or subsequently repatriate such funds back to Canada.
investments in cannabis business in the United States are subject to inconsistent legislation and regulation.
Access to Banks and Financial Services
The response to this inconsistency was addressed in August 2013 when then Deputy Attorney General, James
Cole, authored the Cole Memorandum (the “Memorandum”). The Memorandum was addressed to all United The Company may have difficulty accessing the services of banks which may make it difficult for the
States district attorneys acknowledging that notwithstanding the designation of cannabis as a controlled Company to operate. Since the use of cannabis is illegal under US federal law, and in light of concerns in
substance at the federal level in the United States, several US states have enacted laws relating to cannabis the banking industry regarding money laundering and other federal financial crime related to cannabis, US
for medical purposes. banks have been reluctant to accept deposit funds from businesses involved with the cannabis industry.
Consequently, businesses involved in the cannabis industry often have difficulty finding a bank willing to
The Memorandum outlined certain priorities for the Department of Justice (the “DOJ”) relating to the
accept their business. Likewise, cannabis businesses have limited, if any, access to credit card processing
prosecution of cannabis offenses. In particular, the Memorandum noted that in jurisdictions that have
services. As a result, cannabis businesses in the US may be cash-only.
enacted laws legalizing cannabis in some form and that have also implemented strong and effective regulatory
and enforcement systems to control the cultivation, distribution, sale and possession of cannabis, conduct in This complicates the implementation of financial controls and increases security issues. The inability to open
compliance with those laws and regulations is less likely to be a priority at the federal level. Notably, however, or maintain bank accounts or take credit cards may make it difficult for the Company to operate.
the DOJ has never provided specific guidelines for what regulatory and enforcement systems it deems
sufficient under the Memorandum standard. The lack of banking and financial services presents unique and significant challenges to businesses in the
cannabis industry. The potential lack of a secure place in which pay creditors through the issuance of cheques
In light of limited investigative and prosecutorial resources, the Memorandum concluded that the DOJ should and the inability to secure traditional forms of operational financing, such as lines of credit, are some of the
be focused on addressing only the most significant threats related to cannabis. States where medical cannabis many challenges presented by the unavailability of traditional banking and financial services.
had been legalized were not characterized as a high priority. On January 4, 2018, US Attorney General
Jeff Sessions issued a memorandum to US district attorneys which rescinded the Memorandum. With the The Company
Memorandum rescinded, US federal prosecutors can exercise their discretion in determining whether
to prosecute cannabis-related violations of U.S. federal law throughout the United States. The potential The Company has recently been incorporated and has no history of earnings. The Company’s lack of
impact of the decision to rescind the Memorandum is unknown and may have a material adverse effect on operating history may make it difficult for investors to evaluate the Company’s prospects for success. There is
the Company’s business and results of operations. The Company is not aware of any non-compliance with no assurance that the Company will be successful and the likelihood of success must be considered in light of
its relatively early stage of operations.
44Risk Factors (cont’d).
The Company’s actual financial position and results of operations may differ materially from management’s Restriction of entry into the United States
current expectations and, as a result, the Company’s revenue, EBITDA and expenses may differ materially
from the revenue, EBITDA and expenses profits provided in this presentation. Such information is presented In the past, U.S. Customs and Border Protection (the “U.S. CBP”) was given the discretion to question
for illustrative purposes only. The process for estimating the Company’s revenue, EBITDA and expense Canadians entering the U.S. about their marijuana use and whether to use their response as a barrier to
requires the use of judgment in determining the appropriate assumptions and estimates. These estimates entry. Recently, the U.S. CBP has been focusing on the whole cannabis industry, including investors. Several
and assumptions may be revised as additional information becomes available and as additional analyses are highly publicized instances of U.S. CBP detaining and even banning Canadian investors from the United
performed. In addition, the assumptions used in preparing this presentation may not prove to be accurate, States have occurred in recent months. The restriction of travel to the United States of the Company’s
and other factors may affect the Company’s financial condition or results of operations. Any potential decline executives and investors would seriously impair the ability of the Company to conduct business and could
in the Company’s financial condition or results of operations may negatively impact the ability to pay amounts materially impact the Company’s results of operations.
on its issued and outstanding convertible debentures and the Company’s ability to complete a business
General regulatory risks; risks related to licensure
combination. Some of the financial information on which the information in this presentation is based has
been provided by third parties, which financial information management believes to be reliable but there can The Company’s business is subject to a variety of laws, regulations and guidelines relating to the manufacture,
be no assurances that such information is accurate. management, transportation, storage and disposal of marijuana, including laws and regulations relating
to health and safety, the conduct of operations and the protection of the environment. Achievement of
The development of the business of the Company and its ability to execute on the acquisition opportunities
the Company’s business objectives is contingent, in part, upon compliance with applicable regulatory
described herein will depend, in part, upon the amount of additional financing available. Failure to obtain
requirements and obtaining all requisite regulatory approvals. Changes to such laws, regulations and
sufficient financing may result in delaying, scaling back, eliminating or indefinitely postponing the acquisitions
guidelines due to matters beyond the control of the Company may cause material adverse effects to the
and the business of the Company’s current or future operations. There can be no assurance that additional
Company.
capital or other types of financing will be available if needed or that, if available, the terms of such financing
will be acceptable. The Company is required to obtain or renew further government permits and licenses for its current and
contemplated operations. Obtaining, amending or renewing the necessary governmental permits and
Part of the Company’s business strategy includes acquiring and integrating complementary businesses,
licenses can be a time-consuming process potentially involving numerous regulatory agencies, involving
products, or other assets, and forming strategic alliances, joint ventures and other business combinations,
public hearings and costly undertakings on the Company’s part. The duration and success of the Company’s
to help drive future growth. Acquisitions or similar arrangements may be complex, time consuming and
efforts to obtain, amend and renew permits and licenses are contingent upon many variables not within its
expensive. In particular, there can be no assurance that any acquisition opportunities will be completed
control, including the interpretation of applicable requirements implemented by the relevant permitting or
or, if completed, will be completed within the proposed timeframe or on terms that are exactly the same
licensing authority. The Company may not be able to obtain, amend or renew permits or licenses that are
as or similar to those disclosed in this presentation. There can be no assurance that future acquisition
necessary to its operations. Any unexpected delays or costs associated with the permitting and licensing
opportunities may arise and, if they do, that the Company will be able to consummate such acquisition
process could impede the ongoing or proposed operations of the Company. To the extent necessary permits
opportunities. The Company may not be able to consummate negotiations for acquisitions or other
or licenses are not obtained, amended or renewed, or are subsequently suspended or revoked, the Company
arrangements, which could result in significant diversion of management and other employee time, as well as
may be curtailed or prohibited from proceeding with its ongoing operations or planned development and
substantial out-of-pocket costs. In addition, there are a number of risks and uncertainties relating to closing
commercialization activities. Such curtailment or prohibition may result in a material adverse effect on the
transactions. If such transactions are not completed for any reasons, the Company will be subject to such
Company’s business, financial condition, results of operations or prospects.
risks and uncertainties.
Limited operating history
Additional Financing And Risk of Dilution
The Company has a limited financial reporting history. Consequently, the Company’s financial results for 2018
The Company will require equity and/or debt financing to support on-going operations, to undertake capital
are not comparable with prior years, and the financial information in this presentation may not be indicative
expenditures or to undertake acquisitions or other business combination transactions. There can terms which
of its future performance. The Company does not have a history of profitability, with the exception of the
are acceptable. The Company’s inability to raise financing of fund capital expenditures or acquisitions could
NOR business. As such the Company has limited prospects of generating profit from its intended operations.
limit its growth and may have a material adverse effect upon future profitability.
The Company is therefore subject to many of the risks common to early-stage enterprises, including under-
If additional funds are raised through further issuances of equity or convertible debt securities, existing capitalization, cash shortages, limitations with respect to personnel, financial, and other resources and lack of
shareholders could suffer significant dilution, and any new equity securities issued could have rights, revenues. There is no assurance that the Company will be successful in achieving a return on shareholders’
preferences and privileges superior to those of holders of common shares. Any debt financing secured in investment and the likelihood of success must be considered in light of the early stage of operations.
the future could involve restrictive covenants relating to capital raising activities and other financial and
If the Company is unable to successfully execute any material part of its growth strategy, its future growth and
operational matters, which may make it more difficult for the company to obtain additional capital and to
ability to make profitable investments in its business would be harmed
pursue business opportunities.
The Company’s success depends on its ability to expand its business while maintaining profitability. The
Global Economy
Company may not be able to sustain its growth or profitability on a quarterly or annual basis in future
Financial markets are influenced by the economic and market conditions in other countries, including periods. The Company may not be successful in executing its growth strategy, and even if the Company
the United States and other global markets. Although economic conditions in these countries may differ achieves targeted growth, it may not be able to sustain profitability. Failure to successfully execute any
significantly from economic conditions in Canada, investor reactions to developments in these other material part of the Company’s growth strategy would significantly impair the Company’s future growth and
countries may substantially affect the capital flows into and the market value of securities of issuers with its ability to make profitable investments in its business.
operations in the United States and Canada.
45You can also read