Job Search during a Pandemic Recession: Survey Evidence from the Netherlands - IZA DP No. 14180 MARCH 2021
←
→
Page content transcription
If your browser does not render page correctly, please read the page content below

DISCUSSION PAPER SERIES

IZA DP No. 14180

Job Search during a Pandemic Recession:
Survey Evidence from the Netherlands

Maria Balgova
Simon Trenkle
Christian Zimpelmann
Nico Pestel

MARCH 2021

DISCUSSION PAPER SERIES

IZA DP No. 14180

Job Search during a Pandemic Recession:
Survey Evidence from the Netherlands

Maria Balgova
IZA
Simon Trenkle
IZA
Christian Zimpelmann
IZA
Nico Pestel
IZA

MARCH 2021

Any opinions expressed in this paper are those of the author(s) and not those of IZA. Research published in this series may
include views on policy, but IZA takes no institutional policy positions. The IZA research network is committed to the IZA
Guiding Principles of Research Integrity.
The IZA Institute of Labor Economics is an independent economic research institute that conducts research in labor economics
and offers evidence-based policy advice on labor market issues. Supported by the Deutsche Post Foundation, IZA runs the
world’s largest network of economists, whose research aims to provide answers to the global labor market challenges of our
time. Our key objective is to build bridges between academic research, policymakers and society.
IZA Discussion Papers often represent preliminary work and are circulated to encourage discussion. Citation of such a paper
should account for its provisional character. A revised version may be available directly from the author.

                                                     ISSN: 2365-9793

                                           IZA – Institute of Labor Economics
Schaumburg-Lippe-Straße 5–9                      Phone: +49-228-3894-0
53113 Bonn, Germany                             Email: publications@iza.org                                    www.iza.org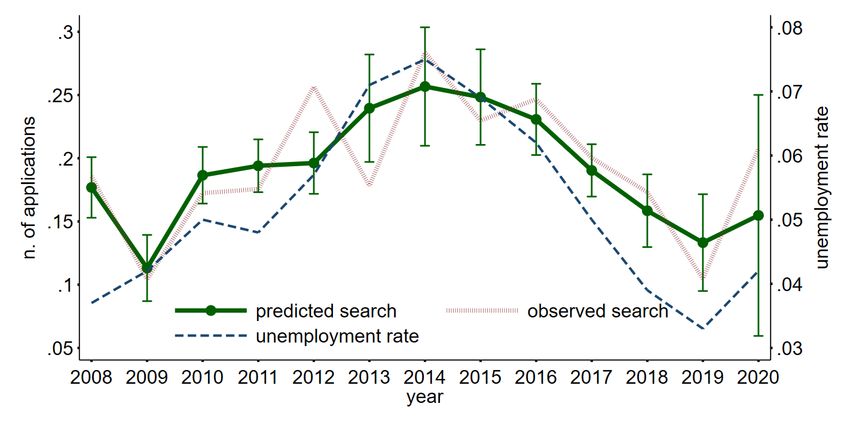
IZA DP No. 14180                                                                                                                  MARCH 2021

            ABSTRACT
            Job Search during a Pandemic Recession:
            Survey Evidence from the Netherlands*
            This paper studies job search behavior in the midst of a pandemic recession. We use long-
            running panel data from the Netherlands (LISS) and complement the core survey with
            our own COVID-specific module, conducted in June 2020, surveying job search effort of
            employed as well as unemployed respondents. We estimate an empirical model of job
            search over the business cycle over the period 2008-2019 to explore the gap between
            predicted and actual job search behavior in 2020. We find that job search during the
            pandemic recession differs strongly from previous downturns. The unemployed search
            significantly less than what we would normally observe during a recession of this size, while
            the employed search mildly more. Expectations about the duration of the pandemic seem
            to play a key role in explaining job search effort for the unemployed in 2020. Furthermore,
            employed subjects affected by changes in employment status due to COVID-19 are more
            likely to search for a job. Conversely, beliefs about infection risk do not seem to be related
            to job search in a systematic way.

            JEL Classification:              J21, J64, J68
            Keywords:                        COVID-19, job search, labor supply, survey

            Corresponding author:
            Maria Balgova
            IZA
            Schaumburg-Lippe-Straße 5-9
            53113 Bonn
            Germany
            E-mail: balgova@iza.org

            * The data collection was funded by the Deutsche Forschungsgemeinschaft (DFG, German Research Foundation)
            under Germany’s Excellence Strategy - EXC 2126/1 - 390838866, by the Dutch Research Council (NWO) under a
            Corona Fast track grant (440.20.043), and by the Institute of Labor Economics (IZA). For helpful comments we would
            like to thank Sebastian Braun, Ahmed Elsayed, Hans-Martin von Gaudecker, Annabelle Krause-Pilatus, Steffen Künn,
            Andrew Martinez, Patrick Moran, Michaela Paffenholz, Johannes Schmieder, Bettina Siflinger, and Marc Witte as
            well as seminar participants at IZA. We are grateful to Florens Pfann and Felipe Augusto Azuero Mutis for excellent
            research assistance, the help of many others at the CoViD-19 Impact Lab and to the team at CentERdata.
1    Introduction
Do individuals still look for jobs during a pandemic? On the face of it, doing so
seems futile. In virtually all countries, the COVID-19 pandemic triggered one of
the most severe economic downturns in modern history: lockdowns and govern-
ment restrictions sharply curtailed economic activity, consumers were held back
by fears of infection (Goolsbee and Syverson, 2021), and missing childcare and
health concerns weakened labor supply (Alon et al., 2020). Given the recession
and the degree of unprecedentedness which makes forming expectations partic-
ularly difficult, individuals may believe there is no point to search. However,
the pandemic also changed the structure of the economy and caused substantial
employment losses. As a result, individuals may search more: to take advan-
tage of the increased ability to work from home or to pivot into a less-affected
industry. Understanding job search during this time matters for several rea-
sons. It is crucial to form a complete picture of this extraordinary economic
event, but it is also necessary to gauging the path to a fast recovery, and it may
provide valuable insights for economic policy-making in case of potential future
pandemic-induced recessions.
    In this paper, we study job search behavior in a pandemic recession. Specif-
ically, we ask whether employed and unemployed workers search more or less
than during a normal recession. We then examine potential drivers: Are con-
cerns over health and safety an obstacle to job search? Do employment shocks
on an individual level increase job search effort? What is the role of beliefs about
the duration of economic restrictions? To answer these questions, we use data
from a long-running panel survey in the Netherlands (LISS), complemented by
a specific survey on job search behavior during the pandemic. We find that job
search during the pandemic recession differs strongly from previous downturns.
The unemployed search significantly less than what we would normally observe
during a recession of this size, while the employed search mildly more. This
seems to be driven predominantly by individuals’ expectations about the dura-
tion of the pandemic, rather than childcare availability, concerns over health, or
the desire to switch occupations.
    The Dutch labor market was strongly hit by the pandemic: the number
of vacancies decreased by 30% and the Dutch economy contracted by 8.5% in
Q2/2020. However, due to strong labor protection laws and extensive support
programs, the effects of the pandemic turned out to be milder than in some other
developed countries (such as the UK and the U.S., see von Gaudecker, Holler,
et al., 2020): households didn’t experience a significant shock to their income,
and the unemployment rate increased by only 1.5 percentage points. The initial
lockdown in spring 2020, while restrictive, was to some extent more lenient than
the measures imposed by other European countries. By summer 2020, when our
job search data was collected, social and economic life was largely back to what
it used to be. Nevertheless, the uncertainty about a possible second wave of the
pandemic persisted and it was unclear for how long the labor market would be

                                         2
affected.1
    Our data are based on a probability sample of the Dutch population and pro-
vide annual information on about 5,000 individuals from the year 2008 onward.
We complement the core LISS survey with a COVID-specific module (conducted
in June 2020) surveying the panel respondents about their job search effort, in-
cluding the number of applications sent over the past two months. Importantly,
we collect the data on both the employed and the unemployed. We also ask
about the respondents’ expectations about the economy and changes in their
preferences over work arrangements. Other modules from earlier months of 2020
allow us to merge in data on childcare provision, individual beliefs about the
health risks, and other information related to the pandemic.
    The analysis proceeds in two steps. We start by looking at the 2020 reces-
sion through the lens of traditional business cycle fluctuations. We estimate a
reduced-form model of job search over the most recent business cycle (2008–
2019), and use these results to predict job search behavior in 2020 given the
state of the economy and the composition of the employed and unemployed in
2020. In the second step, we recognize that 2020 is a pandemic recession: we
explore the gap between the predicted and actual job search behavior in 2020.
We regress the model prediction error on a broad set of variables capturing
the situation in 2020, including expectations about the labor market and the
pandemic, individual health risk, and changes in preferences over job character-
istics. This allows us to explore which of the many pandemic-related shocks are
driving job search behavior.
    Our main finding is that the usually strong counter-cyclical pattern of job
search effort in the Netherlands no longer holds during the pandemic. The un-
employed search significantly less than what we would normally observe during
a recession of this size. In fact, the unemployed search less (both along the ex-
tensive and intensive margin) in 2020 than they did on average in the five years
before the pandemic. The opposite holds for the employed: their job search
effort increases in line with a counter-cyclical relationship, and if anything they
search slightly more than we would expect given the state of the economy.
    Second, our analysis suggests that the main factors behind this divergence
stem from particularities of the economic downturn that was caused by the
pandemic: unemployed individuals from sectors most affected by economic re-
strictions search significantly less compared to normal times; employed subjects
facing pandemic-related work changes tend to search more. In addition, uncer-
tainty about the duration and severity of the economic downturn seems key to
explaining the observed divergence in job search. Consistent with an intertem-
poral substitution mechanism, we find that individuals who expect a short and
temporary impact of the coronavirus pandemic on the labor market search rel-
atively little compared to individuals that expect this impact to be long and
severe. On the other hand, health concerns, a pervasive feature of the pan-
demic, are not related to search effort despite individuals assert on average a
   1 We describe the institutional context and the development of the labor market during our

observation period in more detail in Appendix A.

                                             3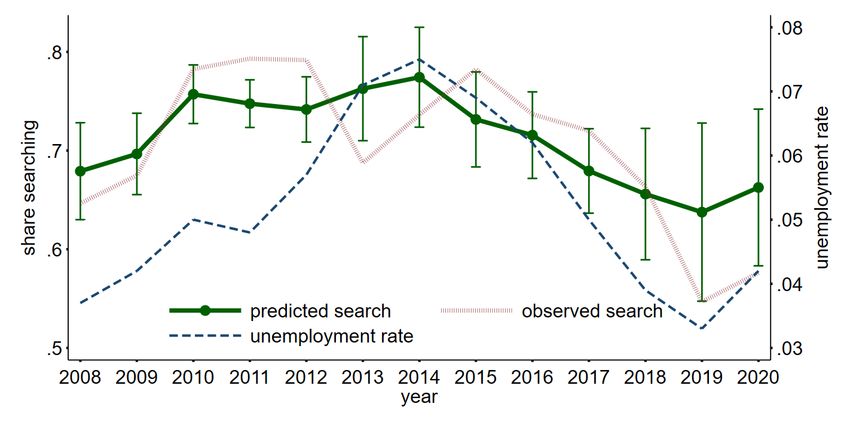
high probability of getting infected. Similarly, apart from a higher job search
for the female unemployed, we find little systematic differences in job search by
demographics during the pandemic over and above their pre-pandemic pattern.
    This paper contributes to the quickly expanding literature on the impact of
the COVID-19 pandemic on labor market outcomes of households (e.g. Adams-
Prassl et al., 2020; Crossley, Fisher, and Low, 2020; Meekes, Hassink, and
Kalb, 2020; von Gaudecker, Holler, et al., 2020). The existing studies focus
on changes in working hours, furlough schemes, and job separations; there has
been relatively less focus on job search and labor supply decisions in general.
    Most of the existing literature on job search during the pandemic (Bauer et
al., 2020; Marinescu, Skandalis, and Zhao, 2020; Hensvik, Le Barbanchon, and
Rathelot, 2021) focuses on data from online job platforms. They find that both
labor demand (vacancies) and labor supply as measured by job applications
dropped strongly. The advantage of our paper lies in making use of represen-
tative and rich panel survey data, which allows us to go beyond measurement
to analyze what drives the drop in search during the pandemic.2 Another ad-
vantage is the ability to distinguish between job search of the employed and
the unemployed. In line with Faberman et al. (2020) we find that search on
the job differs substantially from job search during unemployment. Given the
widespread use of labor hoarding policies, search on the job becomes particularly
important to understand aggregate job search activity.
    In this respect, we also contribute to the literature analyzing the determi-
nants of job search. We show that job finding expectations (Mueller, Spinnewijn,
and Topa, 2018) and the duration of unemployment (DellaVigna et al., 2020;
Lichter and Schiprowski, 2021) matter during the pandemic, but we also pro-
vide evidence of additional pandemic-specific factors which drive job seekers’
behavior.
    Our final contribution is to the macro-labor literature on job search over
the business cycle. The existing studies overwhelmingly make use of data on
the unemployed in the U.S., and their findings are mixed.3 We show that
in the Netherlands, patterns of job search effort are counter-cyclical for both
the employed and unemployed. During a pandemic recession, however, the
unemployed deviate from this pattern.

   2 Bauer et al. (2020) find evidence of a reallocation of the unemployed: job seekers in sectors

that were particularly hit hard by the crisis have shifted their search towards less hit sectors.
Coibion, Gorodnichenko, and Weber (2020) also makes use of survey data and document,
consistent with our findings, a lower share of search for the unemployed which they mainly
attribute to early retirement. Our work involves in contrast an examination of different factors
directly related to the pandemic.
   3 DeLoach and Kurt (2013) and Gomme and Lkhagvasuren (2015) find that job search is

pro-cyclical; Shimer (2004) and Mukoyama, Patterson, and Şahin (2018) find it to be counter-
cyclical, and Leyva (2018) find no relationship.

                                                4
2 Data and descriptives
To analyze job search during a pandemic recession, we make use of two data
sets. The first is a yearly longitudinal dataset on job search behavior going back
to 2008. The second is a dataset comprising several pandemic-related variables
that were collected in 2020. Both datasets are based on the Longitudinal In-
ternet Studies for the Social Sciences (LISS) panel which is administered by
CentERdata at Tilburg University. We describe each dataset in turn.
2.1 Longitudinal data of job search
The LISS panel is based on a probability sample of individuals registered by
Statistics Netherlands which ensures representativeness not only on observed
but also unobserved characteristics. The core questionnaire includes several
questions about job search. Panel members answer these recurring questions
every year in spring which allows us to build a time series going back until 2008
for roughly 5,000 individuals each year.
Our measure of job search is the self-reported number of applications sent
over the past two months preceding the LISS survey (always in April), setting it
to zero for those individuals who stated they were not searching. The number of
applications thus reflects both the extensive and the intensive margin of search.
An alternative measure, a binary indicator of whether an individual is seriously
searching for a job or not, is used for robustness checks.
Respondents are asked for their current labor market status. Importantly,
questions about job search are addressed to both employed (or self-employed)
and unemployed respondents. Since we expect different determinants of job
search for the unemployed, we analyze this group separately. The self-employed
are analyzed together with the employed by including a dummy variable for
self-employment.
The LISS panel contains a rich set of background characteristics for all re-
spondents including demographic information, household income, the urbanity
of the place of residence, civil status, and the sector the individual is working
in or has worked in before becoming unemployed. Throughout this paper, we
restrict the sample to respondents aged 18 to 65 years.
2.2 Pandemic-specific questionnaires
To understand how and why job search changed in 2020, we make use of an
additional job search module addressed to all panel members aged at least 16
years in June 2020 (the response rate was above 80%). The full list of survey
questions is documented in von Gaudecker, Zimpelmann, et al. (2021). Impor-
tantly, the questions on job search in the 2020 module are consistent with the
longitudinal questionnaire, allowing comparison over time.4
4 We note that there is a small change in the way labor market states are recorded in 2020
compared to earlier years. The resulting categorization of states before and after 2020 is
conceptually comparable and empirically very similar.
5Table 1 presents summary statistics of our sample in June 2020. It consists of
2,753 employed (or self-employed) individuals and 151 unemployed individuals.
While the number of unemployed is low in absolute terms, making it harder
to do inference for this group alone (an additional argument for including the
employed in the analysis), they can be considered as representative due to the
random sampling structure of the survey.
The demographics of the two groups differ in expected ways: the unemployed
are on average less educated than the employed, with only about 34% holding
a tertiary degree compared to 48% among the employed. They have a lower
household income, with only 25% in the highest employment tercile compared
with 46% for the employed. The unemployed are also less likely to be female,
married, have children living in their household, or live in an urban location.
One in ten individuals in the employed category is self-employed.
Turning to search outcomes, about 60% of the unemployed report seriously
searching for a job and the average unemployed has applied for almost five jobs
within the last two months. With about 0.2 applications, job search is consider-
ably lower among the employed; however, given the large number of employed in
the economy, their search makes up a significant part of the aggregate behavior.
Next, we consider three groups of variables that might drive job search be-
havior during a pandemic recession. Most of these variables were collected in
June, but a few were elicited in the COVID questionnaires in May. First, we
ask respondents for their perceived likelihood of getting infected with the virus
within the next two months and for the likelihood of becoming hospitalized if
infected. The employed report a slightly higher infection probability of 31%
compared with 23%, possibly reflecting the risk of becoming infected at the
workplace or while commuting. On average, both groups expect a one in four
chance hospitalization if infected.
Second, we collect a set of variables that reflect changes in employment.
We ask respondents if their work situation changed because of the pandemic: a
change in employment status, a change in contractual working hours, or a change
in earnings (for the self-employed). This is the case for 10% of the employed
and 17% of the unemployed. Additionally, 10% of employed individuals report
that they are affected by NOW, the Dutch short-time work policy.5
The third group of variables summarizes the expectations of respondents
with respect to the future development of the labor market. While about 40%
of both groups expect the economic restrictions to end in 2021, 26% expect the
restrictions to last until at least 2022. Further, 27% of the employed and 34%
of the unemployed expect an unemployment rate of at least 9% in 2021 or 2022.
We also ask subjects if they think the pandemic made it harder to find a job in
their line of work: 40% of the employed and 35% of the unemployed agree.
5 This rate is notably lower than what is reported in official statistics (24%) for two reasons:
First, 24% of respondents state they do not know whether they fall under this program which
is expected since there is no requirement to reduce working hours. Second, this question was
asked in an earlier wave such that this observation is missing for about 35% of the observations.
6Table 1: Summary table — main variables
(1) (2)
Employed Unemployed
Search outcomes
no. of applications last two months 0.21 4.78
[1.24] [6.59]
seriously searching for a (new) job 0.036 0.58
Demographics
age in years 44.1 44.2
[12.4] [16.5]
lower secondary education 0.15 0.23
upper secondary education 0.37 0.41
tertiary education 0.48 0.34
female 0.53 0.44
children 0.51 0.38
married 0.51 0.31
household income: middle 0.42 0.33
household income: high 0.46 0.25
urban location 0.43 0.38
self-employed 0.10 -
Health concerns
probability of infection 0.31 0.23
[0.23] [0.20]
probability of hospitalization if infected 0.24 0.25
[0.24] [0.28]
Work changes
work change due to corona 0.096 0.17
unemployment duration in years - 0.23
- [0.88]
applied for short-time work 0.10 -
Expectations
expect restrictions until 2021 0.41 0.39
expect restrictions until 2022 0.26 0.26
expect high future unemployment 0.27 0.34
finding same/old job harder 0.40 0.35
number of observations 2753 151
This table summarizes the variables of the job search module asked
in the LISS panel in June 2020 (or for some variables in earlier
waves) separately for the employed and the unemployed. All results
restrict to individuals aged between 16 and 65. SDs are in brackets
(omitted for binary variables).
73 Results
3.1 Job search over the business cycle
To understand the features of job search during a pandemic recession, we start
by establishing the characteristics of job search in the Netherlands during a nor-
mal recession. Our time series starts in 2008. At this point, the Dutch economy
was in a boom which was to be swiftly followed by a double-dip recession caused
first by the credit crunch and then by the European sovereign debt crisis. The
unemployment rate returned to its pre-recession state just before the pandemic
(more details in Section A.3 in the Appendix).
The average number of job applications, together with the aggregate un-
employment rate, are plotted in Figure 1. The figure shows that job search of
both the employed and the unemployed is counter-cyclical: individuals search
more when the unemployment rate is high. In the years of the tightest labor
market (2008 and 2019), the employed made on average 0.1 applications over
the past two months, while this number almost tripled in 2014 at the height
of unemployment. The unemployed, who search more overall, display the same
counter-cyclical behavior: they made on average about five applications in 2008
and 2019, but almost eleven in 2015.
This positive relationship between the unemployment rate and job search
may arise because of two different effects. It may be due to the changes in the
composition of the employed and unemployed, or due to an actual behavioral
response to the business cycle. To distinguish between them, and to explore
the drivers of job search behavior formally, we estimate the following empirical
model of job search:
Jit = α + β1L Xit + γ L Rt + it (1)
where Jit is the measure of job search of individual i in year t, and Xit cap-
tures individual characteristics (age, gender, education, marital status, a parent
dummy, normalized household income, a dummy for urban location, and the
length of unemployment spell for the unemployed), including sector dummies.
We allow for endogenous response to business cycle fluctuations by including
the aggregate unemployment rate Rt . The regression is fitted separately for
the employed (L = E) and unemployed (L = U ). This regression effectively
decomposes the variation in job search over time and across individuals into
changes in individual characteristics, and the changes in search behavior over
the business cycle. It is estimated by pooled OLS.6
The results of the model are summarized in Table B.1 in the Appendix.
The coefficients on the unemployment rate are positive, confirming the counter-
cyclical pattern of job search seen in Figure 1. A one percentage point increase
in the unemployment rate leads to 0.8 additional job applications by the un-
employed, and 0.03 more applications by the employed, suggesting a strong
behavioral response. Individual characteristics matter too, especially for on-the-
job-search: the lower educated, married individuals, and individuals in higher-
6 We keep missing values for all variables as separate categories to maximize sample size.
8Figure 1: Unemployment rate and observed and predicted job search (number
of applications) over the business cycle
(a) Employed
(b) Unemployed
Notes: This figure plots observed and predicted job search as well as the unemployment rate
over the business cycle. The dashed line represents aggregate unemployment rate at the time
of the LISS survey (April for 2008-2019, June for 2020). The thick fuzzy line plots the observed
average number of job applications sent over the 2 months prior to the survey. The solid line
with dots represents the number of job applications as predicted by our pooled OLS model of
job search as a function of individual characteristics and the unemployed rate (Table B.1 in
the Appendix). The value for 2020 is an out-of-sample prediction based on this model.
9income households search less. Because the characteristics of the employed and
unemployed are different in a recession compared to a boom (see Table B.2 in
the Appendix), the impact of demographics further contributes to the increase
in job search when the unemployment rate is high.
3.2 Job search during a pandemic recession
The business cycle patterns described in the previous section suggest that job
search should increase in a pandemic recession. Figure 1 shows that the search
of the employed follows the expected pattern: the number of applications in
2020 almost doubled compared to the previous year, rising from 0.1 to little
over 0.2. The unemployed, on the other hand, searched less: in the midst of
the pandemic recession, the unemployed sent on average the same number of
applications as during the height of the boom in 2008.
While our model predicts that job search should increase in response to a
higher unemployment rate (the behavioral channel), it may be the case that
the composition of the unemployed changed in a pandemic-specific way which
reduced their overall job search. To test this, we use the estimated model to
make an out-of-sample prediction for the number of applications in 2020. This
estimate (together with the in-sample predictions for the years 2008–2019) is
plotted in Figure 1. The plot shows that the model fits the cyclicality of job
search well in 2008–2019. For 2020, however, it predicts a sharp uptick in the
number of job applications sent by the unemployed. This means that neither the
behavioral response, nor the composition effect, can account for the large drop
in the observed search in 2020. In fact, this “missing search” of the unemployed
is even larger compared to the out-of-sample prediction than compared to the
pre-pandemic behavior. In contrast, the model predicts job applications by the
employed during the pandemic very well. If anything, the employed search even
more than predicted.
We interpret the gap between the predicted and actual search in 2020 as
the COVID-19 effect. To understand its size compared to the other drivers of
job search, we decompose the overall change in 2020 (relative to 2019) into the
composition, behavioral, and COVID-19 effects. They are plotted in Figure
2. Starting with the last bar, the graph confirms that in 2020, the employed
search more than in 2019, and the unemployed search less. The contribution
of the behavioral effect is positive (i.e. increases job search) for both groups.
The composition effect increases job search too. Table B.2 in the Appendix
shows that in terms of changing demographic characteristics of the employed
and unemployed, the pandemic recession looks similar to a strong recession: the
employed become older and better educated just like in a usual recession, but
the magnitude of this change is significantly larger, and the selection on marital
status and children in the household intensifies. The only difference between
the pandemic recession and a normal recession, in terms of the composition of
the employed and unemployed, is the importance of household income. While
in a normal recession the employed are drawn from relatively poorer households
(the income of the household of the unemployed doesn’t change significantly),
10the opposite was true in 2020: household income was relatively higher for both
the employed and the unemployed. Because household income is a significant
and positive predictor of job search for the employed, this goes some way to
explain the large increase in the number of applications sent by the employed.
Figure 2 confirms that the pandemic impacts the employed and the un-
employed differently. For the employed, the small positive COVID-19 effect
reinforces the positive impacts of the behavioural and the composition effect on
the job search. For the unemployed, the COVID-19 effect is large and negative,
outweighing the relatively small positive behavioural and composition effects,
and driving the missing search of this group.
We run three robustness checks. We re-estimate the model using an alterna-
tive measure of job search (a binary indicator), adding GDP growth to capture
business cycle fluctuations not covered by the unemployment rate, and as a
fixed effects model exploiting the panel structure of the LISS. These specifica-
tions show that our results replicate for alternative definitions of search, hold
alongside more traditional measures of the business cycle, and are robust to
controlling for unobservable individual heterogeneity (all results can be found
in Appendix C).
11Figure 2: Decomposing job search in 2020 into behavioural, composition, and
COVID-19 effects
Notes: This figure plots the decomposition of the overall difference between the observed job
search in 2020 and the predicted job search in 2019. The composition effect is calculated as
the difference between the predicted job search in 2019 and the predicted job search in 2020,
tracing the changes in individual characteristics but holding the unemployment rate at its 2019
level. The behavioural effect is calculated by comparing the predicted 2020 job search with
the 2019 and 2020 unemployment rate (keeping worker characteristics at their 2020 levels).
The COVID-19 effect is the difference between the model prediction for 2020 (based on 2020
worker characteristics and unemployment rate) and the observed number of job applications.
A negative value means that the effect lowers search activity. The values are normalized by
the average levels of search in 2019.
123.3 Explaining job search during a pandemic recession
In this section, we build upon the COVID-19 effect in job search, i.e. the 2020
prediction error J2020 − Jˆ2020 , and ask which variables are related to it. By better
understanding individual heterogeneity of job search during the pandemic, we
might be able to understand why the employed search slightly more and the
unemployed search significantly less relative to what would be expected based
on previous years.
We take variables that capture different aspects of the pandemic: Besides of
demographic characteristics and sector fixed effects (Xi ), both already used in
model (1) —and as main focus of this regression specification— we make use
of a broad range of variables (Pi ) that are specifically related to a pandemic
recession and were, hence, not included in model (1). Table 2 reports results
for different sets of these variables and with the number of applications as the
dependent variable.
J2020 − Jˆ2020 = α2020 + β12020 Xi + ηPi + νi (2)
To set the stage, we start with a version that includes only demographic
and sectoral variables. As we used the same set of variables from previous years
to create J2020 − Jˆ2020 , specification (1) captures a differential 2020 effect of
these variables. Column (1) of Table 2 reports the predictive power of these
regressions with the full list of coefficients displayed in Tables B.3 and B.4
in the Appendix. We find that for the unemployed job search is significantly
lower for individuals that worked during their previous job in the two sectors
arguably most affected by pandemic-related restrictions: catering and culture
and recreation. Other sectors and the employed do not exhibit any noticeable
patterns, strengthening the idea that the drop in search is indeed related to
economic restrictions. The results for demographic variables are on the other
hand less conclusive. Especially for the employed, none of the demographic
variables is consistently related to the prediction error of job search in 2020
(Table B.3). If anything, individuals with children in their household search
more than we would expect. For the unemployed, some of the corresponding
coefficients displayed in Table B.4 are statistically significant. Most notably,
we find a higher job search for females and young individuals relative to pre-
pandemic times.
We then turn to variables more directly related to the pandemic. We start
by including variables related to health concerns due to COVID-19 like the sub-
jective infection risk and the belief about the likelihood of getting hospitalized
conditional on an infection. Health concerns are likely to be important during
a pandemic, and we document in Table 1 the relatively large variation in beliefs
across groups. Thus, it seems plausible that the low search of the unemployed is
driven by a fear of getting infected. However, the coefficients for both the belief
of getting infected and the conditional risk of being hospitalized are insignificant
and close to zero for the employed as well as the unemployed, suggesting that
the role of health concerns in explaining search during a pandemic is limited
(see column (2) of Table 2).
13As a second set of variables, we examine the role of changes related to work.
This includes information on whether individuals are experiencing or expect-
ing changes in their work environment. In addition, it includes information on
whether individuals are on short-time work for the employed and the duration
in unemployment for the unemployed. It seems plausible that these variables
relate to the effort put into finding a new job and that for example, people in
short-time work exert a higher search intensity. Column (3) of Table 2 reports
the coefficients for these variables. For the employed, we see a significantly
higher search effort for individuals that report changed conditions in the work
environment due to the pandemic, while short-time work does not exhibit a
significant effect. For the unemployed, individuals in longer unemployment are
searching significantly less, consistent for example with dynamic selection or
discouragement. Overall, these work-related changes go some way toward ex-
plaining search behavior in 2020.
Third, we concentrate on the role of beliefs regarding the length and the
severity of the pandemic recession. In particular, we include dummies for
whether individuals expect lockdown measures to continue until 2021 and 2022
or longer, whether they expect the unemployment rate to increase in the fu-
ture and whether they think it has become harder to find a job during the
pandemic. The last variable is referring to the job they currently work in or
worked in before becoming unemployed. We can view these variables as captur-
ing two dimensions of the search process. First, from a static perspective, these
variables might capture aspects related to the returns to search, with ambigu-
ous predictions on search effort, as for example the diverging results on search
over the business cycle show. Second, these variables, especially the ones on
beliefs about the duration, capture a dynamic component and might cause an
intertemporal substitution of search effort. If individuals expect the economic
restrictions due to corona are short-lived and the economy will recover soon, in-
dividuals might reduce their (costly but ineffective) search now and delay it into
the near future where they expect search to be effective again. The prediction of
such an intertemporal substitution mechanism is that search should contract for
individuals that expect the pandemic to last short and increase if individuals’
belief the pandemic might go on for a longer period or the unemployment rate
to worsen in the future. Column (4) of Table 2 reports resulting coefficients
for these beliefs variables. Consistent with the described intertemporal substi-
tution mechanism, we find for the unemployed that search effort is lowest for
individuals that expect restrictions to end in 2021, with search increasing the
longer individuals expect the restrictions to be in place. In addition, individ-
uals that expect unemployment to be higher in the future show a significantly
higher search effort. This pattern is not present for the employed, for which the
rationale to search might be different in general.
Column (5) in Table 2 pools the different variable sets and shows coefficients
from one joint regression. We again see that beliefs about the direct health ef-
fects are not related to job search in a meaningful way, whereas beliefs about the
duration of economic restrictions and severity of the economic downturn as well
as in part changes in the work environment show a significant association with
14job search. To examine which variables matter and which don’t for predicting
search in a more disciplined way, we apply a lasso-selection approach to the
pooled specification. Results from these specifications are reported in column
(6). This specification picks — especially for the unemployed — again mainly
variables related to changed work environments and beliefs about duration re-
strictions. In addition, it also picks variables from the demographic specification
as highlighted in column (5) of Tables B.3 and B.4 in the Appendix. The cross-
validated mean prediction error for this specification is the lowest of all the
other specifications, confirming that these variables indeed perform well in out-
of-sample predictions. A similar picture emerges when using the binary search
indicator as dependent variable (Table C.1).
In sum, our results show little evidence that factors directly related to the
pandemic such as the risk of getting infected contribute to the decrease in search
relative to pre-pandemic times. In contrast, particularities of the economic
downturn caused by the pandemic — sector-specific economic restrictions, high
uncertainty about the speed of economic recovery, and work-related changes—
can potentially explain part of the missing search for the unemployed as well as
the diverging search pattern between the employed and the unemployed.
15Table 2: Explaining Job-Search 2020. Depvar: Number of Applications
Health Work
Demographics Concerns Changes Expectations Pooled LASSO
(1) (2) (3) (4) (5) (6)
Panel A: Employed
probability of infection 0.135 0.163 0.186+
[0.098] [0.102] [0.099]
probability of hospitalization if infected 0.117 0.087
[0.149] [0.149]
work change because of corona 0.261* 0.214+ 0.227+
[0.130] [0.122] [0.132]
affected by short-time work 0.108 0.085
[0.091] [0.103]
expect restrictions until 2021 -0.135* -0.144* -0.121**
[0.068] [0.069] [0.045]
expect restrictions until 2022 0.011 -0.010
[0.087] [0.086]
expect high future unemployment 0.007 0.017
[0.053] [0.050]
finding same job harder 0.045 0.009
[0.048] [0.047]
R2 0.023 0.002 0.005 0.004 0.035 0.027
Cross-Validated MPE 0.40 0.40 0.40 0.40 0.42 0.41
N 2753 2753 2753 2753 2753 2753
Mean no. appl. 2020 0.207 0.207 0.207 0.207 0.207 0.207
Panel B: Unemployed
probability of infection -3.659 -0.456
[3.482] [3.141]
probability of hospitalization if infected 2.763 0.096
[2.903] [2.868]
work change because of corona -0.045 1.905
[1.560] [1.689]
unemployment duration in years -1.068** -1.748** -1.342**
[0.339] [0.513] [0.318]
expect restrictions until 2021 2.012+ 2.397*
[1.051] [1.158]
expect restrictions until 2022 3.746* 3.915* 1.844
[1.640] [1.696] [1.436]
expect high future unemployment 3.520* 3.096* 2.957*
[1.491] [1.476] [1.450]
finding same job harder 0.622 1.285 1.893+
[1.400] [1.277] [1.047]
R2 0.273 0.013 0.017 0.096 0.392 0.296
Cross-Validated MPE 5.44 5.14 4.97 5.24 5.88 4.36
N 151 151 151 151 151 151
Mean no. appl. 2020 4.78 4.78 4.78 4.78 4.78 4.78
Notes: This table summarizes the regression-coefficients from regressing J˜i on different variables using OLS. The
regressions are performed separately for the employed (Panel A) and the unemployed (Panel B). The full list of
regression-coefficients is shown in Table B.3 and Table B.4. Robust SE are in brackets. +, * and ** indicate
significance at the .1, .05 and .01 significance level respectively. The cross-validated MPE reports the mean of
the mean prediction errors obtained after performing a five-fold cross-validation. Column (1) includes demographic
controls in 2020 (coefficients not shown), column (2) includes characteristics on health concerns namely the subjective
probability of getting infected with Covid-19 as well as the probability of being hospitalized conditional on getting
infected. Column (3) includes variables on work-related changes including a dummy for whether individuals receive
Short time Work due to corona for the employed and the unemployment duration for the unemployed. Column (4)
reports coefficients of variables capturing individuals’ expectation about the duration of economic restrictions due to
corona as well as whether they perceive job-found to be harder. Column (5) presents results from a pooled regression
and column (6) reports coefficients from a lasso-selection model applied to the pooled variable set that minimizes the
out-of-sample prediction.
164 Conclusion
This paper studies job search during the 2020 pandemic recession in the Nether-
lands using rich survey data about job search behavior. We focus on individuals’
self-reported job search as surveyed in June 2020 and compare the extent of job
search with the levels we would expect based on the demographic composition
of both the employed and unemployed and importantly with the business cycle
over the pre-pandemic period 2008–2019.
Our findings indicate that the relationship between aggregate unemployment
and job search is different in 2020 compared to pre-pandemic times. The un-
employed search significantly less than we would expect, while job search effort
of the employed increases, both relative to the pre-pandemic levels and to our
prediction. In a second step, we then investigate what drives this COVID-19
effect. Overall, we find little support for the hypothesis that factors directly
related to the pandemic such as the risk of getting infected contribute to the
decrease in search relative to pre-pandemic times. In contrast, particularities
of the economic downturn caused by the pandemic — sector-specific economic
restrictions, high uncertainty about the speed of economic recovery and work-
related changes — can potentially explain part of the missing search for the
unemployed as well as the diverging search pattern between the employed and
the unemployed.
Our findings have important policy implications. First, the atypically low
search effort of the unemployed during the COVID-19 recession bears the risk of
amplifying detachment from the labor market during the pandemic. With the
health crisis likely continuing well into 2021 such temporary detachments could
lead to long-run scars for the affected workers and dampen the speed of recov-
ery of the labor market. Policy-makers might design policies that counteract
such a detachment, for example by providing additional job search assistance,
retraining, or other preparatory measures to the currently unemployed in order
to facilitate a swift recovery of the labor market once the pandemic barriers are
lifted. Second, the slight increase in job search of the employed, particularly by
those who experienced pandemic-induced changes to their working conditions,
may call for supporting measures facilitating sectoral re-allocation of workers.
17References
Adams-Prassl, Abi, Teodora Boneva, Marta Golin, and Christopher Rauh (2020).
“Inequality in the Impact of the Coronavirus Shock: Evidence from Real
Time Surveys”. In: Journal of Public Economics 189, page 104245 (cited on
page 4).
Alon, Titan, Matthias Doepke, Jane Olmstead-Rumsey, and Michèle Tertilt
(2020). “This Time It’s Different: The Role of Women’s Employment in a
Pandemic Recession” (cited on page 2).
Bauer, Anja, Kristin Keveloh, Mariano Mamertino, and Enzo Weber (2020).
“Competing for Jobs: How COVID-19 Changes Search Behaviour in the
Labour Market” (cited on page 4).
Bick, Alexander and Adam Blandin (2020). “Real-Time Labor Market Esti-
mates During the 2020 Coronavirus Outbreak” (cited on page 21).
Coibion, Olivier, Yuriy Gorodnichenko, and Michael Weber (2020). “Labor Mar-
kets During the COVID-19 Crisis: A Preliminary View” (cited on page 4).
Crossley, Thomas F., Paul Fisher, and Hamish Low (2020). “The Heterogeneous
and Regressive Consequences of COVID-19: Evidence from High Quality
Panel Data”. In: Journal of Public Economics 193, page 104334 (cited on
page 4).
DellaVigna, Stefano, Jörg Heining, Johannes Schmieder, and Simon Trenkle
(2020). “Evidence on Job Search Models from a Survey of Unemployed Work-
ers in Germany” (cited on page 4).
DeLoach, Stephen B. and Mark Kurt (2013). “Discouraging Workers: Estimat-
ing the Impacts of Macroeconomic Shocks on the Search Intensity of the
Unemployed”. In: Journal of Labor Research 34.4, pages 433–454 (cited on
page 4).
Faberman, R. Jason, Andreas Mueller, Ayşegül Şahin, and Giorgio Topa (2020).
“Job Search Behavior among the Employed and Non-Employed” (cited on
page 4).
Giupponi, Giulia and Camille Landais (2020). “Subsidizing Labor Hoarding in
Recessions: The Employment & Welfare Effects of Short Time Work” (cited
on page 20).
Gomme, Paul and Damba Lkhagvasuren (2015). “Worker Search Effort as an
Amplification Mechanism”. In: Journal of Monetary Economics 75, pages 106–
122 (cited on page 4).
Goolsbee, Austan and Chad Syverson (2021). “Fear, Lockdown, and Diversion:
Comparing Drivers of Pandemic Economic Decline 2020”. In: Journal of
Public Economics 193, page 104311 (cited on page 2).
Hensvik, Lena, Thomas Le Barbanchon, and Roland Rathelot (2021). “Job
Search during the COVID-19 Crisis” (cited on page 4).
Leyva, Gustavo (2018). “Against All Odds: Job Search during the Great Reces-
sion” (cited on page 4).
Lichter, Andreas and Amelie Schiprowski (2021). “Benefit Duration, Job Search
Behavior and Re-Employment”. In: Journal of Public Economics 193, page 104326
(cited on page 4).
18Marinescu, Ioana Elena, Daphné Skandalis, and Daniel Zhao (2020). “Job Search,
Job Posting and Unemployment Insurance During the COVID-19 Crisis”
(cited on page 4).
Meekes, Jordy, Wolter Hassink, and Guyonne Kalb (2020). “Essential Work and
Emergency Childcare: Identifying Gender Differences in COVID-19 Effects
on Labour Demand and Supply” (cited on page 4).
Mueller, Andreas, Johannes Spinnewijn, and Giorgio Topa (2018). “Job Seek-
ers’ Perceptions and Employment Prospects: Heterogeneity, Duration De-
pendence and Bias” (cited on page 4).
Mukoyama, Toshihiko, Christina Patterson, and Ayşegül Şahin (2018). “Job
Search Behavior over the Business Cycle”. In: American Economic Journal:
Macroeconomics, page 70 (cited on page 4).
Shimer, Robert (2004). “Search Intensity” (cited on page 4).
von Gaudecker, Hans-Martin, Radost Holler, Lena Janys, Bettina M. Siflinger,
and Christian Zimpelmann (2020). “Labour Supply during Lockdown and a
”New Normal”: The Case of the Netherlands” (cited on pages 2, 4, 20, 21).
von Gaudecker, Hans-Martin, Christian Zimpelmann, Moritz Mendel, Bettina
Siflinger, Lena Janys, Jürgen Maurer, Egbert Jongen, Radost Holler, Re-
nata Abikeyeva, Felipe Augusto Azuero Mutis, Annica Gehlen, and Eva Lu-
cia Kleifgen (2021). “CoVID-19 Impact Lab Questionnaire Documentation”
(cited on page 5).
19Appendix A Institutional Context
This section gives an overview over the institutional context in the Netherlands
during June 2020. We first sketch social distancing policies and economic sup-
port programs taken by the government and then move on to key features of
the labor market during that period. A more detailed description for the full
year of 2020 is given by von Gaudecker, Holler, et al. (2020).
A.1 Social distancing policies
To stop the steep rise in infections during March 2020, the Dutch government
imposed several restrictions on economic and social life. Most of these policy
measures resembled those in other European countries. Schools, restaurants,
and several other businesses involving personal contacts were closed. People
were advised to stay at home and to avoid social contacts. However, restrictions
did not involve a general curfew and some measures were much more lenient.
Businesses, such as stores for clothes, utilities, or coffee shops remained open as
long as they could guarantee to maintain the social distancing rules.
From the end of April on, infection numbers started falling which allowed the
Dutch government to gradually lift economic restrictions. By June, schools were
opened again and businesses such as hairdressers, restaurants and cinemas could
operate under restricted capacity. With the main exceptions of bans on larger
(indoor) gatherings, the requirement to wear masks in public transport, and the
mandate to keep a distance of 1.5 meters to other people, social and economic
life was largely back to what it was before. Nevertheless, the uncertainty about
the possibility of a second wave persisted and it was unclear for how long the
labor market would be affected.
A.2 Economic support measures
In order to reduce the impact of the social distancing policies and of behavioral
reactions to the virus spread on the labor market, the Dutch government imple-
mented several measures. The most important one was the short-term allowance
(Noodmaatregel Overbrugging voor Werkgelegenheid, NOW). In order to prevent
job losses the Dutch government supported all businesses that expected a loss
in gross revenues of at least 20% by providing an advance for labor costs. The
amount of the advancement depended on the expected revenue loss and may be
up to 90% of the labor costs. In return, employers on the scheme committed to
pay full salaries and not to make any lay-offs. The advancement also covered
employees on fixed-term or temporary contracts; in contrast to short term work
arrangement in other countries, such as UK and Germany, the employees were
not required to reduce working hours and did not experience income deduc-
tions. This form of short-time work (see, e.g., Giupponi and Landais, 2020, for
a current perspective) has been used previously by the Dutch government.
The short-term allowance scheme was introduced in March and prolonged in
May for another four months. While the Dutch could reasonably expect their
20government to continue supporting affected businesses during the pandemic,
is was not clear how long the government is willing to sustain the program
under these conditions – especially since generous short-term work might impede
necessary structural change on the labor market.
A.3 The Dutch labor market
Figure A.1a shows quarterly time-series of number of employed individuals and
total hours worked, relative to quarter 4 of 2019. Both measures show a similar,
positive trend up to the end of 2019 followed by a sharp decline. Total hours
exhibit a slight drop already in the first quarter of 2020 and fall by 8% in the
second quarter. Despite the fall in productivity induced by the pandemic, the
support measures partly shielded the Dutch labor market from job separations:
the number of employed fell only by about 2% in the second quarter of 2020.
These employment patterns are also present in our panel data (von Gaudecker,
Holler, et al., 2020). Working hours on average fell by almost five hours per
week in April and stayed roughly at this level until September.
The labor market, however, was mostly affected at the intensive margin.
In Figure A.1b we present the trajectory of the unemployment rate and the
number of new vacancies over the same period. The unemployment rate rose by
1.3 percentage points and the number of new vacancies dropped by almost 30%.
This constitutes a relatively smaller downturn compared to other countries, such
the U.S. (Bick and Blandin, 2020), especially in unemployment rates.
21Figure A.1: Aggregate labor market statistics in the netherlands (2008–2020)
(a) Employment and hours worked
1 N employed
total hrs. worked
relative to Q4 2019
.95
.9
.85
2008q1 2010q1 2012q1 2014q1 2016q1 2018q1 2020q1
quarter
(b) Unemployment rate and new vaccancies
8 1
unemployment rate
new vacancies
vacancies relative to 2019
7
unemployment rate (%)
.8
6
.6
5
.4
4
3 .2
2008 2010 2012 2014 2016 2018 2020
year
Notes: This graph shows aggregate labor market statistics for the Netherlands. Figure (a)
shows quarterly aggregate labor market statistics since 2017, relative to Q4/2019 for hours
worked and number of employed. Figure (b) shows the trajectory of aggregate unemployment
—measured for the month in which the LISS survey was conducted (April for 2008-2019, June
for 2020)— and the number of new vacancies—measured in the second quarter and relative
to Q4 2019— between the years 2008–2020. Source: Statistics Netherlands.
22Appendix B Additional Figures and Tables
23Table B.1: Model of job search behavior as a function of individual character-
istics and business cycle fluctuations
definitely seeking number of applications
employed unemployed employed unemployed
age in years 0.991 1.137** -0.014 0.131
[0.015] [0.049] [0.011] [0.105]
Age sq. 1.000 0.999** 0.000 -0.002
[0.000] [0.001] [0.000] [0.001]
upper secondary education 1.364** 1.349* 0.075* 2.495*
[0.079] [0.196] [0.030] [0.974]
tertiary education 1.734** 1.245+ 0.074* 1.505
[0.168] [0.156] [0.026] [1.102]
self employed 1.795** 1.000 0.093+ 0.000
[0.144] [.] [0.050] [.]
unemployment duration in years 1.000 1.043 0.000 0.453+
[.] [0.037] [.] [0.219]
female 1.147 0.765* -0.009 -2.001*
[0.106] [0.087] [0.011] [0.681]
children 0.881** 0.927 -0.035 -0.604
[0.043] [0.144] [0.029] [0.844]
married 0.652** 0.814 -0.121** -0.279
[0.041] [0.143] [0.030] [0.798]
household income: middle 0.579** 0.844 -0.207** -0.824
[0.044] [0.134] [0.025] [0.481]
household income: high 0.453** 1.378 -0.281** 0.507
[0.050] [0.298] [0.026] [1.025]
urban location 0.722** 1.134 -0.086** 0.195
[0.056] [0.135] [0.019] [0.623]
linear trend 0.976 0.986 0.003 0.154
[0.017] [0.020] [0.003] [0.114]
unem. rate 1.075+ 1.144* 0.026** 0.796*
[0.040] [0.068] [0.008] [0.303]
Constant 0.071** 0.146* 0.640* 1.136
[0.032] [0.135] [0.237] [3.661]
Pseudo R2 /R2 0.042 0.058 0.006 0.063
N 37477 1431 37477 1431
Notes: The dependent variable in first two columns is the binary indicator of whether the individual is
searching for a job. The dependent variable in the last two columns is the number of job applications
sent over the preceding 2 months (set equal to 0 for those who state they are not searching). Controls
in all regressions also include sector. Years 2008-2019. Standard errors in brackets. +, * and **
indicate significance at the .1, .05 and .01 significance level respectively.
24Table B.2: Individual characteristics during a recession and during COVID-19, relative to normal times, by labour market status.
employed unemployed
normal high unempl. rate COVID-19 normal high unempl. rate COVID-19
age in years 43.014 0.741** 1.054** 44.250 -0.223 -0.058
[12.106] [0.127] [0.245] [13.940] [0.726] [1.302]
lower secondary education 0.222 -0.021** -0.076** 0.314 -0.044+ -0.082*
[0.416] [0.004] [0.008] [0.464] [0.024] [0.041]
upper secondary education 0.374 0.011* -0.005 0.365 0.037 0.046
[0.484] [0.005] [0.010] [0.482] [0.026] [0.044]
tertiary education 0.402 0.009+ 0.079** 0.318 0.003 0.019
[0.490] [0.005] [0.010] [0.466] [0.025] [0.042]
missing education 0.001 0.001* 0.002* 0.003 0.003 0.017*
[0.033] [0.000] [0.001] [0.055] [0.004] [0.007]
25
unemployment duration in years 0.000 0.000 0.000 1.543 -0.176+ -1.318**
[0.000] [0.000] [0.000] [1.996] [0.098] [0.166]
female 0.512 -0.001 0.017+ 0.526 -0.017 -0.083+
[0.500] [0.005] [0.010] [0.500] [0.027] [0.045]
children 0.541 -0.006 -0.034** 0.440 0.026 -0.056
[0.498] [0.005] [0.010] [0.497] [0.026] [0.045]
married 0.551 -0.008 -0.044** 0.416 -0.005 -0.105*
[0.497] [0.005] [0.010] [0.493] [0.026] [0.044]
monthly household income 1974.398 -104.242** 248.731** 1334.011 45.068 286.659**
[3267.100] [28.256] [64.022] [853.672] [47.102] [78.672]
urban location 0.369 -0.015** 0.060** 0.317 -0.045+ 0.067
[0.483] [0.005] [0.010] [0.466] [0.024] [0.042]
Observations 22263 37477 25016 663 1431 814
Notes: This table shows differences in normal times The “normal” column contains the mean characteristics for the employed and unemployed. The
“high unemployment rate” and “COVID-19” columns contain the difference between the normal mean and mean characteristics during recession
and the pandemic, respectively. Normal = years 2008-2011 and 2017-2019. High unemployment rate = years 2012-2016. COVID-19 = year 2020.
Standard errors in brackets. +, * and ** indicate significance at the .1, .05 and .01 significance level respectively.You can also read