Joel Rubensohn, CPA - Center for Management ...
←
→
Page content transcription
If your browser does not render page correctly, please read the page content below
46th Annual Taxation Conference
                         APPRAISAL for AD VALOREM
                                 TAXATION
                              of Communications, Energy and
                                 Transportation Properties

                                    July 24 – 28, 2016

                       The Internet of Things (IoT) and the
                        State of Communication Services
                                 Industry Address
Joe Molina, CPA
Principal, Ryan, LLC

Joel Rubensohn, CPA
Cox Communications
17th Report by the FCC on the status of
    competition in the market for the
     delivery of video programming
The most significant trends since the last report are “the
continuing development, and consumer usage, of time and location
shifted viewing of video programming, the expansion of digital and
high definition programming, and the progress of the online video
industry.”

                                                                 2
The State of Communications
     Services Industry Address

Financial Trends by Service

    Voice            Data     Video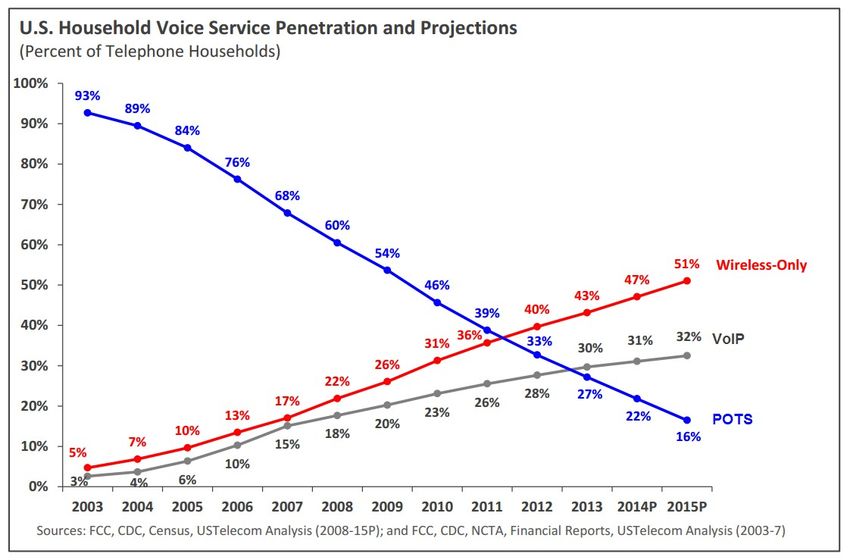
Communications Services Industry
                                                                                   Voice
Voice – Penetration by Technology

                [1] – CTIA.org, Wireless quick facts. Accessed on July 19, 2016.
Communications Services Industry
Voice – Telco Market Share Continues to Dwindle[1]                                                                                Voice
                    100%

                                                                                                             27%           25%
                                                                          31%              28%
                                                        33%
                    80%    39%
                                      36%
   Market Share %

                    60%                                                                                                           Other

                                                                                                                                  Telco
                                                                                           48%               50%           52%
                                                                          46%
                                      40%
                                                        43%                                                                       Wireless
                    40%    38%

                                                                                                                                  Cable

                    20%
                           22%        23%               23%               23%              23%               22%           22%

                     0%
                           2012       2013             2014             2015             2016             2017             2018

                                  [1] – SNL Kagan Estimated Market Share of US Residential Telephone Service, April 2014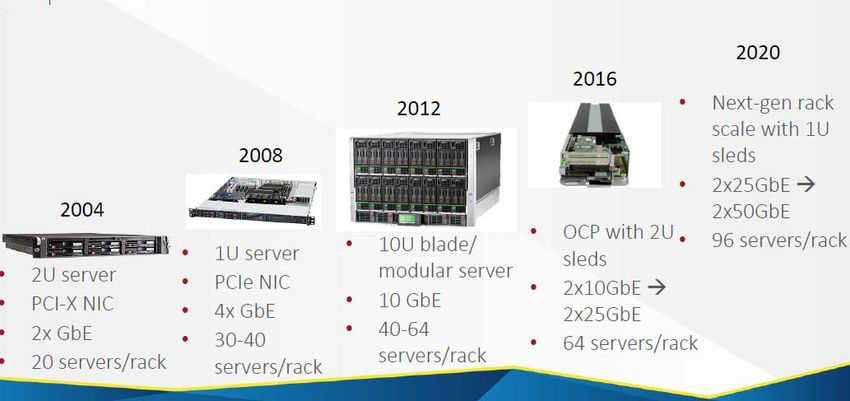
Communications Services Industry
Broadband – Cable and Telco Subscriptions Data


MSO Residential Revenue
By 2010, residential growth was slowing. In fact, MSO revenue growth from
2010–2015 slowed to just 3.2% CAGR, due to slowing subscriber growth for
Internet and voice services and the completion of the video digital tier
transition by most MSOs.

                                                                            8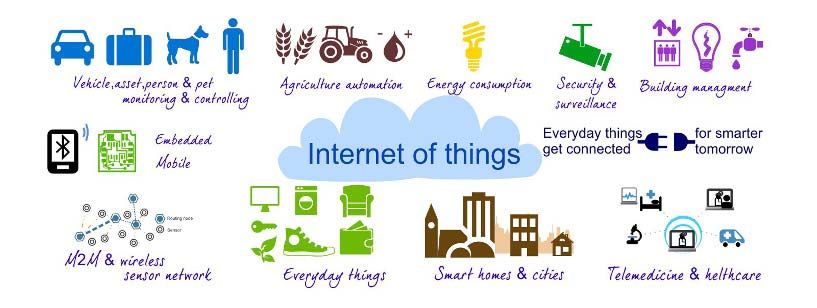
Incremental Revenue

•   Incremental revenue peaked at
    $6B in 2007;
•   Nothing exceeding $3.5B since
    2010
•   HSD clearly driving growth
•   Voice revenue is flat or negative
•   Video revenue has been
    $500M per year or less since
    2013.

                                        9
North American Pay‐TV Providers Shedding More Video Subs

 Industry       Year-end 2015                  Change         Change %   Market
                Subs                                                     Share

 Cable TV       53.2 million                   -599,000       -1.1%      53.5%

 Satellite TV   33.1 million                   -478,000       -0.5%      33.3%

 Telco TV       13.0 million                   +0.0 million   +0.0%      13.1%

 Total Pay-TV 99.4 million                     -1.1 million   -1.1%      100%

                           Source: SNL Kagan

                                                                             Sponsored by
NA Pay-TV Providers Shedding More Video Subs
Source: Leichtman Research Group Sponsored byMore Consumers Are Cutting or Shaving the Cord
• US pay-TV providers lost an estimated 145,000 video subscribers in the first
quarter, more than double the number of the year-ago period (MoffettNathanson)
• Collectively they lost 1.1 million video subscribers in 2015, more than four times as
many as in 2014 (SNL Kagan)
• Loss marked the third consecutive annual decline for the pay-TV industry (SNL
Kagan)OTT Take Rates Keep Climbing
Penetration of Services
Among All Households
Pay TV Broadband
Broadband and OTT Broadband and OTT, No Pay TV
90%
% of Homes
60%
30%
7.0% 1.5%
4.2% 3.8% 4.1%
0%
U.S. Canada U.K. Germany Spain
Source: Parks Associates 2014 Surveys in U.S., Canada, U.K., Germany, and Spain | © 2015 Parks AssociatesWhile Netflix Moves Towards Global Rule
80
Millions of subscribers
70
60
50
40
30
20
10
0
Q1 Q2 Q3 Q4 Q1 Q2 Q3 Q4 Q1 Q2 Q3 Q4 Q1 Q2 Q3 Q4
2012 2012 2012 2012 2013 2013 2013 2013 2014 2914 2014 2014 2015 2015 2015 2015
U.S. Streaming International Streaming Total StreamingSo Major Content Players Are Now Going OTT
Content Provider Launch Date
WWE Network Feb. 2014
Tennis Channel Plus May 2014
CBS All Access Oct. 2014
Nickelodeon - Noggin March 2015
Sony - PlayStation Vue March 2015
HBO Now April 2015
A&E Networks - Lifetime Movie Network June 2015
Showtime July 2015
AMC Networks - Shudder July 2015
Univision Now Nov. 2015
Turner Networks Coming Soon
Starz April 2016While Pay-TV Players Are Adding OTT Services
Pay-TV Provider OTT Services
Dish Network Netflix
Cablevision Systems Hulu, HBO Now
Atlantic Broadband Netflix, Hulu
RCN Netflix
Grande Netflix
WideOpenWest Netflix, Hulu
Suddenlink Netflix, Hulu
Mediacom Netflix, Hulu
Midcontinent Netflix, Hulu
Armstrong Hulu
Cogeco Cable Netflix
CableOne NetflixOr Starting Their Own OTT Brands
Pay-TV Provider Launch Date
Rogers & Shaw - Shomi Nov. 2014
Bell Media - Crave TV Dec. 2014
Dish - Sling TV Feb. 2015
Comcast - Stream TV July 2015
Verizon - Go90 Oct. 2015
Charter - Spectrum TV Nov. 2015
CenturyLink - Prism Stream March 2016
AT&T - DirecTV Now, Mobile & Preview Late 2016G
11.1M
WRU? lol
Telephone
Company
Cable Subs
22M
Households 1.6 Billion Active Facebook
with no cable Users
service
377.9M Wireless
34M Direct Connections
Broadcast
Satellite Subs
3B Pictures Tweeted,
SnapChat, Instagram or
49.1M traditional
What’s App
Cable TV Subs 124.6M US Households
18100 billion apps were
downloaded from Apple’s
app store from July 2008 to
June 2015.
19Technology Adoption
The American Society of Appraisers states, in part, that:

“The most economical new substitute property may have many
advantages over an old property:
  – such as longer life expectancy,
  –lower annual disbursements for operation and maintenance,
  –increased receipts from sale of new products and services.”

“The depreciation deduction of the hypothetical new substitute
property should be measured in money terms:
  – all of these are disadvantages of ownership of the existing old
   property.”

                                                                  21
Internet of Things (IoT) & Bandwidth Utilization A cable company’s perspective
WHAT IS THE INTERNET OF THINGS?
Network‐connected devices that communicate with each
other

   Vehicle, asset, person & pet        Agriculture     Energy           Energy         Building Management
   monitoring & controlling            automation      Consumption      Surveillance

                 Embedded
                 Mobile

   M2M & wireless                 Everyday things    Smart homes & cities      Telemedicine & healthcare
   sensor network
BACKGROUND
• Term first coined in 1999 by a UK businessman
• Approximately 6 billion connected devices currently in service
• Up 30% from 2015
• Estimate 20‐30 billion devices in service by 2020
• Average American currently has 8 devices connected to the Internet
• Estimated by 2020 average that the home will have ≈200 devicesHOW DO IOT DEVICES COMMUNICATE? Devices have a radio that sends and receives wireless communications. These devices: Operate on low power Work on a mesh network Use low bandwidth throughout the day
MESH NETWORK

In a mesh network every single node is connected to multiple other
nodes. Data jumps from one node to the other until it reaches the
server.
• New nodes can be added to the network without disturbing the
   existing architecture
• Nodes are generally located inside the customer’s premises
LOW BANDWIDTH

Despite the volume of connections (and market buzz) IoT applications aren’t
expected to have a significant impact on traffic in the near‐term.
• Devices consistently consume low capacity throughout day; and
• Currently account for less than 1% of global IP (Expected to represent less
   than 2.8% of global IP traffic by 2018)
WHAT DOES IOT MEAN TO CABLE INDUSTRY?
Pros:
• Increased internet dependency
• No incremental capital
   expenditures
• Expanded business offerings
   (Connected Home, Cars, Home
   Security, Medical Monitoring)
Cons:
1. Who owns technical issues?
    • No standardized IoT protocol
    • Produced by numerous
       manufacturers
2. Requires additional
   redundancies/backups to account
   for network outages
IF IOT DOESN’T IMPACT US WHAT DOES? Thirst for BANDWIDTH Demand is doubling every 18 months. Primary driver? Streaming Video ‐ Streaming video accounts for approximately 70% percent of peak period downstream traffic on North American fixed networks
Oversubscription & Concurrency
We manage bandwidth on the predication that not all users will be active at the same time during peak hours.
Growth Driven Investment Strategy
San Diego Intra Day Hourly to Peak Traffic Consumption versus Peak Utilization Growth Rates
Intraday Downstream Traffic in San Diego (2/28/2016 ‐
3/05/2016) Downstream Per Month Consumption (GB)
and Peak Utilization (Mbps) Peak Utilization
Growth ~49%
Custom
er
Perceiv
35.0
95th percentile ed QoE Busy‐hour Internet traffic is
Downstream Peak Utilization (Mbps)
Peak Utilization
zone
growing more rapidly that
30.0 average internet traffic: Busy‐
hour internet traffic increased
On Saturdays and Sundays we 51% in 2015, compared to
observe the consumption
going high from morning itself
25.0 29% growth in average traffic.
Busy‐hour traffic will increase
by a factor of 4.6 between
Consumption 20.0 2015 and 2020, and average
internet traffic will increase by
a factor of 2.0. – Cisco VNI
June 2016
15.0
10.0
Midnight Noon 7‐10 pm 5.0
0 2 4 6 8 10 12 14 16 18 20 22 0.0
Sunday Monday Tuesday 2014 2015 2016 2017 2018 2019 2020 2021
Wednesday Thursday Friday DS Utilization (Mbps)
Peak time performance influences customers Quality of Experience Consumption, which is not important for planning, will grow at a lower rate
Consumption is the average data in a day as compared to utilization is the than utilization
peak time data rate
Peak time utilization and consumption are growing at different rates. We plan our network to meet peak time demand to offer superior
customer experienceStrategies to Increase Bandwidth
Fiber Deeper
DOCSIS 3.1
Architecture
Implementation
Driving fiber deeper
Enable additional
architectures to enable
upstream capacity
delivery of higher
through spectrum
bandwidth services &
expansion
enable transition to future
(10 GHz downstream
access technologies
& 1 GHz upstream)
Fiber to the Home
Maximize Bandwidth by
pushing fiber all the way to
the homeFIBER DEEPER & FIBER TO THE HOME ARCHITECTURE
ODN
• Currently one node covers approx. 500 homes
• Results in more users sharing a common pipe
• Less bandwidth available/user
• Node Splits reduces homes passed to 256/Fiber Deep to 64
• Running Fiber all the way to homes reduces homes passed to 32IMPLEMENTATION PLAN
New Projects:
• Build all greenfield projects using
FTTH
In Competitive Markets:
• Start migrating to fiber deep
• Extend fiber, but continue to
leverage HFC network.
Transition to DOCSIS 3.1
All other Markets:
• Continue with node splits with a
focus on Fiber Deep end stateINFRASTRUCTURE IMPACT Switching to Fiber Deep: • Replace all network electronics (Amps & Taps) • Significant investment in Fiber & Nodes. • Anticipated cost >$5 billion over next 10 years FTTH Infrastructure Changes: • Additional Fiber Expenditures • Replacement of Nodes with OLT and ODN Equipment • Not as significant cost because only affects greenfield projects
BANDWIDTH MAXIMIZATION STRATEGIES
All Digital
• Removed analog channels from line‐up in
  2014‐2016
• This freed‐up approximately 35% of
  existing spectrum
Switched digital
• Only push programming to a customers
  home
  when program requested
• Migration occurred in 2016
• Allows bandwidth to be shared among
  channels with low viewership
What’s Next?
DOCSIS 3.1 IMPLEMENTATION

Background
• DOCSIS is The international standard used for transferring data over cable TV
  systems
• DOCSIS 3.1 is latest version of this standard
• Developed in 2015. Field trials in 4Q 2016. Anticipate deploying in 2017.

Why is 3.1 significant?
•   DOCSIS 3.0 allowed IP traffic to crossover channels. D3.1 deploys a new
    modulation method that allows for higher bandwidth availability and faster speeds
    (10G downstream & 1G upstream)
IMPLEMENTATION CONSIDERATIONS Changing to DOCSIS 3.1 Requires: • Replacing headend equipment that transmits data (i.e. CMTS Equipment) • Migration of customer modems to achieve higher speed • DOCSIS 3.1 is backward compatible. Customers can continue using existing modems but won’t get additional bandwidth benefits
1 Million seconds = 12 days

        1 Billion seconds = 32 years

1 Trillion Seconds = 32,000 years

                                         39
WebScale Giants
40Key Terms
Cloud computing:
the use of data center servers and software networks to
dynamically allocate resources and run applications for
remote end users
Virtualization:
This is key for cloud computing
Allows physical servers to run one or more virtual
machines on demand, cloud architectures offer rapid scaling
and efficient allocation of server resources on the fly
NV is part of the movement toward software-defined
networking (SDN) and network functions
virtualization (NFV). Source: SDXCENTRAL.COM
41Synergies Between SDN & NFV
42Future of the Network
• SDN/NFV are moving functions from network hardware to
software
• Software will now execute network functions as applications
while the hardware will become more homogeneous
• Use of open source software may reduce costs
• Potential savings from active sharing of network equipment with
second operator on the same network
• Adoption of homogeneous and simpler hardware (cheaper), “white
box”, (COTS) or “commoditized off the shelf hardware”
43…Future of the Network (continued)
• Reduction of entry threshold for Telco arena
• New, pure software, players adding to competition
• New innovation at the edge
• Open application program interfaces (APIs) and interoperability
can result in significant decreases in end-to-end cost
– For example, in PCs, hardware compatibility of the Intel-Microsoft
platform resulted in 25% cheaper systems compared to the “closed”
Apple platform in the 1980s
http://sites.ieee.org/sdn4fns/files/2013/11/SDN‐new.pdf 44Developing Data Center Architecture
45CapEx Savings for NFV
• Continued increase in processing and I/O capabilities of
commercial (x86) server and OS software.
• Improved capabilities and performance of NFV applications.
• Improved efficiency of capacity utilization in a virtual
environment – reduction in capacity growth, better capacity
planning.
• Ability to consolidate hardware boxes.
• Doyle Research estimates that NFV can provide CapEx savings in
the range of 20 to 35 percent of certain network elements.
• Leading system integrators estimate that operators can save 20 to
30 percent on OpEx via telecom transformation driven by NFV.
46Potential OpEx Savings
• Potential OpEx savings come from a number of areas depending
on the type of service transformed by NFV/SDN, including:
– Elimination of a significant percent of truck rolls
– More efficient network planning and design
– Ability to turn-up services and fix service problems more rapidly
– Savings from reduced power consumption and facilities costs
• The new revenue drivers include:
– Faster time to revenue
– Ability to enter new market opportunities (e.g., Internet of Things)
– Upselling existing customers (e.g., SD-WAN, vCPE, security)
47Service Provider Benefits
Ultimately, virtualization will deliver significantly improved operating margins for network
operators while also delivering the benefits of greater flexibility and richer set of services
to business and consumers.
48Cord-Cutting Makes the Financial Charts
Changes in Pay-TV Subscribership Attributable to
Household Formation and Pay-TV Penetration
9
Source: Census Bureau Housing Vacancies and Homeownership Survey, Company reports, MoffettNathanson estimates and SapnoanslyorseidsbyBig Blue and SDN-NFV
• AT&T notes it currently operates what it thinks is the largest
software-controlled optical network of its kind in the world.
• Software-defined network (SDN) technology is behind the AT&T
Network on Demand platform, which simplifies network operations,
offers security and scalability, and helps improve total cost of
ownership.
• AT&T has rolled out the third service on its Network on Demand
platform, which uses a single universal piece of equipment at a
customer’s premise to deliver virtualized functions and enables
businesses to flexibly manage their network services.
• The first capabilities offered on the carrier’s Network Functions on
Demand service come from Juniper Networks (virtual routing), Cisco
(virtual router), Fortinet (virtual security) and Riverbed (virtual WAN
optimization).
50Big Red and SDN-NFV
• With its open NFV architecture, Verizon is building a next-
generation, automated, software-defined network based on
open source solutions, including OpenStack, giving them the
ability to build a network that changes at the pace of
software, not at the pace of hardware.
• “We are thrilled to collaborate with Verizon on its SDN-NFV
architecture plan, which includes both Red Hat OpenStack
Platform and Red Hat Ceph Storage at the core of its open and
highly scalable next-generation infrastructure.” Darrell Jordan-
Smith, vice president, Worldwide Information and
Communications Technology, Red Hat.
51Technological and Service disruption begets Financial disruption
52Property Tax and Broadband
• During their last legislative session, Oregon state lawmakers
quickly put together laws that mitigated so-called "central
assessment," which taxes companies, including telecom
operators, based on the value of their brands.
• Comcast is being accused of using its pricey, 2 Gbps "Gigabit
Pro" service to try to exploit Oregon tax laws that were
originally put on the books to lure Google Fiber.
53The Telco Revolution
• The shift from Central Office or Head End to Telco Data Center
• Change from private enterprise networks to virtualized clouds
• Change from vendor specific equipment to open (white
box/”COTS”) generic platforms
• Shift from hardware to software (and hardware away from
software)
• Shift of services away from networks (aka OTT)
• “Cloudification, Virtualization & Webification”
• For example, FCC’s Wheeler's "Unlock the Box" plan aimed
to enable third-party devices to enter into the pay-TV
ecosystem. $21B Captive revenue, Industry counter “Ditch
the Box”
54How the 'Internet of Things' will impact
consumers, businesses, and
governments in 2016 and beyond
• Nearly $6 trillion will be spent on IoT solutions over the next
five years
• Businesses will be the top adopter of IoT solutions because
they will improve their bottom line by:
1) lowering operating costs;
2) increasing productivity; and
3) expanding to new markets or developing new product
offerings
55…Impact (continued)
• We believe Government will be the second-largest adopters of
IoT ecosystems, because they are focused on
1. increasing productivity,
2. decreasing costs,
3. and improving their citizens’ quality of life
• Consumers will lag behind BUT;
1. they will purchase a massive number of devices
2. invest a significant amount of money in IoT ecosystems.
56Show me the Money$!$
The Internet of Things (IoT) has been called the next Industrial
Revolution — it will change the way all businesses, governments, and
consumers interact with the physical world
57Quick Breakdown
DOCSIS
Progression Year Mbps Down Mbps Up
1.x 1997 38 9
2.0 2001 38 27
3.0 2006 152 108
3.1 2015 10,000 1,000
• 10,000Mps = 10Gbs; 1000Gbs = 1Terabyte… Petabyte
58Dramatic Changes in How Video is Being
Consumed
• SDN/NFV in conjunction with the Cloud can enable traditional Cable
TV Operators to compete in the new IP of OTT. The removal of all
analog to increase the spectrum band for additional services related
to IoT, home grown OTT. OTT Video Surpasses Broadcast by 2019.
• Switched digital and routing are two of the key functions most often
being “virtualized” now.
• Virtualization may slow the need to go Fiber Deep?
• Data Channels for High Speed Data can be optimized with
Cloudification. Yet Cloudification is still a few years away.
59The Big Video Explosion
• Video consumption has changed…. Forever. Any
content/place/time/real-time/device
• “Either we virtualize or vaporize” Anand Singh, Director of
Architecture, CenturyLink
• “Future architectures. Where is this going… Given the REIT
transformations of late…
• Heading to a world where Verizon, AT&T, T-Mo own Spectrum.
And everything else is leased, outsourced, rented,
whatever….” Iain Gillot with IGR at TFI 2015
For cable will that asset be a “dump pipe” or “a content app”?
60The Future of TV is Apps
61Questions?
62Definitions
• API: Application program interface (API) is a set of routines, protocols, and
tools for building software applications. An API specifies how software
components should interact and APIs are used when programming
graphical user interface (GUI) components.
• Cloud Computing:
– the use of data center servers and software networks to dynamically
allocate resources and run applications for remote end users
– Typically divided into three categories (private, public, and hybrid)
– cloud deployments have grown rapidly in recent years, promising cost
savings and greater flexibility over traditional private data centers
• Virtualization:
– is key for cloud computing
– By allowing physical servers to run one or more virtual machines on
demand, cloud architectures offer rapid scaling and efficient allocation of
server resources on the fly
SDXCENTRAL.COM 63• Private cloud:
Definitions
– refers to cloud infrastructure dedicated to a single company and
accessed by a private network connection, operating on servers
managed either internally or by a third-party provider.
– For many organizations in highly regulated industries, private clouds
remain the solution of choice.
– Cloud infrastructure platforms such as OpenStack offer a framework for
private cloud deployment and management, and a bevy of vendors have
begun releasing supported versions of the open source platform.
• Public cloud:
– refers to services such as Amazon Web Services, which sell server
resources (rather than dedicated physical servers) accessed over a
public network such as the Internet.
• Hybrid cloud:
– the combination of multiple clouds. For example, a company could use
public cloud services to handle temporary bursts of activity that exceed
private cloud capacity.
64Definitions
• Network virtualization (NV)
– abstracts networking connectivity and services that have traditionally
been delivered via hardware into a logical virtual network that is
decoupled from and runs independently on top of a physical network in
a hypervisor. Beyond L2-3 services like switching and routing, NV
typically incorporates virtualized L4-7 services including fireballing and
server load-balancing. NV solves a lot of the networking challenges in
today’s data centers, helping organizations centrally program and
provision the network, on-demand, without having to physically touch
the underlying infrastructure. With NV, organizations can simplify how
they roll out, scale and adjust workloads and resources to meet evolving
computing needs.
– Leading companies are rapidly adopting NV in an effort to take
advantage of the flexibility offered by software-defined computing and
storage resources within the data center. NV is part of the movement
toward software-defined networking (SDN) and network functions
virtualization (NFV). 65Definitions
• Software-defined networking (SDN):
– a way to manage networks that separates the control plane from the
forwarding plane. SDN is a complementary approach to network
functions virtualization (NFV) for network management. While they both
manage networks, both rely on different methods.
– SDN offers a centralized view of the network, giving an SDN Controller
the ability to act as the “brains” of the network. The SDN Controller
relays information to switches and routers via southbound APIs, and to
the applications with northbound APIs.
– One of the most well-known protocols used by SDN Controllers is
OpenFlow, however, it isn’t the only SDN standard, despite some using
“SDN” and “OpenFlow” interchangeably.
SDXCENTRAL.COM 66Definitions
• Centralized, programmable SDN environments can easily adjust to the
rapidly changing needs of businesses. SDN can lower costs and limit
wasteful provisioning, as well as provide flexibility and innovation for
networks.
• SDN introduces a layer of software between bare metal network
components and the network administrators who configure and set
them. This software layer gives network administrators an opportunity
to make their network device adjustments through a software interface
instead of having to manually configure hardware and actually
physically access network devices.
SDXCENTRAL.COM 67Definitions
• Virtualized networks, cloud computing and the data center will play a vital
role in making the Internet of Things a success. The vision for IoT is that
millions (and potentially billions) of devices will be connected to each other
and the Internet allowing people to communicate with machines, and
machines to communicate with other machines. But that vision is currently
hindered by a complicated ecosystem and fragmented platforms.
• The data from those devices is critical to existing data center infrastructure
because it will represent a massive increase in the amount of data and
connected nodes to the network.
• The cloud will play a key role in IoT because it can connect many of these
devices, some of which will have very low intelligence or functionality.
• Data analytics will be vital because all the data collected from these devices
will lead to the development of smarter applications for industrial and
consumer businesses.
68You can also read