Journal of Technology and Science Education
←
→
Page content transcription
If your browser does not render page correctly, please read the page content below
Journal of Technology and Science Education

   GRAPHICS TABLET TECHNOLOGY IN SECOND YEAR THERMAL ENGINEERING TEACHING

               Antonio Carrillo, José Manuel Cejudo, Fernando Domínguez, Eduardo Rodríguez
                  Grupo de Energética. Departamento de Máquinas y Motores Térmicos. Universidad de Málaga
                                                           Spain
                                                     acarrillo@uma.es

Received July 2013
Accepted October 2013

                                                        Abstract

Graphics tablet technology is well known in markets such as manufacturing, graphics arts and design but it has
not yet found widespread acceptance for university teaching. A graphics tablet is an afordable teaching tool
that combines the best features from traditional and new media. It allows developing a progressive, interactive
lecture (as a traditional blackboard does). However, the tablet is more versatile, being able to integrate graphic
material such as tables, graphs, colours, etc. In addition to that, lecture notes can be saved and posted on a
course website. This paper is aimed at engineering instructors considering graphics tablet technology for their
teaching set up. The objective is to provide useful information and guidance by sharing experiences made using
a graphics tablet for lecturing an undergraduate course on Thermal Engineering.

Keywords – graphics tablet, undergraduate, engineering, teaching tools

                                                         ----------

1 INTRODUCTION
A graphics tablet is a computer input device that enables a user to hand-draw images and graphics, similar to
the way a person draws images with a pencil and paper.
First precursors to the modern graphics tablets date back to the end of the 19 th century with the Teleautograph
patent by Gray (U.S. Patent No.386, 815, 1888). However, it was not until the middle of 20 th century that
devices similar to contemporary tablets emerged (Dimond, 1957; Davis & Ellis, 1964). A comprehensive
annotated bibliography can be found in Ward (n.d.). In the website of one of the main manufacturers (Wacom,
n.d.) there is a timeline with the development of these devices in the past decades. Nowadays tablets are
available in a wide range of diferent models.
Graphics tablets are used mainly in niche markets such as manufacturing, graphics arts and design but they
have not yet found widespread acceptance for university teaching, despite of their usefulness. Graphics tablet
technology combine the best features from traditional (e.g. blackboard) and modern (e.g. electronic slides)
teaching tools. On one side, as a blackboard, it provides fexible mechanisms to adapt the presentation in
response to student reactions allowing an interactive learning atmosphere. On the other side, it is possible to
include information-rich content such as complex tables, graphs and diagrams. Graphics tablets allow
instructors to mark up slides, annotate on images or write diagrams and formulas on-the-fy. They are all
excellent methods for visually communicating with students and improving their comprehension and retention.
In addition to that, class notes can be saved and published on a course website.
University teachers have used this technology in their lectures in engineering, mathematics, computing or
chemistry. See Olivier (2005), Loch (2005), Loch and Donovan (2006), Kohorst and Cox (2007), Galligan, Loch,
McDonald and Taylor (2010) and Cox (2011). In these references, diferent technological alternatives are used:

                          Journal of Technology and Science Education. Vol 3(3), 2013, pp 102
          On-line ISSN 2013-6374 – Print-ISSN 2014-5349 DL: B-2000-2012 – http://dx.doi.org/10.3926/jotse.85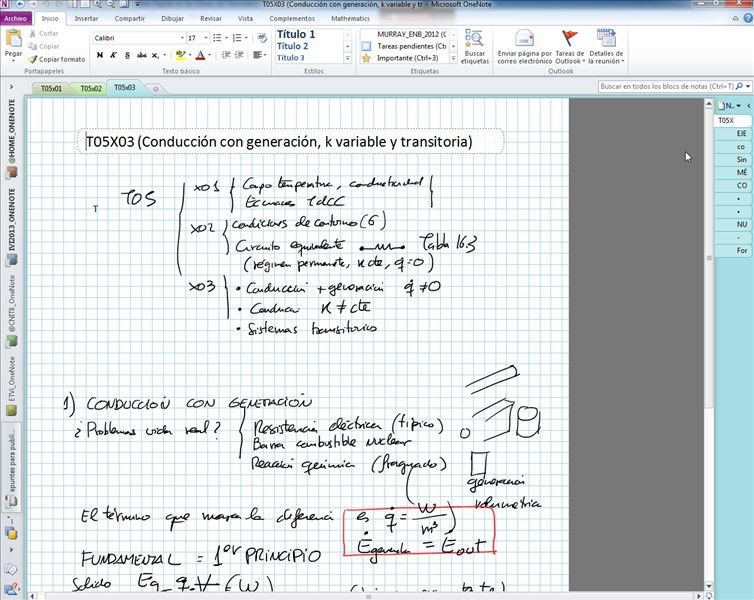
Journal of Technology and Science Education – http://dx.doi.org/10.3926/jotse.85

a) graphics tablet as an input device to a computer, b) tablet-PC or c) iPad or similar. Anyway, most of the
conclusions are shared by all tablet technologies. There are also diferent levels of interactivity. In the simplest
approach, the instructor uses the graphics tablet to support explanations in the same way as with a traditional
blackboard. This is the case of the present paper. There is also a more advanced approach, where students
have also tablets (iPad or tablet-PC) and may interact with the instructor during the class, answering questions,
submitng material, etc. Some interesting examples are the College of Engineering, Virginia Tech (n.d.) or the
e-Education centre, Monash University (n.d.).
This paper is aimed at engineering instructors considering graphics tablet technology for their teaching set up.
The objective is to provide useful information and guidance by sharing experiences made using a graphics
tablet for lecturing an undergraduate course on Thermal Engineering. Following, there is a description of the
subject’s context and tools used. Then, the results from a survey asking the students for feedback about the
tablet technology are discussed. Finally, some conclusions are presented.

2 CONTEXT AND TOOLS
2.1 Course specifications
The context of this experience is a Thermal Engineering (Applied Thermodynamics and Heat Transfer) course. This
is a second year bachelor's grade in Industrial Engineering Technology ofered by the Industrial Engineering School
(ETSII, n.d.) at the University of Malaga, Spain. About 230 students attend three hours of lectures a week and a 90
minutes problem solving class. Students are divided in four large groups to attend lectures, whereas groups for
problem solving classes are much smaller, under 30 students per class. The teaching is conducted by a number of
instructors. Due to the particular scheduling of the course, most of the students attended sessions with diferent
instructors. Some of these instructors used the graphics tablet and some others the traditional blackboard. Due to
this mixture of instructors and tools, it is not possible to establish a proper control group and, therefore, it is not
possible to quantitatively measure the infuence of the teaching tool on academic results. It is estimated that
roughly half of the students were exposed to the tablet, in both lectures and problem solving classes.
The subject is based on a number of well known text books. There is no other additional material than tables
and formulae summaries. During the lectures, the instructors highlight the relevant concepts (using the tablet
or the blackboard) and students take their own notes. On the other hand, problem solving classes are more
interactive, and frequently undergo a spontaneous development in response to students’ questions.

2.2 Instructor’s working posture, hardware and software
2.2.1 Instructor’s working posture

                                Figure 1. A typical arrangement to deliver a lecture

The instructor is typically seated, facing the classroom, see Figure 1. It is possible to hold the tablet in one hand
and write with the other, but in practice it is more convenient to be seated. Anyway the lecturer does not need
to remain in one spot for the whole time. It is natural to walk between the computer and the screen to further
explain concepts, or walk towards the students to ask them something. This helps to keep the lecture dynamic.

                                                   Vol. 3(3), 2013, pp 103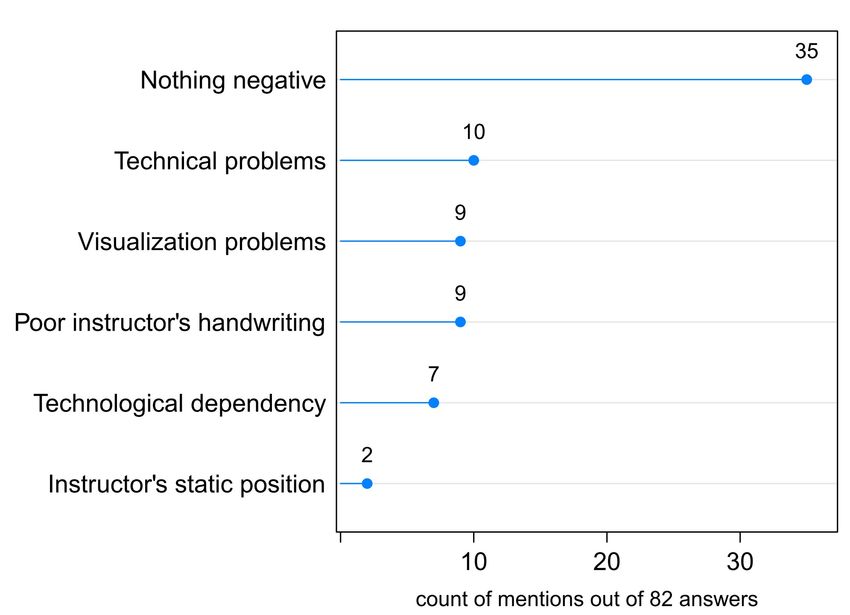
Journal of Technology and Science Education – http://dx.doi.org/10.3926/jotse.85

On the other hand, the frontal seated working position has some advantages. Firstly, it eases to follow
students’ reactions, because the instructor only has to lif his/her eyes from the laptop screen. Secondly, the
lecturer's voice is better projected to the classroom. Finally, it is possible to keep an eye on the instructor's own
notes, placed on the desktop.

2.2.2 Hardware
In the case of a USB graphics tablet, certain level of hand-eye coordination is required, as the user writes
blindly on the tablet, while looking at the screen. The instructor may need a short training period before feeling
comfortable. In the case of a tablet-PC or iPad this drawback disappears.
The hardware used was a Wacom (Wacom, n.d.) graphic tablet, connected through USB to a standard laptop
running Windows 7. The laptop drives the data projector of the classroom. A conventional mouse was also
employed as it was found helpful for some actions. No other equipment is required.
In this experience, two diferent tablets were used. The frst one was a Wacom Bamboo, a tablet aimed to
home users. The second one was a Wacom Intuos5, aimed to professional users. Both tablets ofer more than
enough features and performance for the normal use during a lecture that is typically handwriting and drawing
simple schematics. Nevertheless, it must be said that the professional tablet gives a better, more natural, feel
to the user.
The smallest Intuos5 model suits well the available space on the instructor's desk as it has an external size of
320 x 208 mm, similar to A4. The weight is 660 g, very portable. The drawback of this size is that the active
writing area is quite small, 157 x 98 mm, slightly larger than A6. This forces the user to minimize arm motion. In
practice, this is not a big problem because the handwriting size should be quite large to allow the students to
see clearly from far away in the classroom. Recently, the authors have tested the Intuos5 medium, slightly
larger and heavier (380 x 251 mm, almost 1kg) but with a larger active area (224 x 140 mm) that makes the
user feel more comfortable at handwriting. This is an excellent option if there is enough available space on the
instructor’s desk.

2.2.3 Sofware
Regarding sofware, two diferent applications were used: Windows Journal and MS OneNote2010. Windows
Journal is a very simple application included in Windows 7. Its handwriting performance is outstanding, but
typed text support is poor. It can annotate on images or PDF documents, but the last ones are previously
converted to images of an average-poor quality. Notes can be exported to PDF to be further published. The
strong point of this program is its ease of use, a feature very appreciated by the instructor when he/she is
under pressure, facing a classroom full of students.
On the other side, MS OneNote is bundled with Ofce 2010 suite and it has more features than Windows
Journal. OneNote is not only a note taking sofware but it is also an information organizer. The support for
typed text is very good, and the user can also create tables, insert pictures, audio and video. Information is
saved in pages organized into sections within notebooks. Hyperlinks can be used to link pieces of information.
This is very useful for keeping the subject’s material organized. As Journal, OneNote can annotate on PDF,
previously converted to images, in this case with acceptable quality. A very interesting feature is that users can
write anywhere on a virtually unbounded document. This way, the instructor never runs out of space when
he/she is writing a large expression. The main drawback of OneNote compared to Journal, is that it is more
difcult to use. Under the stress of a live class the instructor tends to make more mistakes using the sofware
that may even disrupt the fow of the lecture.

                                                   Vol. 3(3), 2013, pp 104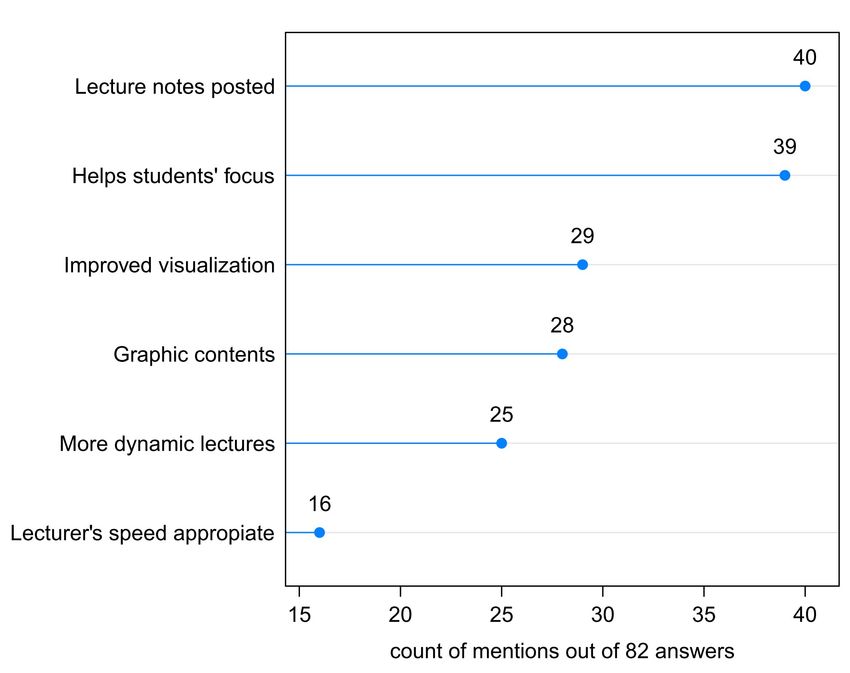
Journal of Technology and Science Education – http://dx.doi.org/10.3926/jotse.85
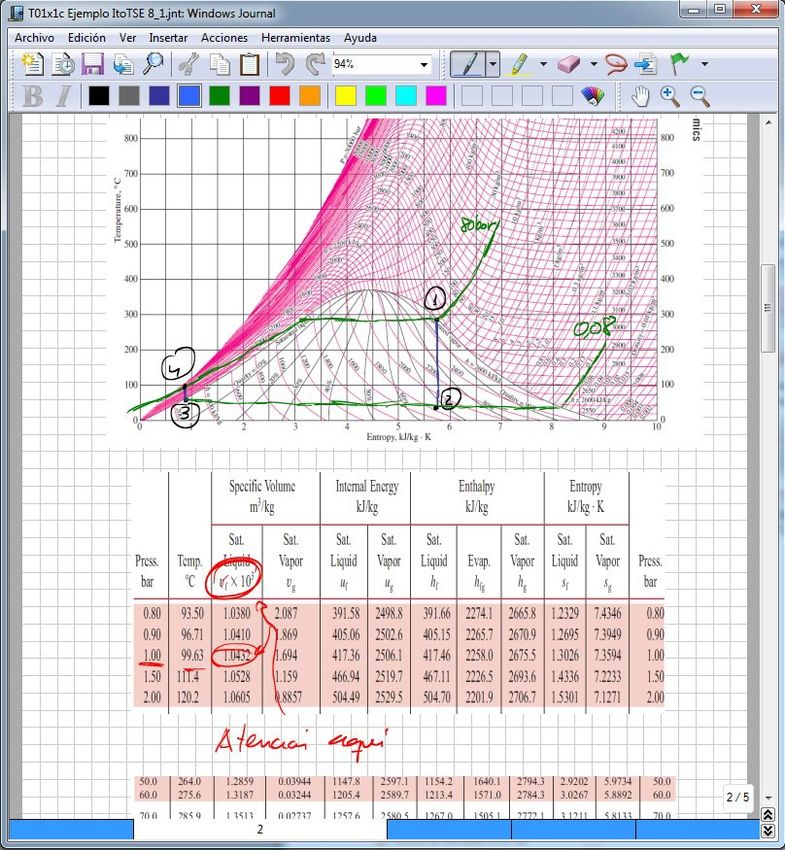
Figure 2. Windows Journal allows to seamlessly combine graphics, tables, and handwritten
notes using a simple toolbar
Figure 3. Microsoft OneNote screenshot. Note the tabs around the workspace
that allow users to organize documents
Vol. 3(3), 2013, pp 105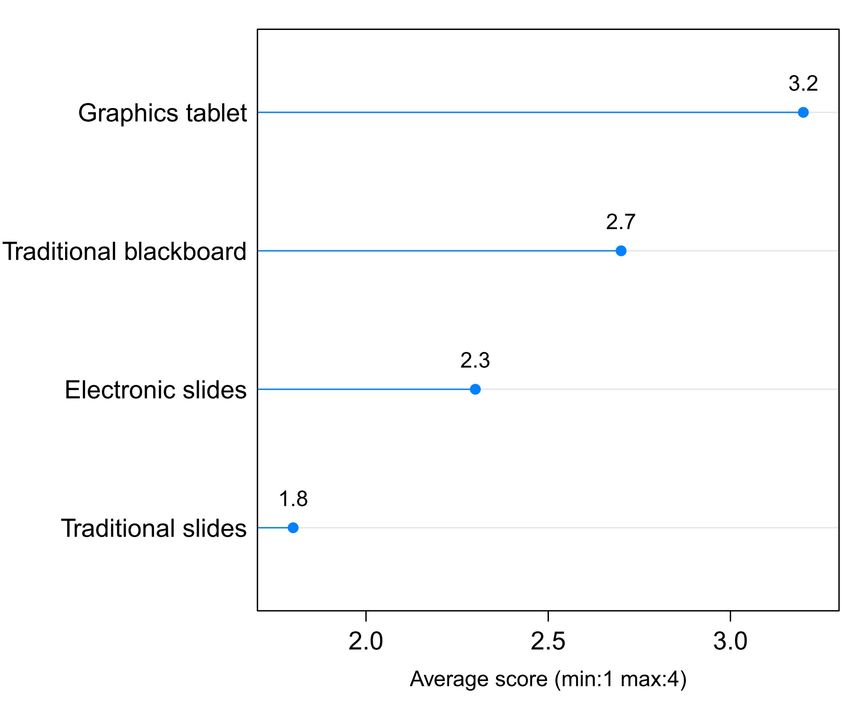
Journal of Technology and Science Education – http://dx.doi.org/10.3926/jotse.85

3 RESULTS OF A SURVEY: STUDENTS’ FEEDBACK
At the end of the lecturing period, a total of 82 students took part in a survey in which they were asked to
provide feedback on the use of the graphics tablet. The survey comprises fve questions; the results provide a
clear picture of the advantages and drawbacks of the tablet, and are discussed below.

3.1 Questions 1 and 2: General perception
The two frst questions of the survey meter the global perception of the students. The frst one is a multiple
choice question: What is your percepton about the use of the graphics tablet by your instructor, regarding to
the teaching and learning processes? The results are shown in Table 1.

                    Answer                                           Count                                Proportion
 Very positve                                                         47                                     57%
 Positve                                                              28                                     34%
 Neutral                                                               2                                      2%
 Negatve                                                               1                                      1%
 Very negatve                                                          2                                      2%
 No opinion                                                            2                                      2%
 Total                                                                82                                    100%
Table 1. Queston 1: What is your percepton about the use of the graphics tablet by your instructor, regarding
          to the teaching and learning processes? 91% of responses are “positve” or “very positve”

The second, multiple choices, question is: Would you like the graphics tablet to be used also in other subjects of
your grade? The results are shown in Table 2.

                    Answer                                           Count                                Proportion
 Definitely YES                                                       39                                     48%
 Yes                                                                  30                                     37%
 Neutral                                                               5                                      6%
 No                                                                    3                                      4%
 Definitely NO                                                         2                                      2%
 No opinion                                                            3                                      4%
 Total                                                                82                                    100%
 Table 2. Queston 2: Would you like the graphics tablet to be used also in other subjects of your grade? 85% of
                                  responses are “positve” or “very positve”

These results show that the global perception of the students about graphics tablet technology is very positive.
Nevertheless, the next two questions from the survey will provide more detailed feedback.

                                                  Vol. 3(3), 2013, pp 106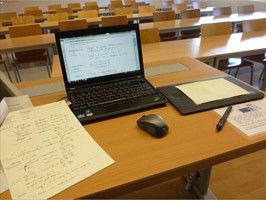
Journal of Technology and Science Education – http://dx.doi.org/10.3926/jotse.85

3.2 Question 3: Positive aspects of graphics tablet
This is a free text question. From a total of 82 answers, the positive key ideas have been categorized in six main
concepts, see Figure 4.

            Figure 4. Queston 3 positve aspects of graphics tablet categorized in six main concepts

3.2.1 Lecture notes posted on the Course website (40)
Half of the answers (40 out of 82) highlight the posting of the notes taken by the instructor during the lectures on
the course website as a very positive aspect. It may be thought that this would discourage students to take their
own notes. However, in the authors' experience, students take notes much in the same way as in lectures with
the traditional blackboard, but with a reduced level of stress. Following, some comments from the students:
"I can attend and understand better, because it is difcult to take notes of everything and to attend
simultaneously. Later, at home, I can complete my notes with the instructor's notes"
"As the notes on the course website are the same that were seen in the lecture it helps you to improve recall.
You can relax from the stress of writng everything in class and be more focused on the lecture itself"
It must be said that, in the authors' experience, if during a lecture, handwriting is abandoned to present pre-
built material, students stop taking notes systematically. When the instructor resumes handwriting, students
also resume note-taking. It seems that the progressive development of the lecture material by the instructor
encourages students to do the same. So, in this experience the authors developed the lecture (or the problem
solving class) from scratch, avoiding using pre-built material as much as possible.

3.2.2 Helps students' focus (39)
39 answers out of 82 refer that the graphics tablet helps to improve the students' focus on the lecture, for
example:
"(The graphics tablet)...helps to improve the focus in class, compared with other teaching tools"
This may be related in part with the relief from the stress of taking notes of everything, mentioned above. On
the other side, it also might be related with the following points.
More dynamic lectures (25)
Many students perceive more "dynamic" and "engaging" lectures:
"Active lectures, that help to understand the concepts of the subject"
"Versatility, speed, more engaging lectures ..."
"Everything is much more dynamic compared to electronic slides"

                                                  Vol. 3(3), 2013, pp 107
Journal of Technology and Science Education – http://dx.doi.org/10.3926/jotse.85
3.2.3 Lecturer's speed is more appropriate (16)
The writing speed of the instructor results in a natural regulation of the amount of information presented, so
the students feel that the lecturer's speed matches better their own comprehensive speed, for example:
"The instructor explains at the same pace as students'. This improves a lot the understanding of the lecture and
the quality of the students' own notes"
"We can think while taking notes, because the instructor's pace is appropriate"
3.2.4 Improved visualization (29) and graphic contents (28)
A good number of answers (29) highlight the improved visualization over the blackboard, and the possibility of
including graphic contents (28) such as property tables:
"Better visualizaton of schemes, for example, using colours that help to identfy the diferent elements in a heat
transfer process"
"Improved access and interaction with other documents, such as property tables or diagrams. Also clarity and
variety of colours… much better than electronic slides"
3.3 Question 4: negative aspects of graphics tablet
This is another free text question. Out of 82 answers, the negative key ideas have been categorized in six main
concepts, see Figure 5.
Figure 5. Queston 4 negatve aspects of graphics tablet categorized in six main concepts
3.3.1 Nothing negative (35)
A total of 35 out of 82 students (42%) fnd nothing negative in the use of the graphics tablet in class.
3.3.2 Visualization problems (9)
9 answers mention visualization problems, compared with the traditional blackboard:
"...looking at the projector screen is not as comfortable as looking at the blackboard…"
“The bad point is the classroom set-up, because sometmes daylight impinges on the projector screen"
A deeper analysis reveals that most of these nine students belong to a group that attend their lectures in a
particular classroom with large south oriented windows, a lot of day lighting, and a poor quality projector. The
logical solution would be to install new shading elements and a better projector.
Vol. 3(3), 2013, pp 108Journal of Technology and Science Education – http://dx.doi.org/10.3926/jotse.85
3.3.3 Poor instructor's handwriting (9)
"Sometmes, the instructor goes too fast, and his handwritng becomes very poor and difcult to understand.
Nothing serious, but this must be improved"
"Instructor's handwritng is sometmes difcult to decipher"
This point must be improved in the future. Poor handwriting is the result of a number of factors such as a) the
graphics tablet position is not appropriate, so the writing position is awkward, b) inadequate zoom level, so the
instructor is forced to very small movements on the tablet or c) simply the instructor goes too fast.
3.3.4 Static position of the instructor (2)
It seems that the instructor's seated working position does not pose any serious problem, considering that
there are only two complaints.
3.3.5 Technical problems, delays, disruptions of the fow of the lecture (10)
This usually refers to mistakes in the use of the sofware or delays in the start up of the lecture due to
hardware problems or connectivity problems. Examples:
"… small technical problems that delay the start up of the lectures …"
"… lecturer's competency with the tablet technology is required for fuid lecturing"
"Sometmes, due to the software, there are small class disruptons (change the colour, new page, new ttle,
erase, etc.)...”
Some delays can be prevented if the lecturer adopts some simple strategies, such as being in the classroom 5
minutes before the scheduled start time or having the laptop suspended rather than switched of for shorter
system starting times. However, there are other kinds of delays more difcult to prevent, such as the startup of
the audiovisual system of the classroom that may delay a few minutes depending on the particular system. This
time may be used to write a table of contents on the traditional blackboard while introducing the lecture to the
students.
Regarding the instructor’s competency using the tablet technology, only practice can improve this point. It may
be convenient to start with a simple application such as Windows Journal. Later, when the instructor feels
confdent, he/she can try more complex sofware such as OneNote. In this last case, it is important to
customize the quick access toolbar and to minimize the size of the ribbon and lateral windows so the writing
area is maximized.
3.3.6 Technological dependency (7)
This is an unavoidable drawback, shared with other teaching tools such as electronic slides.
“Dependency on the projector or electricity, compared to blackboard"
"If the projector does not work, the tablet is useless, although the same happens with PowerPoint slides"
Vol. 3(3), 2013, pp 109Journal of Technology and Science Education – http://dx.doi.org/10.3926/jotse.85
3.4 Question 5: teaching tools preference
Finally, in the last question, the students are asked to choose an integer score for the diferent teaching tools,
the minimum is 1, the maximum is 4. The graphics tablet is the most appreciated teaching tool, followed by the
traditional blackboard (interestingly, the most interactive teaching tools), see Figure 6.
Figure 6. Queston 5: teaching tools preference. Graphics tablet is the most appreciated tool,
followed by the traditonal blackboard
4 CONCLUSIONS
Results of the graphics tablet experience during this course are very satisfactory. The students' feedback
provides a qualitative, but clear, picture of the main positive and negative aspects. This is an afordable and
efcient teaching tool that combines the best features of traditional and new teaching media. It provides
mechanisms to develop a progressive, interactive lesson, as a traditional blackboard does. However, the
tablet is more versatile, allowing integrating graphic material: tables, graphs, colours, etc. The possibility of
posting the class notes on the course website is especially well received by the students. In addition to that,
no special infrastructure is required but a data projector, a facility present in most today's engineering
classrooms. On the other hand, there are a few negative points referred by the students in the survey that
must be addressed and minimized in coming courses. A quantitative study on the infuence of the tablet on
academic results would be very interesting, and should be conducted, whenever the academic organization
of the course allows. In a next future, the authors will continue using the graphic tablet and exploring new
possibilities of this technology.
Vol. 3(3), 2013, pp 110Journal of Technology and Science Education – http://dx.doi.org/10.3926/jotse.85
REFERENCES
Cox, J.R. (2011). Enhancing student interactions with the instructor and content using pen-based technology,
YouTube videos, and virtual conferencing. Biochemistry and Molecular Biology Educaton, 39(1), 4-9.
http://dx.doi.org/10.1002/bmb.20443
Davis, M.R., & Ellis, T.O. (1964). The RAND Tablet: A Man-Machine Graphical Communication Device
(Memorandum RM-4122-ARPA). RAND Corpora tion. Retrieved March 11, 2013, from:
http://www.rand.org/content/dam/rand/pubs/research_memoranda/2005/RM4122.pdf
Dimond, T.L. (1957). Devices for reading handwritten characters. In ACM (Eds.). Papers and discussions
presented at the Eastern Joint Computer Conference IRE-ACM-AIEE '57: Computers with deadlines to meet
held in Washington, D.C., 9-13 December 1957 (pp. 232-237). New York, NY, USA, ACM Association for
Computing Machinery. http://dx.doi.org/10.1145/1457720.1457765
ETSII (n.d.). Escuela Técnica Superior de Ingenieros Industriales. University of Malaga, Spain. Retrieved June 26,
2013, from: http://www.etsii.uma.es
Galligan, L., Loch, B., McDonald, C. & Taylor, J. A. (2010). The use of tablet and related technologies in
mathematics teaching. Australian Senior Mathematcs Journal, 24(1), 38-51.
Gray, E. (1888). U.S. Patent No. 386,815. Washington, DC: U.S. Patent and Trademark Ofce.
Kohorst, K., & Cox, J.R. (2007). Virtual ofce hours using a tablet PC: Elluminating biochemistry in an online
environment. Biochemistry and Molecular Biology Educa ton, 35(3), 193-197.
http://dx.doi.org/10.1002/bmb.50
Loch, B.I. (2005) Tablet technology in frst year calculus and linear algebra teaching. In Kingfsher Delta '05: 5th
Southern Hemisphere Conference on Undergraduate Mathematics and Statistics Teaching and Learning, pp.
22-26). Fraser Island, Australia.
Loch, B.I., & Donovan, D. (2006). Progressive teaching of mathematics with tablet technology. Australasian
Journal of Educatonal Technology, 9(2), 1-6.
Monash University (n.d.). e-Education Center. Retrieved June 26, 2013 from
http://www.monash.edu.au/eeducation/index.html
Olivier, W. (2005). Teaching mathematics: Table PC technology adds a new dimension. In A.Rogerson (Ed.),
Proceedings of the 8th International Conference on The Mathematics Education in to the 21st Century Project:
Reform, revolution and paradigm shifs in mathematics education (pp. 176-181). Johor Bahru, Universiti
Teknologi Malaysia.
Virginia Tech (n.d.). The bene fts of using a tablet. Retrieved June 26, 2013 from
http://www.eng.vt.edu/it/tabletbenefts
Wacom (n.d.) Company History. Retrieved March 11, 2013 from
http://www.wacom.co.jp/corporate/en/history.html
Ward, J.R. (n.d.) History of Pen and Gesture Computing: Annotated Bibliography in On-line Character
Recognition, Pen Computing, Gesture User Interfaces and Tablet and Touch Computers. Retrieved March 11,
2013, from http://rwservices.no-ip.info:81/biblio.html
Citation: Carrillo, A., Cejudo, J.M., Domínguez, F., & Rodríguez, E. (2013). Graphics tablet technology in second
year thermal engineering teaching. Journal of Technology and Science Educaton (JOTSE), 3(3), 102-112.
http://dx.doi.org/10.3926/jotse.85
On-line ISSN: 2013-6374 – Print ISSN: 2014-5349 – DL: B-2000-2012
Vol. 3(3), 2013, pp 111Journal of Technology and Science Education – http://dx.doi.org/10.3926/jotse.85
AUTHORS BIOGRAPHY
Antonio Carrillo
Lecturer at the Univ. of Málaga (Thermal Machines and Engines Department, Energy Research Group). He is
responsible of the “Graphics Tablet Technology applied to Thermal Engineering Teaching” research initiative.
José M. Cejudo
Tenured Professor at the Univ. of Málaga (Thermal Machines and Engines Department). He is responsible of
the Energy Research Group.
Fernando Domínguez
Assistant Lecturer at the Univ. of Málaga (Thermal Machines and Engines Department, Energy Research
Group). He is responsible of the “Thermal Sciences Concepts Inventory to Diagnose Students’ Misconceptions”
Educational Research Project.
Eduardo A. Rodríguez
Tenured Professor at the Univ. of Málaga (Thermal Machines and Engines Department, Energy Research
Group). He is responsible of the “On-going Evaluation” research initiative.
Published by OmniaScience (www.omniascience.com)
Journal of Technology and Science Education, 2013 (www.jotse.org)
Article's contents are provided on a Attribution-Non Commercial 3.0 Creative commons license. Readers are
allowed to copy, distribute and communicate article's contents, provided the author's and Journal of
Technology and Science Education journal's names are included. It must not be used for commercial purposes.
To see the complete licence contents, please visit http://creativecommons.org/licenses/by-nc/3.0/es/
Vol. 3(3), 2013, pp 112You can also read