Kinetics of slow release of nitrogen fertiliser from multi layered nanofibrous structures - Nature
←
→
Page content transcription
If your browser does not render page correctly, please read the page content below
www.nature.com/scientificreports
OPEN Kinetics of slow release of nitrogen
fertiliser from multi‑layered
nanofibrous structures
Leila Javazmi1,2*, Anthony Young2,3, Gavin J. Ash 2
& Tobias Low1
Fertilisers are essential in modern agriculture to enhance plant growth, crop production and product
quality. Recent research has focused on the development of delivery systems designed to prolong
fertiliser release. This study introduces a new technology to encapsulate and release molecules of
fertilisers by using multi-layered electrospun nanofibre as a carrier. Single-layer poly L-lactic acid
(PLLA) nanofibres loaded with urea were fabricated using electrospinning. Triple-layer nanofibrous
structures were produced by electrospinning polyhydroxybutyrate (PHB) nanofibres as external
layers with PLLA nanofibres impregnated with urea fertiliser as the middle layer. Scanning electron
microscopy (SEM) and Fourier transform infrared spectrophotometry (FTIR) were employed to
characterize the morphology of electrospun nanofibres. Urea release dynamic was analysed using
a total nitrogen instrument (TNM-1). The results indicated that triple-layered urea-impregnated
nanofibrous structures led to lower initial rate of nitrogen release and slower release rate of
cumulative nitrogen which extended for more than three months. It is concluded that triple-layer
nanofibrous structures have the potential for slow release delivery of fertilisers.
Nanofibres are filaments with diameters in the nanometre range and an aspect ratio (length: diameter) larger
than 100:11,2. This intrinsic features of nanofibres increases the surface area to volume ratio and decreases spaces
between individual nanofibres compared to regular fi bres3,4. There are several methods used to prepare nanofi-
bres, encompassing both top-down (melt-blown, melt electrospinning, islands-in-the-sea, and electrospinning)
and bottom-up (interfacial polymerization, self-assembly, and phase separation) a pproaches5.
Electrospinning is a production technique to prepare ultrafine fibres at a micro- or nanoscale. It has the ability
to spin a broad range of polymers, the potential for upscale, and provides precise control over morphology, aspect
ratio, pore-size distribution and porosity in comparison to other approaches to forming continuous nanofibres6,7.
Furthermore, electrospun nanofibres are ideal porous membranes given their open-pore structure (tens of nano-
metres to one micrometre), high surface area and high gas permeability. Such nanofibres have been used in areas
as diverse as filtrations, nanocomposites, drug delivery, biomedical, medical prostheses, fuel cells, sensors, and
protective clothing5,8. However, the use of electrospun nanofibers in agriculture is novel and still in its infancy9.
Fertilisers are used to promote plant growth, increase crop production and improve quality of products. The
officious use of nitrogenous fertiliser is hindered by system losses occurring through volatilization and l eaching10.
Recent investigations have focused on the development of systems using different materials that prolong the
release of fertilisers11. These systems aim to minimise soil contamination by controlling fertiliser release using
low cost sustainable m aterials10. Electrospun nanofibres have a very high specific surface area which makes them
promising candidates for delivery of a grichemicals12–14. Electrospun nanofibres have an advantage over particu-
late carriers to control fertiliser encapsulation as they are less likely to be washed away than nanoparticles9,15.
As a result, agricultural producers can potentially decrease the amount of fertiliser loss and prevent potential
environmental contamination, as well as fertiliser run-off, by using nanofibrous networks15.
Urea is a cost-effective solid nitrogen-based fertiliser used to promote plant growth and increase crop produc-
tion. However, uncontrolled excessive use of urea fertiliser is harmful to plants and can lead to soil and water
pollution12. Thus, significant research efforts have focused on prolonged-released systems that minimise adverse
environmental impacts and increase the efficiency of urea fertiliser u se16.
Electrospun nanofibres have been demonstrated as potential vehicles for agrichemical delivery. Urea impreg-
nated onto wheat gluten electrospun-fibre membranes was found to have a rapid release in the first 10 min,
1
School of Mechanical and Mechatronic Engineering, University of Southern Queensland, Toowoomba,
Australia. 2Centre for Crop Health, University of Southern Queensland, Toowoomba, Australia. 3School of
Agriculture and Food Sciences, The University of Queensland, Saint Lucia, Australia. *email: Leila.javazmi@
usq.edu.au
Scientific Reports | (2021) 11:4871 | https://doi.org/10.1038/s41598-021-84460-x 1
Vol.:(0123456789)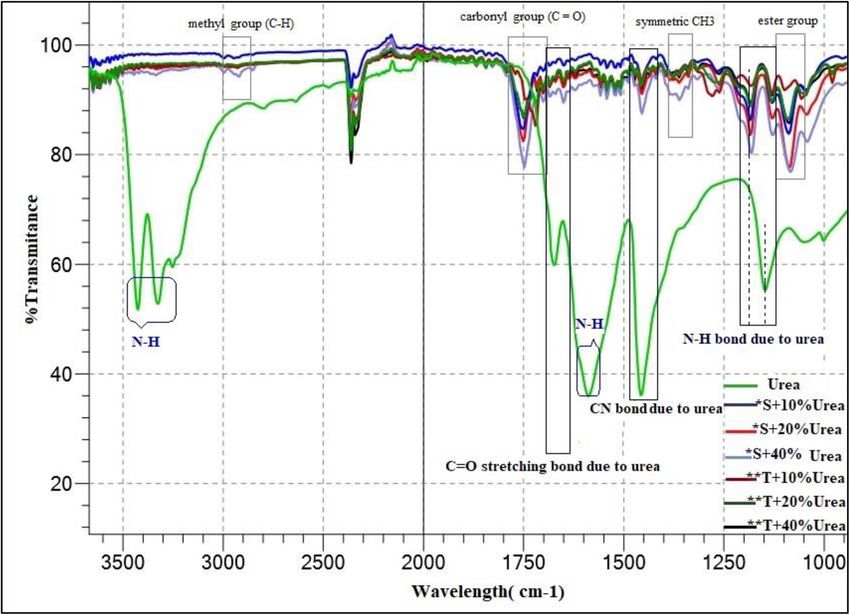
www.nature.com/scientificreports/
followed by a decreased rate until equilibrium at 5 h, when 98% was r eleased16. While demonstrating the potential
for nanofibre delivery of agrichemicals, the release dynamics were not suitable for slow-release f ertilisers17. An
advancement was coaxial electrospinning where urea was incorporated in the PLLA core surrounded by a PHB
sheath. This released urea for a month and biodegraded within three months18. To the best of our knowledge,
no research has reported encapsulation and release of agricultural chemicals from triple-layered nanofibrous
structures. The focus of this study was to provide proof of concept of this novel approach to the encapsulation
of urea within a triple-layered nanofibrous matrix.
Results and discussion
Electrospinning of single‑layered and triple‑layered nanofibre mats loaded with urea. A
custom electrospinning apparatus was used to produce single-layered PLLA nanofibres loaded with different
concentrations of urea. The PLLA solution was fixed at 5% (w/w), while urea was loaded at 10%, 20%, and 40%
(w/w), relative to the mass amount of PLLA, and transferred to a 1 mL syringe with an attached 18-gauge blunt
tip needle. Single-layered PLLA nanofibres loaded with different urea concentrations were collected onto an
aluminium foil surface and stored in a desiccator under vacuum for 24 h prior to use.
Triple-layer nanofibre mats consisting of a layer of PLLA sandwiched between PHB layers were prepared. A
PHB polymeric solution with concentration of 7% (w/w) was fed into the electrospinning apparatus using a 1 mL
syringe to produce the first PHB nanofibre layer on the surface of aluminium foil collector. Subsequently, 5%
PLLA solution with 5%, 10%, 20% and 40% (w/w) urea was electrospun onto the PHB nanofibre layer. Finally,
the outer surface of PLLA nanofibre layer was electrospun by another layer of PHB nanofibre resulting in a PHB/
PLLA/PHB triple-layer nanofibrous structure.
Nanofibre characterization. SEM (FEI Quanta 200 SEM 2002) at the Royal Melbourne Institute of Tech-
nology (RMIT) Microscopy and Microanalysis Facility (RMMF) and benchtop SEM (JEOL JCM-6000PLUS) at
the University of Southern Queensland (USQ) were used to determine the morphology of electrospun nanofi-
bres. Image J processing software was used to measure PLLA and PHB nanofibre diameters from high magnifica-
tion SEM images.
The morphology of electrospun nanofibres is dependent on electrospinning parameters including applied
voltage, solution composition, solution concentration, solution feed rate and collection distance19. When the
concentration of a polymeric solution increases, the solution viscosity i ncreases20. By keeping all electrospinning
parameters constant, and increasing the concentration of a polymeric solution, nanofibres are formed thicker
as the higher viscosity solution which prevents the polymer jet from stretching further and electrospinning
thinner fibres21.
In this study, the effect of urea concentration on nanofibre morphology was investigated. The diameter of
PLLA electrospun nanofibres increased from 496 to 782 nm as urea concentration increased from 0 to 40%
(Fig. 1, Table 1). The morphology and diameter distribution of 7% PHB electrospun nanofibres are shown in
Fig. 1I,J. The average diameters of the outer layer PHB nanofibres were 418 ± 64 nm. A typical SEM micrograph
cross section of triple-layer PHB/PLLA/PHB containing 10% urea is illustrated in Fig. 1K,L. The thickness of the
triple-layer nanofibrous structure is approximately 21 μm. The micrograph illustrates the nanofibre arrangement
and void spaces in the triple-layered structure.
Brunauer–Emmett–Teller (BET) analysis of the 5% PLLA electrospun nanofibres without loading urea indi-
cated that the porous fibrous mat was fabricated with a surface area of 188 m 2/g, a mean pore diameter of 37 nm
and a total pore area of 10 m /g. Thus, the structure satisfies the definition for nanofibrous s tructures22.
2
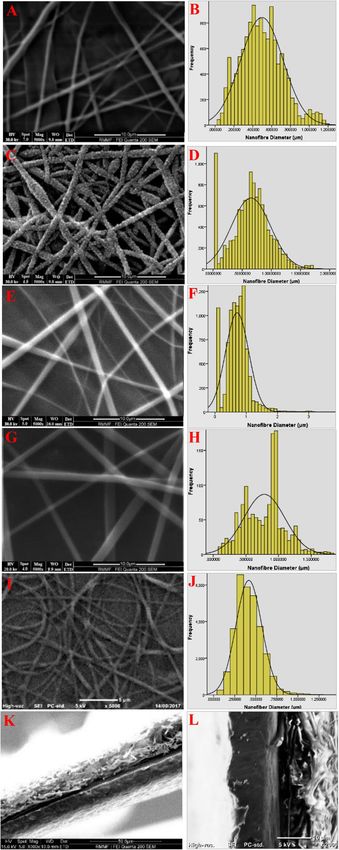
The FTIR spectrograph of urea powder and single- and triple-layered PLLA nanofibres loaded with 10%,
20% and 40% urea is shown in Fig. 2. Characteristic peaks of PLLA form at 1090–1190 cm−1 (ester bond), a
middle peak at 1362 cm−1 (–CH3 symmetric bending vibration), and two peaks at 2997 and 2947 cm−1 (methyl
groups)23. A characteristic strong peak of PLLA at about 1750 cm−1 is related to the stretching vibration of the
carbonyl group (C=O) shifted slightly from 1755 cm−124. In the FTIR spectra of urea, the peak in the region of
1629–1680 cm−1 is due to the C=O stretching bond of urea and the presence of absorption peaks at 3344, 3447
and 1157 cm−1 can be associated to the stretching vibration of N–H bonds25. The characteristic peaks of urea
at 1458 cm−1 and approximately 1596 cm−1 reflect the stretching vibration of the C–N bond and N–H bonding,
respectively26. The urea characteristic peaks at 1458 cm−1 (C–N bond), 1157 cm−1 (N–H bond) and between
1629–1680 cm−1 (C=O stretching) are all present in the FTIR spectrums of single- and triple-layered nanofi-
brous structures. However, peak positions of C=O and N–H bonds in PLLA nanofibres have been shifted due to
changes in vibrational frequency which can occur through changes in bond strength or in reduced mass of u rea27.
Urea release characteristics. A TNM-1 total nitrogen instrument (Shimadzu) was used to determine
the cumulative percentage of nitrogen released from single- and triple-layer nanofibres containing 10%, 20%,
and 40% urea, respectively (Table 2). Increasing urea percentage from 10% to 40% in both single-layered PLLA
nanofibre mat, and triple-layered PHB/PLLA/PHB nanofibrous structures, resulted in initial nitrogen release at
a higher rate (P value = 0.000) (Table 2). The nitrogen release rate of single-layered nanofibres was not signifi-
cantly affected by various urea concentration (P value = 0.361) (Fig. 3A), however, increasing urea concentration
into triple-layered nanofibres resulted in significantly higher nitrogen release rate (P value = 0.000). Statistical
analysis of the results (using a one-way ANOVA) for cumulative nitrogen release showed that at different urea
concentrations, triple-layered nanofibres containing 10% urea showed a highly significant decrease in release
rate compared with other samples (P value = 0.000).
For PLLA impregnated with 10% w/w urea, after 39 hours the triple-layered nanofibre mats had released less
than 50%, while the single layer mats had released over 80%. Based on these results, the experiment was repeated
Scientific Reports | (2021) 11:4871 | https://doi.org/10.1038/s41598-021-84460-x 2
Vol:.(1234567890)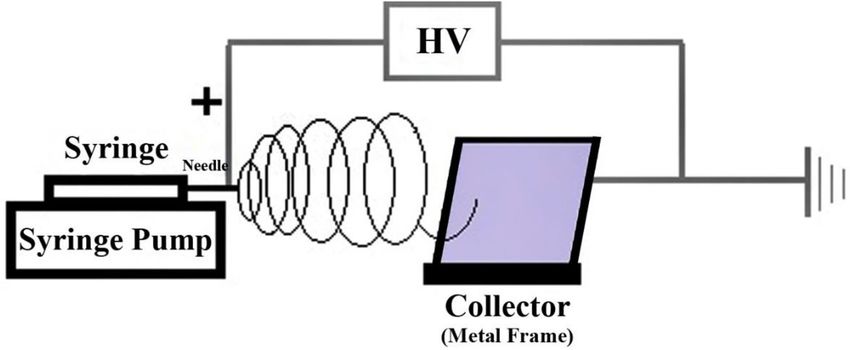
www.nature.com/scientificreports/

                                  Figure 1.  SEM images and related diameter histograms of PLLA electrospun nanofibres containing urea at
                                  concentrations of 0% *(A,B), 10% **(C,D), 20% *(E,F), and 40% *(G,H). SEM images and diameter distribution
                                  of 7% PHB electrospun nanofibres (I,J). SEM image of cross section of PHB/PLLA/PHB triple-layer nanofibrous
                                  structure containing 10% urea at (K) 1000 × magnification, and (L) 2000 × magnification. * Gold coating**
                                  Carbon coating.

Scientific Reports |   (2021) 11:4871 |              https://doi.org/10.1038/s41598-021-84460-x                                             3

                                                                                                                                       Vol.:(0123456789)
www.nature.com/scientificreports/
Urea concentration (*% w/w) Nanofibre diameter (nm) **CV%
0 496.183 22%
10 650.154 33%
20 710.000 37%
40 782.231 31%
Table 1. Effect of urea concentration on electrospun nanofibre diameter. *% w/w based on amount of PLLA
used. **Coefficient of Variation (CV).
Figure 2 . FTIR spectra of urea and single-, triple-layered PLLA nanofibres loaded with urea. Pure urea (Urea),
PLLA nanofibre containing 10% urea (*S+ 10%Urea), PLLA nanofibre containing 20% urea (*S+ 20%Urea),
PLLA nanofibre containing 40% urea (*S+ 40%Urea), PHB/PLLA/PHB nanofibre containing 10% urea (**T+
10%Urea), PHB/PLLA/PHB nanofibre containing 20% urea (**T+ 20%Urea), PHB/PLLA/PHB nanofibre
containing 40% urea (**T+ 40%Urea). *S: Single-layered PLLA nanofibre mat, **T: Triple-layered PHB/PLLA/
PHB nanofibrous structure.
for single- and triple-layered nanofibrous structure containing 10% urea. Figure 3B shows cumulative nitrogen
release from single- and triple-layered nanofibres loaded with 10% urea as well as the control sample for the
first 12 hours. Results revealed that triple-layer nanofibrous structure containing 10% urea released nitrogen at a
slower rate compared to single-layer nanofibrous structure encapsulating urea by either electrospinning fabrica-
tion or immersing deposition. The physical barrier of PHB nanofibre layers coating PLLA nanofibre layer resulted
in slower rate of urea release in triple-layered nanofibre containing 10% urea compared to single-layered PLLA
nanofibre. Furthermore, increasing the urea content into single- and triple-layered PLLA nanofibres resulted in
increasing bead numbers in samples28. Thus, fabricated multi-layered nanofibres can be considered a means of
delaying urea release from a PLLA nanofibrous matrix.
Conclusion
Single- and triple-layer nanofibrous structure were fabricated and loaded with urea using a custom-built electro-
spinning device. Fourier transform infrared Spectrophotometer analysis showed that urea was encapsulated in all
samples. As expected, increased urea concentration led to larger nanofibre diameters. Increasing the percentage
of urea loaded into nanofibres from 10% to 40% increased the initial rate of nitrogen release. Both single- and
triple- layered nanofibres samples released nitrogen for three months. Although high urea concentrations did not
affect the nitrogen release rate for single-layer nanofibres significantly (P value = 0.361), increasing urea content
into triple-layered nanofibres resulted in increasing nitrogen release content significantly (P value = 0.000).
Triple-layer nanofibrous structures containing 10% urea exhibited a significantly lower level and lower initial
rate of nitrogen release compared to single-layer nanofibres loading 10% urea (P value = 0.012). In conclusion,
Scientific Reports | (2021) 11:4871 | https://doi.org/10.1038/s41598-021-84460-x 4
Vol:.(1234567890)www.nature.com/scientificreports/
Time (h)/sample S10% urea S20% urea S40% urea T10% urea T20% urea T40% urea
1 27.30% 62.00% 78.60% 23.30% 50.80% 69.50%
2 59.10% 70.70% 81.60% 32.70% 64.60% 79.00%
4 75.20% 78.30% 82.80% 38.50% 71.80% 81.70%
14 79.70% 87.60% 85.30% 38.50% 83.20% 85.10%
39 84.80% 91.60% 88.90% 45.90% 88.40% 90.30%
63 89.00% 93.00% 91.00% 50.30% 90.40% 91.30%
87 90.60% 93.50% 91.20% 60.40% 91.00% 91.50%
137 90.60% 95.00% 91.40% 67.80% 91.60% 93.00%
230.5 91.80% 96.00% 92.50% 67.80% 93.00% 93.30%
278.5 91.80% 95.90% 92.80% 67.80% 93.40% 93.30%
1570.5 96.10% 97.60% 95.80% 82.50% 96.80% 95.90%
1592 96.10% 97.60% 96.20% 82.50% 96.80% 95.90%
1735.5 97.20% 98.20% 96.70% 87.40% 97.40% 96.80%
2963 100.00% 100.00% 100.00% 100.00% 100.00% 100.00%
3000 100.00% 100.00% 100.00% 100.00% 100.00% 100.00%
P value for initial nitrogen release 0.000 0.000
Table 2. Nitrogen release rate from single- and triple-layer nanofibre structures from first hour till 3000 h.
S single-layered PLLA nanofibre mat, T triple-layered PHB/PLLA/PHB nanofibrous structure, P value
probability value.
triple-layered electrospun PLLA nanofibres containing urea may be an effective carrier to control the release of
urea fertiliser in agriculture applications. These materials have the potential as slow-release delivery systems for
high-value agrochemicals.
Methods
Materials. Poly (L-lactide) (PLLA) with a molecular weight of 282kD was purchased from Vorina Bioma-
terials Company in Ireland (CAS Number: 33135-50-1). Poly [(R)-3-hydroxybutyric acid] (PHB) was provided
from Sigma Aldrich (Product Number: 363502). Solvents, N-Dimethylformamide (DMF); Reagent Plus®, ≥ 99%,
chloroform (CF); anhydrous, ≥ 99%. Acetone (AC) for HPLC, ≥ 99.8% were obtained from Australia Sigma
Aldrich. Urea (N: P: K; 46-0-0) was purchased from Richgro Garden Products. The amount of nitrogen is equal
to 46% urea mass.
Preparation of PLLA and PHB solutions. PLLA solution with optimum concentrations of 5% (w/w)
in chloroform: acetone (3:1 v/v) was prepared and mixed with 10, 20, and 40% (w/w) urea powder relative to
the weight of PLLA. Polyhydroxybutyrate polymeric solution in dimethylformamide: chloroform (30:70 v/v)
solvents was prepared at concentration of 7% (w/w).
Electrospinning apparatus. The schematic setup for nanofibre electrospinning is shown in Fig. 4. It con-
sists of a high voltage power supply, model 73,030, DC input 30 kV @ 1 mA, (Genvolt, Ireland), and a New Era
NE-300 “Just Infusion” syringe pump. A metal frame 14 cm × 16 cm with attached aluminium foil is located
15 cm from the syringe needle to collect the nanofibres. The positive terminal of the power supply is connected
to the needle and the ground terminal is attached to the collector (metal frame). The electrospinning process
occurs between the needle tip and the aluminium collector and nanofibres gather on the surface of the alu-
minium foil.
Electrospinning was conducted at 32 ºC with 12 (+ kV) high voltage, and 20 (+ kV) high voltage for PLLA
and PHB solutions, respectively. Feed rate and needle size for both solutions were selected at 1 mL/hr and 18 G.
The morphology of electrospun nanofibres was determined by varying the urea concentration ranging from 0%
to 40% in a fixed 5% PLLA solution.
Characterisation. Accelerated Surface Area and Porosimetry System (ASPA) 2400 Micropore Data Reduc-
tion was used to study BET analyses for the 5% PLLA electrospun nanofibre to evaluate surface areas, pore
diameters and total pore area.
FTIR measurements of urea powder and single-, triple-layered PLLA nanofibres loaded with 10%, 20%
and 40% urea were carried out using IRAffinity-1S Fourier transform infrared Spectrophotometer (Shimadzu).
Aluminium foil was used to place the samples under spectrophotometer.
The single- and triple-layered nanofibrous mats with a thickness of approximately 7 and 21 μm, respectively,
were cut into 2 cm × 6 cm pieces. These pieces were accurately weighed ± 0.00001 g and placed in a plastic tube
with 20 mL of milli-Q water to soak for 2 minutes to wash out any deposited urea fertiliser on the surface of the
nanofibrous mats. Subsequently, each sample was immersed in a 50 mL plastic tube with 20 mL milli-Q water
and placed in a shaker at 70 RPM and 30°C18. The samples were removed from the shaker and immersed in the
Scientific Reports | (2021) 11:4871 | https://doi.org/10.1038/s41598-021-84460-x 5
Vol.:(0123456789)www.nature.com/scientificreports/
120.00%
Cumulative Nitrogen Release (%)
100.00%
80.00%
60.00%
40.00%
20.00%
0.00%
Time (hour)
S10% urea S20% urea S40% urea
T10% urea T20% urea T40% urea
90
Cumulative Nitrogen Release (%)
80
70
60
50
40
30
20
10
0
0 2 4 6 8 10 12 14
Time (hours)
Nanofibres immersed in urea solution
Single layered nanofibre loading 10% urea
Triple layered nanofibres loading 10% urea
Figure 3. (A) Cumulative nitrogen release from single- and triple-layer nanofibre structures from first hour
until 3000 hours, and (B) Cumulative nitrogen release from immersed nanofibres in urea solution and single-,
triple-layer nanofibrous structure containing 10% urea from first hour until 12 hours. S single-layered PLLA
nanofibre mat, T triple-layered PHB/PLLA/PHB nanofibrous structure.
Figure 4. Schematic diagram of the electrospinning apparatus.
Scientific Reports | (2021) 11:4871 | https://doi.org/10.1038/s41598-021-84460-x 6
Vol:.(1234567890)www.nature.com/scientificreports/
next tube containing 20 mL milli-Q water at different periods, ranging from 0 up to 3000 hours. A TNM-1 total
nitrogen instrument (Shimadzu) was used to measure nitrogen release from the nanofibre mats. The data were
reported as percent nitrogen. Cumulative nitrogen release from each sample was calculated for the determined
period. A 5% PLLA nanofibre mat without loading urea immersed in 0.5% urea solution for 24 hours, was used
as the control sample. All experiments were carried out three times and results were reported as average ± one
standard deviation.
Received: 17 April 2019; Accepted: 12 February 2021
References
1. Kiyak, Y. & Cakmak, E. Nanofiber production methods. Electron. J. Text. Technol. 8, 49–60 (2014).
2. Huang, Z. M., Zhang, Y. Z., Kotaki, M. & Ramakrishna, S. A review on polymer nanofibers by electrospinning and their applica-
tions in nanocomposites. Compos. Sci. Technol. 63, 2223–2253 (2003).
3. Subbiah, T., Bhat, G. S., Tock, R. W., Parameswaran, S. & Ramkumar, S. S. Electrospinning of nanofibers. J. Appl. Polym. Sci. 96,
557–569 (2005).
4. Doshi, J. & Reneker, D. H. Electrospinning process and applications of electrospun fibers. J. Electrost. 35, 151–160 (1993).
5. Ali, U., Zhou, Y., Wang, X. & Lin, T. Electrospinning of Continuous Nanofiber Bundles and Twisted Nanofiber Yarns. Nanofibers
Prod. Prop. Funct. Appl. 153–174 (2011).
6. Ravandi, S. A. H., Tork, R. B., Dabirian, F., Gharehaghaji, A. A. & Sajjadi, A. Characteristics of yarn and fabric made out of nanofib-
ers. Mater. Sci. Appl. 6, 103–110 (2015).
7. Javazmi, L., Ravandi, S. A. H. & Ghareaghaji, A. A. Fabrication and characterization of PET nanofiber hollow yarn. Fibers Polym.
15, 954–960 (2014).
8. Basel Bazbouz, M. An Investigation of Yarn Spinning from Electrospun Nanofibres. Review Literature And Arts Of The Americas
(2009).
9. Noruzi, M. Electrospun nanofibers in agriculture and food industry: A review. J. Sci. Food Agric. 96, 4663–4678 (2016).
10. Al-Zahrani, S. M. Utilization of polyethylene and paraffin waxes as controlled delivery systems for different fertilizers. Ind. Eng.
Chem. Res. 39, 367–371 (2000).
11. Ni, B., Liu, M. & Lu, S. Multifunctional slow-release urea fertilizer from ethylcellulose and superabsorbent coated formulations.
Chem. Eng. J. 155, 892–898 (2009).
12. Chen, L., Xie, Z., Zhuang, X., Chen, X. & Jing, X. Controlled release of urea encapsulated by starch-g-poly(l-lactide). Carbohydr.
Polym. 72, 342–348 (2008).
13. Zhao, J. & Wilkins, R. M. Low molecular weight polylactic acid as a matrix for the delayed release of pesticides. J. Agric. Food Chem.
53, 4076–4082 (2005).
14. Correia, D. M. et al. Influence of electrospinning parameters on poly ( hydroxybutyrate ) electrospun membranes fiber size and
distribution. Polym. Eng. Sci. 54, 1608–1617 (2014).
15. Krishnamoorthy, V. & Rajiv, S. An eco-friendly top down approach to nutrient incorporated electrospun seed coating for superior
germination potential. J. Adv. Appl. Sci. Res. 1, 1–16 (2017).
16. Castro-Enriquez, D. D. et al. Preparation, characterization and release of urea from wheat gluten electrospun membranes. Materials
(Basel). 5, 2903–2916 (2012).
17. Trenkel, M. E. Controlled-Release and Stabilized Fertilizers in Agriculture. Libro Fertilizantes (1997).
18. Kampeerapappun, P. & Phanomkate, N. Slow release fertilizer from core-shell electrospun fibers. Chiang Mai J. Sci. 40, 775–782
(2013).
19. Ramakrishna, S., Fujihara, K., Teo, W., Lim, T. & Ma, Z. An Introduction to Electrospinning and Nanofibers (World Scientific Pub-
lishing Company, Singapore, 2005).
20. Deitzel, J. M., Kleinmeyer, J., Harris, D. & Beck Tan, N. C. The effect of processing variables on the morphology of electrospun
nanofibers and textiles. Polymer (Guildf.) 42, 261–272 (2001).
21. Kenwright, A. M., Peace, S. K., Richards, R. W., Bunn, A. & MacDonald, W. A. End group modification in poly(ethylene tereph-
thalate). Polymer (Guildf). 40, 2035–2040 (1999).
22. Hobzov, R. et al. Morphological characterization of nanofibers : methods and application in practice. J. Nanomater. 2012, 1–14
(2012).
23. Zare, A., Morshed, M., Bagheri, R. & Karimi, K. Effect of various parameters on the chemical grafting of amide monomers to poly
(lactic acid). Fibers Polym. 14(11), 1783–1793 (2013).
24. Sadeghi-Avalshahr, A. R., Khorsand-Ghayeni, M., Nokhasteh, S., Molavi, A. M. & Sadeghi-Avalshahr, M. Physical and mechanical
characterization of PLLA interference screws produced by two stage injection molding method. Prog. Biomater. 5, 183–191 (2016).
25. Lu, P., Zhang, Y., Jia, C., Li, Y. & Mao, Z. Use of polyurea from urea for coating of urea granules. Springerplus 5, 457 (2016).
26. Ahmad, S. I., Syed, I. A., Ravi Prasad, P. & Ahmad, A. Quantitation of urea in urine by Fourier transforms infrared spectroscopy.
Der Pharma Chem. 6, 90–96 (2014).
27. Colthup, N. B., Daly, L. H. & Wiberley, S. E. Introduction to Infrared and Raman Spectroscopy (Academic Press, Cambridge, 1990).
28. Rošic, R. et al. The role of rheology of polymer solutions in predicting nanofiber formation by electrospinning. Eur. Polym. J. 48,
1374–1384 (2012).
Acknowledgements
This work was supported financially by the Centre for Crop Health at University of Southern Queensland (USQ),
Australia. Authors thank Dr Peter Harris from Centre for Agricultural Engineering (CAE) at USQ for assis-
tance in reviewing final versions of the paper. Authors acknowledge support from RMMF group at Royal Mel-
bourne Institute of Technology University (RMIT) in using SEM (Scanning Electron Microscopy). We thank
Nadia Zakhartchouk, technical coordinator at College of Science Engineering and Health, RMIT for assistance
with BET analysis.
Author contributions
L.J. designed and performed the experiments, L.J. with T.L. analysed the data. L.J. wrote the manuscript with
input from all authors. T.L., A.Y. and G.A. conceived the study and oversaw overall direction and planning.
Competing interests
The authors declare no competing interests.
Scientific Reports | (2021) 11:4871 | https://doi.org/10.1038/s41598-021-84460-x 7
Vol.:(0123456789)www.nature.com/scientificreports/
Additional information
Correspondence and requests for materials should be addressed to L.J.
Reprints and permissions information is available at www.nature.com/reprints.
Publisher’s note Springer Nature remains neutral with regard to jurisdictional claims in published maps and
institutional affiliations.
Open Access This article is licensed under a Creative Commons Attribution 4.0 International
License, which permits use, sharing, adaptation, distribution and reproduction in any medium or
format, as long as you give appropriate credit to the original author(s) and the source, provide a link to the
Creative Commons licence, and indicate if changes were made. The images or other third party material in this
article are included in the article’s Creative Commons licence, unless indicated otherwise in a credit line to the
material. If material is not included in the article’s Creative Commons licence and your intended use is not
permitted by statutory regulation or exceeds the permitted use, you will need to obtain permission directly from
the copyright holder. To view a copy of this licence, visit http://creativecommons.org/licenses/by/4.0/.
© The Author(s) 2021
Scientific Reports | (2021) 11:4871 | https://doi.org/10.1038/s41598-021-84460-x 8
Vol:.(1234567890)You can also read