Impact of Prone Position on 12-Lead Electrocardiogram in Healthy Adults: A Comparison Study with Standard Electrocardiogram
←
→
Page content transcription
If your browser does not render page correctly, please read the page content below
Hindawi
Cardiology Research and Practice
Volume 2021, Article ID 6653061, 8 pages
https://doi.org/10.1155/2021/6653061

Research Article
Impact of Prone Position on 12-Lead Electrocardiogram in
Healthy Adults: A Comparison Study with
Standard Electrocardiogram

          Yunis Daralammouri ,1,2 Murad Azamtta ,1 Hamza Hamayel ,3 Amro Adas ,3
          Osama Sawalmeh ,3 Yahia Ismail ,1,2 and Saed H. Zyoud 4,5
          1
            Department of Cardiology, An-Najah National University Hospital, Nablus, State of Palestine
          2
            Department of Medicine, Faculty of Medicine and Health Sciences, An-Najah National University, Nablus, State of Palestine
          3
            Department of Internal Medicine, An-Najah National University Hospital, Nablus, State of Palestine
          4
            Poison Control and Drug Information Center, Faculty of Medicine and Health Sciences, An-Najah National University,
            Nablus, State of Palestine
          5
            Department of Clinical and Community Pharmacy, Faculty of Medicine and Health Sciences, An-Najah National University,
            Nablus, State of Palestine

          Correspondence should be addressed to Yunis Daralammouri; yunis71@yahoo.de

          Received 2 November 2020; Revised 26 January 2021; Accepted 2 February 2021; Published 11 February 2021

          Academic Editor: Julian Bostock

          Copyright © 2021 Yunis Daralammouri et al. This is an open access article distributed under the Creative Commons Attribution
          License, which permits unrestricted use, distribution, and reproduction in any medium, provided the original work is
          properly cited.
          Background. The standard electrocardiogram (ECG) is commonly performed in the supine posture. It may be difficult to report
          ECG in a supine posture for those who are unable to adopt the supine posture because of certain circumstances such as acute
          respiratory distress syndrome—patients who are placed in a prone position for long periods to improve oxygenation. Few data are
          available on the impact of the prone position on the ECG recording with electrodes on the posterior chest. Examining and
          analyzing the type and extent of changes observed in the prone ECG in healthy adults have become vitally valuable. Methods. A
          cross-sectional observational study enrolled forty healthy adults (24 males and 16 females) aged between 18 and 40 years. The ECG
          was performed in two different body positions, supine and prone. Influence of prone position on the heart rate, mean QRS axis,
          amplitude, morphology, duration, mean T wave axis and polarity, mean P wave axis, PR, and mean QTc duration was evaluated.
          Results. The mean heart rate was higher in the prone position (73.2 ± 12.4 bpm) compared with the supine position
          (69.5 ± 11.5 bpm, p � 0.03). The QRS duration decreased considerably from supine (92.8 ± 12.6 ms) to prone (84.9 ± 11.9 ms,
          p < 0.001). The mean QRS axis moved to the left in the prone posture (40.5° ± 32°) relative to the supine (49° ± 28°, p � 0.015). The
          QRS amplitude in the precordial leads was significantly decreased from supine (7.42 ± 3.1 mV) to prone (3.68 ± 1.7 mV, p < 0.001).
          In addition, changes in the QRS morphology in leads V1–V3 with the appearance of new Q waves were noted. A notable variation
          in the mean corrected QT (QTc) period with decrease in duration in prone posture ECG (385 ± 64.8) relative to supine (406 ± 18.8,
          p � 0.05). Conclusions. Prone position ECG resulted in significant changes in healthy adults that should be aware of this as this can
          affect diagnosis and management strategies. Further studies are needed to investigate the impact of prone position on ECG
          recording in patients with cardiovascular diseases.

1. Introduction                                                          drug and toxin effects, and electrolyte disturbances [1, 2]. The
                                                                         conventional ECG is usually reported in the supine posture, and
The electrocardiogram (ECG) is a widely used tool to study the           the definition of different normal variables is determined on the
heart’s electrical activity, and it is most frequently used to di-       basis of ECG recordings in the supine position.
agnose different heart conditions. It is an effective method to                However, in those who are unable to adopt the supine
diagnose ischemic changes, arrhythmia, conduction defects,               posture owing to certain limitations requiring them to take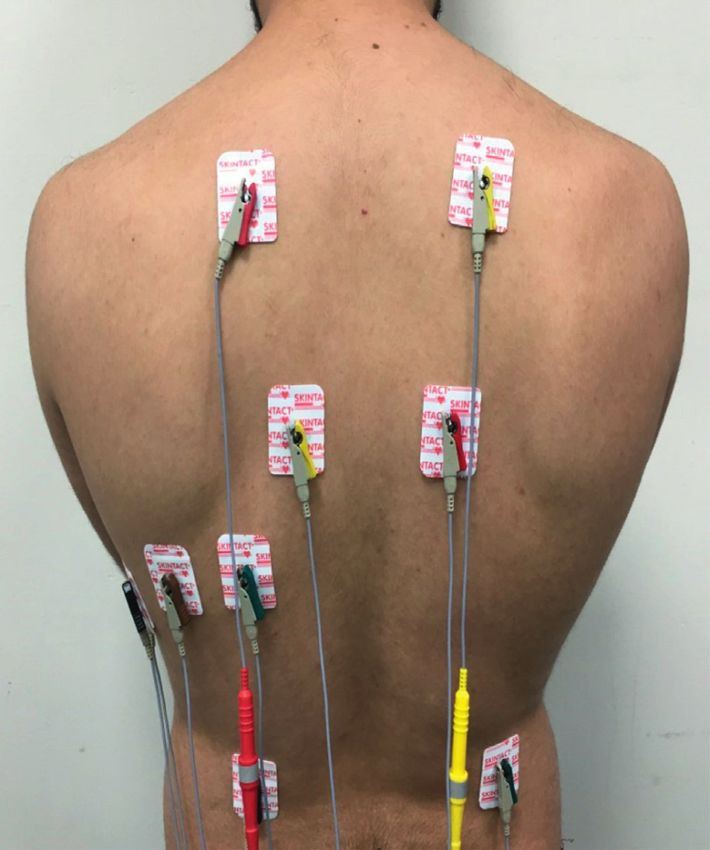
2 Cardiology Research and Practice
other positions, it may be difficult to report ECG in the nonsmoker. Subjects who did not meet the inclusion criteria
supine position. For example, acute respiratory distress and those with any concomitant cardiovascular disease were
syndrome (ARDS) patients are placed in a prone position for excluded. All participants provided written informed consent
long periods during the day to enhance oxygenation and for participation in the study. The Institutional Review Board of
minimize mortality [3–5]. In addition, a prone posture may An-Najah National University approved the study.
also be used in morbidly obese patients and patients with
burns, skin flaps, or cut wounds in the back of the body.
Moreover, the new evolving coronavirus disease 2019 2.2. Data Collection. Demographic and clinical information
(COVID-19) infection, which is currently considered a were collected from the patients and their medical records.
major cause of ARDS, was found to have a significant impact These included age, body mass index, smoking history, and
on the heart. Myocardial injury frequency is variable among history of any previous medical disease. Vital signs, he-
hospitalized patients with COVID-19, it ranges from 7 to modynamic, and volume status were also assessed. All
28%, and it is manifested by decreasing ejection fraction and subjects had echocardiography by cardiologists at An-Najah
elevation of troponin I and was an independent risk factor National University Hospital.
for hospital death [6–8]. These findings make ECG very
essential for the evaluation of these patients when they are in
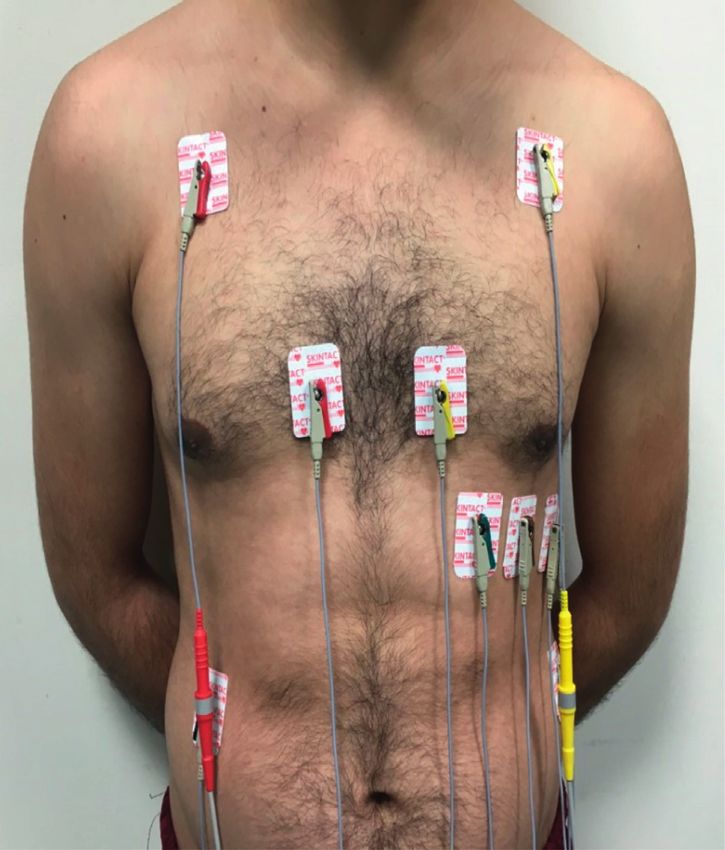
the prone position. 2.3. Recording of Electrocardiogram. The ECG was recorded
Few studies have been conducted to investigate the in the supine position in accordance with the ECG protocol
effect of changing body position on ECG recording. Most of using a NIHON KOHDEN machine. It was programmed for
these studies aimed to compare the ECG reported in the a paper speed 25 mm/sec and a voltage of 1 mm equals
supine position with right and left lateral decubitus pos- 0.1 mV. Subjects were then placed in the prone position for
tures in patients who have been surveyed in intensive care 15 minutes following which the ECG was recorded with
units for myocardial ischemia [9–11]. Other studies have precordial leads placed over the back V1, V2, V4, V3, V5,
reported the impact of postural changes from supine to and V6 as follows; in the right side of the vertebral spine at
setting up and standing position on ECG recording the 4th intercostal space, at the 4th intercostal space on the
[12–14]. Up to author knowledge, previous studies have left border of vertebral column, in the left 5th intercostal
compared the effect of position change from supine to space in midclavicular line, in midpoint between V2 and V4,
prone on ECG recording. at left 5th intercostal space in midaxillary line, and in the left
A recently released case report recorded some of the 5th intercostal space on the anterior axillary line, respec-
ECG changes observed in the prone position in patients with tively (Figure 1).
COVID-19 pneumonia and ARDS [15]. These patients were
placed for at least 16 hours during the day in a prone po- 2.4. Data Storage and Analysis. The two forms of ECG were
sition. While this is highly relevant and important, the type analyzed by 2 cardiologists blinded to the method/posture of
and extent of variation observed in the ECG on the tran- the participants. The following variables were examined:
sition in the position from supine to prone in healthy adults
must also be examined and quantified. Such modifications (i) Heart rate
will be crucial for the analysis of the ECG performed in the (ii) Mean QRS vector
prone position as in patients with ARDS. In these patients, it (iii) Mean P wave vector
will also afford perception of the possibility of ECG re-
cording in the prone position. (iv) Mean T wave vector
The current study was conducted to identify and mea- (v) Mean QRS amplitude
sure ECG changes regarding the mean electrical axis, (vi) QRS duration
waveform morphology and amplitude, and different seg-
(vii) QRS morphology
ments and intervals of the position shift from supine to
prone position in healthy subjects and to investigate the (viii) T wave polarity
possibility of ECG recording in routine clinical practice in (ix) PR interval
positions other than supine position. (x) ST segment changes
(xi) Mean corrected QT interval (QTc)(Bazett’s
2. Materials and Methods Formula)
2.1. Study Design, Setting, and Population. This cross-sec- All ECG variables were recorded using the computed
tional study was conducted between March 1, 2020, and June ECG machine except for the QRS amplitude that was
30, 2020, at the cardiology department of An-Najah National measured to the nearest 0.5 mm by calculating the sum of the
University Hospital (NNUH), Nablus, Palestine. A conve- highest positive and lowest negative deflection in the limbs
nience sample of 40 healthy nonsmoking males and females and precordial leads with the help of magnifying glass and
aged 18–40 years was randomly selected to be enrolled in this calipers, and the calibration was 1 mV � 10 mm. ST-T
study. Subjects had to meet the following criteria to be included changes reported with positional changes were defined as a
in the study: age 18–40 years, healthy, specifically with no deviation (elevation or depression) of at least 1 mm in at least
history of previous cardiovascular or respiratory disease, and one lead.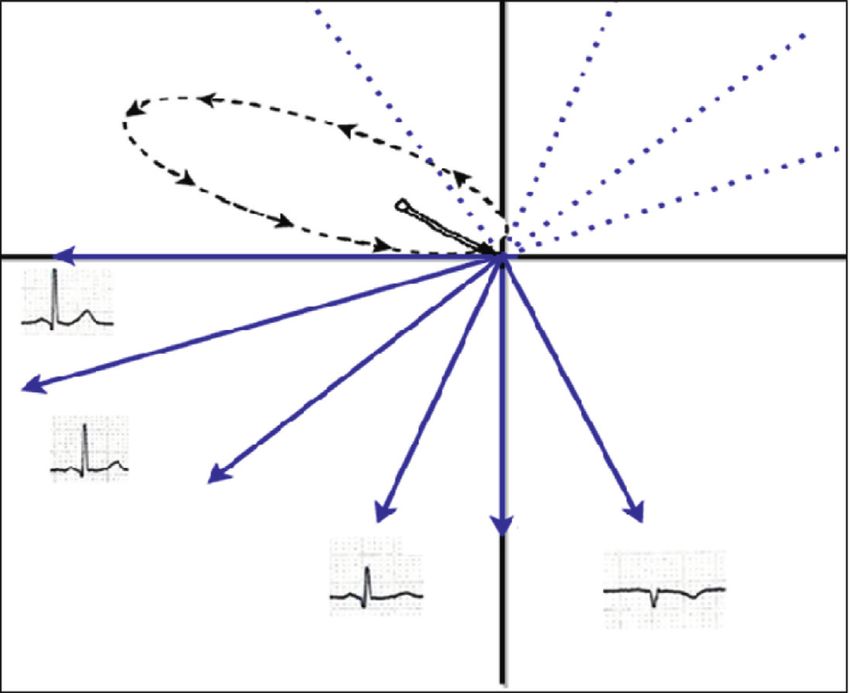
Cardiology Research and Practice                                                                                                                     3

                                                             LA
                               RA                                                      LA                RA

                                       V1               V2                                   V2               V1

                                                   V3        V5                       V4V3
                                                                                 V5

                                                             L L
                                RL
                                                                                      L L                     RL

                                             (a)                                                   (b)

Figure 1: (a) Standard position of anterior precordial leads. The patient’s right side is on the left of the picture. (b) Location of precordial
leads on posterior chest in prone position. The patient’s right side is on the right of the picture. The precordial leads are positioned on the
posterior chest opposite to their normal anterior location. The limb leads have preserved their left-right orientation. On the right of the spine
is lead V1. Leads V2 through V6 are situated to the left of the spine.

2.5. Statistical Analysis. The clinical and demographic
                                                                           Table 1: Baseline demographic and clinical characteristics of
characteristics of the participants were summarized using
                                                                           patients.
descriptive statistics. Means with standard deviation (SD)
were used to summarize continuous variables and fre-                       Variable                                  Mean ± SD or frequency (%)
quencies with percentages for categorical variables. We used               Age∗                                              30.5 ± 6.3
the independent sample t-test and Pearson’s chi-square (χ 2)               Gender, n (%)∗∗
test to examine for any statistically significant differences                Female                                               16 (40%)
between characteristics. All outcome variables were nor-                   Male                                                 24 (60%)
mally distributed, and no data transformation was needed.                  Smoking, n (%)∗∗
Any p value less than or equals 0.05 is considered statistically           No                                                  40 (100%)
significant, and all analyses were conducted using SPSS                     Yes                                                  0 (0%)
computer software, version 21.0 (IBM Corp).                                Medical Disease, n (%)∗∗
                                                                           No                                                  40 (100%)
                                                                           Yes                                                  0 (0%)
3. Results                                                                 Body mass index∗                                    25.9 ± 6.3
                                                                           ∗
Baseline and clinical characteristics of subjects are sum-                  Statistical significance of differences calculated using the independent
marized in Table 1. A total of 40 subjects enrolled in the                 sample t-test. ∗∗ Statistical significance of differences calculated using the
                                                                           Pearson’s chi-square (χ2) test.
study, with a mean age of 30.5 ± 6.3 years, ranging from 23 to
39 years, twenty-four (60%) of the subjects were males and
the remaining sixteen (40%) were females, and the mean                     The QRS amplitude in the precordial leads had a substantial
BMI was 25.9 ± 6.3. All subjects were healthy with no pre-                 reduction with the change of position from supine
vious medical disease.                                                     (7.42 ± 3.1 mV) to prone (3.68 ± 1.7 mV, p < 0.001), while
    Figure 2 shows two ECGs performed in the supine and                    there were no significant changes in the QRS amplitude in
prone position. The heart rate has markedly increased in                   the limb lead (p � 0.513) (Table 2) and (Figure 2).
the prone position (73.2 ± 12.4 bpm) compared with the                         The QRS duration has noticeably decreased with the
supine position (69.5 ± 11.5 bpm, p � 0.03). In addition,                  position shift from supine (92.8 ± 12.6 ms) to prone
there was a notable alteration in the mean QRS axis be-                    (84.9 ± 11.9 ms, p < 0.001). Furthermore, the QTc interval is
tween the supine and prone ECG with a shift of the mean                    calculated using the Bazett formula; QTc (ms) � QT mea-
QRS axis to the left in the prone position (40.5° ± 32°)                   sured/[square root of (RR)] (where RR is the RR interval) has
compared with the supine position (49° ± 28°, p � 0.015).                  significantly reduced with the change of position from su-
However, no significant variations were noted in the mean                   pine (406 ± 18.8) to prone (385 ± 64.8, p � 0.05). However,
P wave axis of postural changes from supine (43.4 ± 22.6) to               there was no considerable variation in the PR interval with
prone (47.6 ± 27.3, p � 0.36) as well as the mean T wave axis              change position (155.6 ± 24.8 ms) from supine to prone
in supine (43.6 ± 20.3) and prone (39.1 ± 20.6, p � 0.86).                 (159.1 ± 27.2 ms, p � 0.37) (Table 2) and (Figure 2).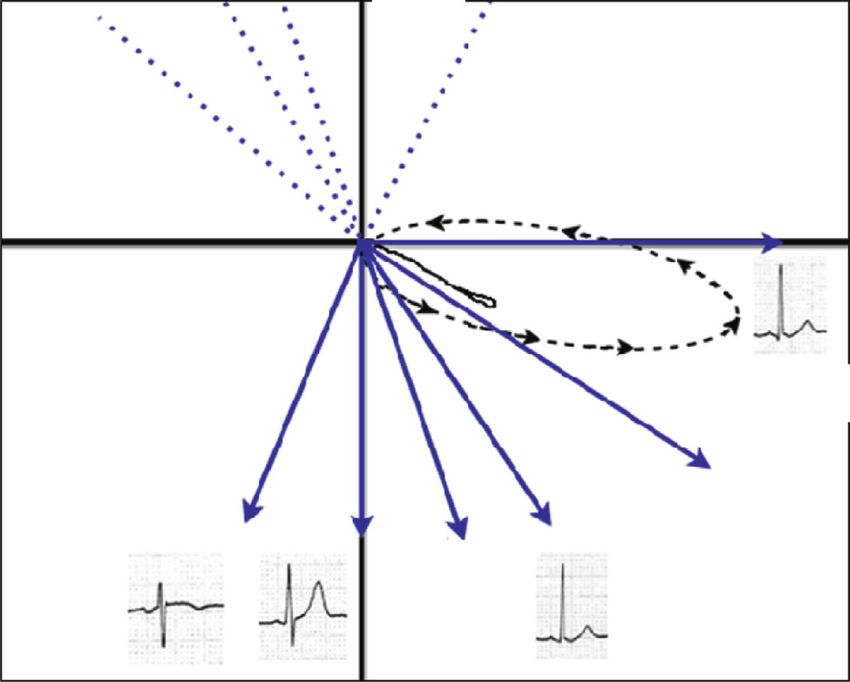
4                                                                                                              Cardiology Research and Practice

                                                                          (a)

                                                                          (b)

Figure 2: (a) Supine ECG, normal sinus rhythm, and normal frontal QRS axis. (b) Prone ECG in the same patient. Low QRS amplitude was
noted in precordial leads, and new Q waves were seen in leads V1 to V3.

       Table 2: Effect of prone position on heart rate, mean electrical axis, QRS amplitude, QRS duration, PR, and QTc interval.
Variable                                                                       Supine                            Prone                        P value∗
Heart rate (bpm)                                                             69.5 ± 11.5                       73.2 ± 12.4                      0.03
Mean QRS vector (degree)                                                      49.8 ± 28                         40.5 ± 32                       0.015
Mean T wave vector (degree)                                                  43.6 ± 20.3                       39.1 ± 20.6                      0.86
Mean P wave vector (degree)                                                  43.4 ± 22.6                       47.6 ± 27.3                      0.36
Mean QRS amplitude in the precordial leads (mV)                             7.42 ± 3.1 mV                    3.68 ± 1.7 mV
Cardiology Research and Practice 5
Table 3: Effect of prone position on QRS morphology and T wave polarity in precordial leads.
Precordial leads Supine position ECG Prone position ECG
QRS morphology RS in 77.5% of cases QR in 72.5% of cases
V1
T wave polarity Negative in 70% of cases Negative in 95% cases
QRS morphology RS in 70% of cases QR in 90% of cases
V2
T wave polarity Positive in 95% of cases Negative in 47.5% cases
QRS morphology RS in 52% of cases QR in 100 of cases
V3
T wave polarity Positive in 95% of cases Negative in 95% of cases
Data are expressed as percentages. ∗∗
Statistical significance of differences calculated using the Pearson’s chi-square (χ2) test.
segment. These changes were linked to variations in the heart study, in addition to the change in body position, the
position inside the thorax as a result of postural changes in electrode location was also changed from the anterior chest
addition to changes in lung volume [16, 17]. There have been wall to the posterior chest.
several studies in the past evaluating the impact of postural A comparison of the mean QRS amplitude between the
changes (supine, sitting, standing, and lying) on the ECG, prone and standard supine ECG revealed a significant de-
but no previous studies have examined the effect of prone crease in the precordial lead in the prone position
position on ECG recording. (3.68 ± 1.7 mV) compared with supine position
In our study, ECG has been recorded in two distinct (7.42 ± 3.1 mV, p < 0.001), while there was no difference in
positions, supine and prone, in 40 healthy adults. Twenty- the limb leads. This would affect the conventional criteria
four (60%) of the subjects were males and 16 (40%) were used for LVH diagnosis; minimal ST segment changes in
females; the mean age was 30.5 ± 6.3 years. Influence of precordial leads can also be significant. When patients are in
prone position on the heart rate, mean QRS axis, amplitude a prone posture, their heart drops ventrally and shifts
and duration, P wave axis, T wave axis and morphology, PR, caudally along the anterior chest wall [22]. Looking from the
and QTc duration was evaluated, and the association be- back, the heart is further away from the posterior chest lead.
tween these ECG variables and postural changes of the body The further distal location of the heart combined with
were analyzed. greater impedance from soft tissue (lungs and mediastinum)
In this analysis, the heart rate has significantly increased and bones (scapula and vertebrae) between the displaced
in the prone position (73.2 ± 12.4 bpm) compared with the myocardium and the electrodes can explain our finding of a
supine position (69.5 ± 11.5 bpm, p � 0.03). This result was smaller QRS amplitude in precordial leads; the condition
also supported by several earlier studies that demonstrated a may be aggravated by diseased lungs.
considerably higher heart rate in the prone posture [18, 19]. When ECGs were recorded for patients in prone posture,
This fact must be addressed when ECG is performed in a precordial leads were always shown to have comparatively
prone position for patients with sepsis and hypovolemia as smaller P waves and notable Q waves in leads V1 through
the heart rate plays an important role in determining the V3, which contributed to the misinterpretation as an
response of these patients to various forms of care. The anteroseptal myocardial infarction. These variations can be
finding of a higher heart rate in prone posture was explained clarified through the vectorcardiograms [23, 24]. The vector
by reduction in venous preload (inferior vena cava com- loop tracks the course of the action potential during the
pression) and a rise in resistance to left ventricular filling cardiac cycle. For example, the ventricle stimulation initially
(due to increased intrathoracic pressure), leading to a lower progresses from the left bundle to the interventricular
stroke volume [20]. This was assumed to lower arterial pulse septum and then to the left and right ventricular walls. The
waves that inhibited baroreflexes and consequently en- interaction between the vector loops and the limb leads on
hanced nervous sympathetic activity and increased the heart the ECG tracing does not significantly change between the
rate [19]. supine and the prone posture in the frontal plane. However,
In comparison with the supine position, the prone ECGs the vector loops are shifted anteriorly far from the posterior
revealed significant changes in the mean QRS axis and lead in the horizontal plane, clarifying the emergence of Q
suggest that such observations can contribute to erroneous waves in the prone position on the surface ECG (Figure 3).
interpretations. It was noted that the QRS axis was shifted to Prone ECGs have demonstrated important differences in
left in the prone position (40.5° ± 32°) compared with the QRS duration to change position from supine to prone,
supine position (49° ± 28°, p � 0.015). Therefore, in the interestingly; QRS duration was shorter in the prone posi-
presence of these changes, we cannot rely on the prone tion (84.9 ± 11.9 ms) compared with the supine position
position ECG to detect left axis deviation and left anterior (92.8 ± 12.6 ms, p < 0.001). This statement should be con-
fascicular block. This is in accordance with previous studies sidered when analyzing prone ECG looking for bundle
that documented this axis change. These shifts were con- branch blocks, pre-excitation syndrome, and ventricular
tributed to variations in the anatomical location of the heart arrhythmias. These differences in the QRS interval can be
inside the thorax. Whereas a relatively hard tissue holds the explained by the fact that QRS duration is correlated with the
heart at its base, the apical end of the heart can move sig- heart size [25]. Previous studies have shown that both di-
nificantly inside the chest with simple movement of patients, astolic and systolic volumes change in response to postural
leading to changes in the electric vectors [21, 22]. In our variations [26]. Owing to the decrease of venous blood flow6 Cardiology Research and Practice
Posterior Anterior
V6 V6
Left Right
Right
Left V5
V5 V4
V1 V2 V3 V4 V3 V2 V1
Anterior Posterior
(a) (b)
Figure 3: The correlation between QRS vector loops and ECG tracing has been explained. From the centre of the x-y-z axes, QRS waveform
circuits are initiated. Sequential 2-ms increments during ventricular depolarization are marked by arrows. On the ECG leads tracing, the
amplitude of QRS complexes is consistent with the vertical direction of the vector loop at a specific location and time. (a) In the supine
position, the horizontal vector loop showed that, at first, the ventricular depolarization loop was anteriorly and leftward directed towards the
anterior chest precordial leads (V1 to V3), resulting in initial positive deflection in these leads. (b) In the prone position, the horizontal
vector loop showed that the ventricular depolarization loop was initially oriented anteriorly and leftward away from precordial leads V1 to
V3, which are positioned on the back of the patient, resulting in new Q wave emergence and low QRS amplitude.
(caused by compression of the inferior vena cava), in ad- Abbreviations
dition to compression of the heart within the thoracic cavity,
the heart size will be smaller in the prone position. ECG: Electrocardiogram
The current study also revealed changes in the mean QTc ARDS: Acute respiratory distress syndrome
interval with the change of position from supine (406 ± 18.8) COVID-19: Coronavirus disease 2019
to prone (385 ± 64.8, p � 0.055). This observation has to be NNUH: Najah National University Hospital
taken into account when interpreting prone ECG record- SPSS: Statistical Package for the Social Sciences.
ings, as it will lead to spurious interpretation when inves-
tigating arrhythmogenic QT syndromes, drug side effects, Data Availability
and electrolyte abnormalities. As stated earlier, the prone
posture is associated with a significantly shorter QRS du- All data are included within the article. The raw data are
ration, which also contributes to the shortening of the QT available from the corresponding author upon request.
interval. Differences in the QTc interval with postural
changes have been confirmed in many previous studies, Ethical Approval
emphasizing that position changes can result in variations in
cardiac repolarization [27–29]. The study was approved by the Institutional Review Board of
Our study has several limitations, including the small An-Najah National University.
sample size and all subjects involved in this study are healthy
and have no cardiorespiratory disease. Further studies in Consent
these patients are required to compare the pathological
findings of ECG in prone and supine positions. Full verbal and written consent has been obtained from all
patients. No personal data are shared that might compro-
5. Conclusions mise the anonymity of the patients.
A shift of body position from supine to prone with dis- Conflicts of Interest
placing precordial leads on the posterior chest causes
changes in the ECG recording. These changes include The authors declare no conflicts of interest.
variations in the heart rate, mean QRS axis, amplitude,
duration, and morphology, as well as changes in the mean Authors’ Contributions
corrected QT interval (Bazett’s formula). These variations
need to be considered when ECG is performed in a prone YD, MA, and YI designed the study and its protocol. MA,
position because of medical reasons, such as patients with AA, OS, and HH collected the data. YD performed data
COVID-19 and ARDS. analysis. All authors reviewed the manuscript critically forCardiology Research and Practice 7
important intellectual content. All authors read and ap- [14] S. Khare and A. Chawala, “Effect of change in body position
proved the final manuscript for submission. on resting electrocardiogram in young healthy adults,”
Nigerian Journal of Cardiology, vol. 13, no. 2, pp. 125–129,
2016.
Acknowledgments [15] H. H. Nguyen, R. G. Trohman, and H. D. Huang, “Influence of
prone positioning on electrocardiogram in a patient with
The authors thank the Clinical Research Center of An-Najah COVID-19,” JAMA Internal Medicine, vol. 180, no. 11,
National University Hospital for their wise pieces of advice. p. 1521, 2020.
Moreover, the authors thank the internal medicine resident [16] R. S. MacLeod, Q. Ni, B. Punske, P. R. Ershler, B. Yilmaz, and
doctors and nursing staff in the Cardiology Department at B. Taccardi, “Effects of heart position on the body-surface
An-Najah National University Hospital for making the electrocardiogram,” Journal of Electrocardiology, vol. 33,
study possible. pp. 229–237, 2000.
[17] R. S. MacLeod, R. L. Lux, and B. Taccardi, “A possible
mechanism for electrocardiographically silent changes in
References cardiac repolarization,” Journal of Electrocardiology, vol. 30,
pp. 114–121, 1998.
[1] Y. Sattar and L. Chhabra, Electrocardiogram. StatPearls,
[18] N. Watanabe, J. Reece, and B. I. Polus, “Effects of body po-
StatPearls Publishing LLC., Treasure Island, FL, USA, 2020.
sition on autonomic regulation of cardiovascular function in
[2] P. Kligfield, L. S. Gettes, J. J. Bailey et al., “Recommendations
for the standardization and interpretation of the electrocar- young, healthy adults,” Chiropractic & Osteopathy, vol. 15,
diogram,” Heart Rhythm, vol. 4, no. 3, pp. 394–412, 2007. p. 19, 2007.
[3] C. Guérin, J. Reignier, J.-C. Richard et al., “Prone positioning [19] B. Pump, U. Talleruphuus, N. J. Christensen, J. Warberg, and
in severe acute respiratory distress syndrome,” New England P. Norsk, “Effects of supine, prone, and lateral positions on
Journal of Medicine, vol. 368, no. 23, pp. 2159–2168, 2013. cardiovascular and renal variables in humans,” American
[4] L. Munshi, L. Del Sorbo, N. K. J. Adhikari et al., “Prone Journal of Physiology-Regulatory, Integrative and Comparative
position for acute respiratory distress syndrome. A systematic Physiology, vol. 283, no. 1, pp. R174–R180, 2002.
review and meta-analysis,” Annals of the American Thoracic [20] S. Toyota and Y. Amaki, “Hemodynamic evaluation of the
Society, vol. 14, no. Supplement_4, pp. S280–S288, 2017. prone position by transesophageal echocardiography,” Jour-
[5] P. Ghelichkhani and M. Esmaeili, “Prone position in man- nal of Clinical Anesthesia, vol. 10, no. 1, pp. 32–35, 1998.
agement of COVID-19 patients; a commentary,” Archives of [21] H. Pan, Z. Xu, H. Yan et al., “Lying position classification
Academic Emergency Medicine, vol. 8, no. 1, p. e48, 2020. based on ECG waveform and random forest during sleep in
[6] S. Shi, M. Qin, B. Shen et al., “Association of cardiac injury healthy people,” Biomedical Engineering Online, vol. 17, no. 1,
with mortality in hospitalized patients with COVID-19 in p. 116, 2018.
wuhan, China,” JAMA Cardiology, vol. 5, no. 7, pp. 802–810, [22] W. Ball, J. Wicks, and F. Mettler Jr, “Prone-supine change in
2020. organ position: CT demonstration,” American Journal of
[7] G. Lippi, C. J. Lavie, and F. Sanchis-Gomar, “Cardiac troponin Roentgenology, vol. 135, no. 4, pp. 815–820, 1980.
I in patients with coronavirus disease 2019 (COVID-19): [23] C. A. Pastore, N. Samesima, H. G. Pereira Filho, N. Tobias,
evidence from a meta-analysis,” Progress in Cardiovascular B. A. Madaloso, and M. E. Facin, “Applicability of the electro-
Diseases, vol. 63, no. 3, pp. 390-391, 2020. vectorcardiogram in current clinical practice,” Arquivos
[8] K. J. Clerkin, J. A. Fried, J. Raikhelkar et al., “COVID-19 and brasileiros de cardiologia, vol. 113, no. 1, pp. 87–99, 2019.
cardiovascular disease,” Circulation, vol. 141, no. 20, [24] A. Klajman, L. Sherf, and N. Kauli, “The Normal vectorcar-
pp. 1648–1655, 2020. diogram,” The American Journal of Cardiology, vol. 11, no. 2,
[9] M. G. Adams and B. J. Drew, “Body position effects on the pp. 187–193, 1963.
ECG,” Journal of Electrocardiology, vol. 30, no. 4, pp. 285–291, [25] B. Surawicz, R. Childers, B. J. Deal et al., “AHA/ACCF/HRS
1997. recommendations for the standardization and interpretation
[10] J. D. Dougherty, “Change in the frontal QRS axis with changes of the electrocardiogram: part III: intraventricular conduction
in the anatomic positions of the heart,” Journal of Electro- disturbances: a scientific statement from the American heart
cardiology, vol. 3, no. 3-4, pp. 299–308, 1970. association electrocardiography and arrhythmias committee,
[11] B. L. Nørgaard, B. M. Rasmussen, M. Dellborg, and council on clinical cardiology; the American college of car-
K. Thygesen, “Positional changes of spatial QRS-and ST- diology foundation; and the heart rhythm society. Endorsed
segment variables in normal subjects: implications for con- by the international society for computerized electro-
tinuous vectorcardiography monitoring during myocardial cardiology,” Journal of the American College of Cardiology,
ischemia,” Journal of Electrocardiology, vol. 33, no. 1, vol. 53, no. 11, pp. 976–981, 2009.
pp. 23–30, 2000. [26] D. G. Renlund, G. Gerstenblith, J. L. Fleg, L. C. Becker, and
[12] R. H. Baevsky, M. D. Haber, F. S. Blank, and H. Smithline, E. G. Lakatta, “Interaction between left ventricular end-dia-
“Supine vs semirecumbent and upright 12-lead electrocar- stolic and end-systolic volumes in normal humans,” American
diogram: does change in body position alter the electrocar- Journal of Physiology-Heart and Circulatory Physiology,
diographic interpretation for ischemia?” The American vol. 258, no. 2, pp. H473–H481, 1990.
Journal of Emergency Medicine, vol. 25, no. 7, pp. 753–756, [27] G. C. Williams, K. M. Dunnington, M.-Y. Hu et al., “The
2007. impact of posture on cardiac repolarization: more than heart
[13] J. E. Madias, “Comparability of the standing and supine rate?” Journal of Cardiovascular Electrophysiology, vol. 17,
standard electrocardiograms and standing sitting and supine no. 4, pp. 352–358, 2006.
stress electrocardiograms,” Journal of Electrocardiology, [28] Y. Obata, P. Ruzankin, Q. J. Ong et al., “The impact of posture
vol. 39, no. 2, pp. 142–149, 2006. on the cardiac depolarization and repolarization phases of the8 Cardiology Research and Practice
QT interval in healthy subjects,” Journal of Electrocardiology,
vol. 50, no. 5, pp. 640–645, 2017.
[29] A. Yamada, J. Hayano, K. Horie et al., “Regulation of QT
interval during postural transitory changes in heart rate in
normal subjects,” The American Journal of Cardiology, vol. 71,
no. 11, pp. 996–998, 1993.You can also read