Reducing the MRI outpatient waiting list through a capacity and demand time series improvement programme
←
→
Page content transcription
If your browser does not render page correctly, please read the page content below
article

         Reducing the MRI
       outpatient waiting list
      through a capacity and
        demand time series
     improvement programme
                 Heera Bhullar, Bernadette County, Stuart Barnard,
                         Anne Anderson, Mary E Seddon

                                            ABSTRACT
INTRODUCTION: A capacity and demand improvement initiative commenced in January 2019 with the
goal of reducing the growing outpatient waiting list for magnetic resonance imaging (MRI) at Counties
Manukau District Health Board (CMDHB). Initial work showed that the capacity (MRI machines and staff)
actually outstripped demand, which challenged pre-existing assumptions. This became the basis for
interventions to improve efficiency in the department. Interventions undertaken can be split into three
distinct categories: (1) matching capacity to demand, (2) waiting list segmentation and (3) redesigning
operational systems.
METHODS: A capacity and demand time series during 2019 and 2020 was used as the basis for improving
waiting list and operational systems. A combination of the Model for Improvement and Lean principles
were used to embed operational improvements. Multiple small tests of change were implemented to
various aspects of the MRI waiting list process. Staff engagement was central to the success of the quality
improvement (QI) initiatives. The radiological information system (RIS) provided the bulk of the data, and
this was supplemented with manual data collection.
RESULTS: The number of people waiting for an MRI scan decreased from 1,954 at the start of the project to
413 at its conclusion—an overall reduction of 75%. Moreover, the average waiting time reduced from 96.4
days to 23.1. Achieving the Ministry of Health’s (MoH) Priority 2 (P2) target increased from 23% to 87.5%.
CONCLUSION: A partnership between Ko Awatea and the radiology department at CMDHB, examining
capacity and demand for MRI and using multiple QI techniques, successfully and sustainably reduced the
MRI waiting list over a two-year period. The innovative solutions to match capacity to demand may be
instructive for other radiology departments, and other waiting list scenarios.

I
    n 2018 an additional magnetic res-                 the Ministry of Health (MoH) Priority 2
    onance imaging (MRI) machine was                   (P2) target. The perception was that a lack
    purchased, bringing the Counties                   of medical radiology technicians (MRTs)
Manukau District Health Board (CMDHB)                  was the significant factor preventing the
total to three. This increase in physical              department from meeting demand.
capacity had not reduced the waiting list as             In December 2018 the radiology
expected and, despite outsourcing 60 scans             department requested assistance from Ko
per week to private providers, the back-               Awatea (CMDHB’s centre for innovation and
log and waiting times for MRI scans were               improvement) to improve the performance
increasing.                                            of the MRI service, particularly to reduce the
 At the start of the project, 1,954 patients           waiting list.
were on the waiting list, and only 23% had               Stakeholders agreed that a demand
MRI scans performed within six weeks—                  and capacity study would be undertaken

                                                  27
                                                                                      NZMJ 25 June 2021, Vol 134 No 1537
                                                                                      ISSN 1175-8716       © NZMA
                                                                                      www.nzma.org.nz/journal
article
to identify and realise opportunities to • Average waiting time (measured
increase activity. monthly).
• Scanning hours utilised per week.
Method It was important to measure demand,
Staff engagement capacity, backlog and activity in the same
All staff groups involved with the MRI units for the same period of time, and to have
process participated in its improvement (ie, clear definitions of key metrics (Figure 1).
clerical booking staff, nursing, MRTs and
radiologists). Regular meetings were held
Figure 1: Definitions of terms.3
with staff groups, both separately and collec-
tively, to identify perceived roadblocks; from 1. Demand: What the service is being asked
this a framework for improvement was to do
developed. Meetings continued regularly:
2. Capacity: What the service could be doing
mapping progress, identifying issues and
with its resources used optimally
defining action plans.
3. Activity: What the service actually did
This initiative used Lean tools1 and the
4. Backlog: What the service should have
Model for Improvement. Lean aims to
2
reduce waste in a system; waste is defined done but haven’t
as anything that does not add value (eg,
waiting for a test). These tools were used
in several ways to: value-stream map the 3. What changes can we make?
process, observe how the system actually All improvement requires change and
worked and listen and work with front-line being specific about the primary drivers
staff. The Model for Improvement uses in managing the MRI waiting list was
small tests of change: Plan-Do-Study-Act important. Change interventions (Figure 2)
(PDSA) cycles to rapidly trial different ways can be split into three distinct categories:
of working. 1. matching capacity to demand
The Model for Improvement asks three 2. waiting list segmentation
crucial questions that guided the overall
3. redesigning the operational systems.
initiative:
Interventions were trialled in small tests
1. What are we trying to achieve?
of change (PDSA cycles) in each of the three
The aim of this study was to optimise areas.
the available capacity to better match MRI
outpatient demand, reduce the waiting Matching capacity to demand
list to less than 500 and meet the MoH’s P2 The first action was to establish the rela-
national target of 85% of scans completed tionship between departmental capacity
within six weeks. (equipment and staff), incoming demand
(referrals) and activity (completed and
2. How will we know that a change is an
reported scans).
improvement?
Demand and activity data were generated
Not all change produces improvement—
through the radiology information system
this question requires the definition of
(RIS) reports, which displayed the number
measures to confirm improvement:
and types of scans being referred and
• Number of people on the waiting list completed in chronological order. As the
(measured every Tuesday). reports did not record the time each scan
• Number of patients waiting in each took, this was added manually.
segment (180 days). 24 hours per day), the productive output was
• P2 compliance rate—percentage also dependent on the availability of MRTs.
of patients scanned within 42 days Capacity data, in the form of staffing rosters
from the date of referral (measured by scanner, were translated into available
weekly). daily staffing hours.
28
NZMJ 25 June 2021, Vol 134 No 1537
ISSN 1175-8716 © NZMA
www.nzma.org.nz/journalarticle
In reviewing this capacity and demand tions, each machine was staffed with two
information, it became clear that there was MRTs. When the new machine arrived and
sufficient capacity to meet demand (Figure co-located with the one in the department,
3). In fact, the daily available capacity of this staffing model continued until the
staff was greater than incoming demand by staff identified that we could test a ‘2+1
2.5–3 times. model’. This utilised one MRT per scanner
Demand was outstripping activity, even and a ‘floating MRT’ shared between two
though it was not exceeding the actual rooms, with the focus of ensuring an
capacity of the unit. Understanding this efficient flow of patients. This minimised
became the basis for interventions to the non-scanning dwell time between
increase activity and reduce the waiting list. patients, as the floating MRT could ensure
upcoming patients were prepped and ready
Demand fluctuated throughout the week,
to be scanned as previous diagnostic tests
with Mondays and Fridays being the busiest.
concluded.
The MRT roster was unbalanced and not
matched to demand; many part-time MRTs A patient care assistant (PCA) was also
were not rostered on Mondays or Fridays, added to the staffing roster—this role was
resulting in more MRT capacity than tasked to assist with paperwork, completing
scanner availability midweek, and insuf- patient consenting checklists and assisting
ficient capacity to run the scanners on the MRTs in getting patients in and out of the
busiest days (Figure 4). scanning room. The efficiency of the stand-
alone scanner increased from a nadir of less
The 80th percentile of the variation in
than 20% to over 99% (Figure 5).
the number of hours of incoming demand
was chosen to be the minimum number of Scanning list segmentation
hours that were required. This meant that a Initial work aimed to decrease the
minimum of 18.5 MRT-hours per day (over downtime between scans by grouping scans
the three machines) would be required of the same body part (eg, head, shoulder),
every weekday to meet demand. Staff were avoiding the need to change MRI coils
rostered to be more evenly spread across the between scans and allowing more scans to
working week to ensure that each scanner be completed in a list.
was fully operational within working hours. Patients with excessive waiting times
Historical staffing patterns for each MRI could be grouped into five main groups
machine were also reviewed. When there (Figure 6). The average waiting time for this
were two MRI machines in different loca- type of patient was close to 300 days.
Figure 2: Driver diagram for MRI optimisation.
29
NZMJ 25 June 2021, Vol 134 No 1537
ISSN 1175-8716 © NZMA
www.nzma.org.nz/journalarticle
Figure 3: Demand and capacity measures over six months.
Figure 4: Capacity and demand in cumulative hours by weekday.
Figure 5: Standalone MRI (Building 58) utilisation.
30
NZMJ 25 June 2021, Vol 134 No 1537
ISSN 1175-8716 © NZMA
www.nzma.org.nz/journalarticle
This knowledge enabled such patients duration scans in addition to the oldest on
to be booked onto specific segmented lists. the waiting list. This extracted better value
Patients requiring sedation or general from the contractual arrangement. The
anaesthetic were scheduled together to outsourcing contract was decreased from 60
enable the anaesthetic workforce to be used scans per week to 15 in July 2019 as part of
efficiently. Likewise, patients requiring the DHB cost-saving initiatives.
same interpreter language were grouped
Redesigning MRI operational
and scanned in the same list. The system
now has alerts to notify schedulers if certain
systems
A series of interventions targeted oper-
patients are being held up due to one of
ational processes, enabling more efficient
these characteristics.
processes.
In March 2019, the service introduced
The first intervention was to modify the
late weekday sessions, increasing scanning
referral vetting process that was creating
by two hours per day. At the same time,
a bottleneck to workflow. This process was
weekend sessions were started. Weekend
manual, completed by two senior medical
sessions prioritised those patients who had
officers (SMOs) and utilised significant
been waiting the longest. Pending scans
administrative staff time (printing elec-
over 180 days were targeted as a priority,
tronic referrals for SMOs and scanning
with cascading importance being placed on
referrals back into the RIS once vetting was
subsequent bandings. The waiting list was
completed). Referrals that could be vetted
also segmented to utilise scanners before
by the Grade MRT were identified. The
radiologists started work. Unsupervised
SMOs’ workload was reduced by redirecting
scans were booked at the beginning and end
lower-complexity scans while enabling
of each day in one-hour blocks, enabling full
the Grade MRT to perform at an expanded
utilisation of MRT capacity.
scope. Furthermore, the Grade MRT used
As outsourced scans were performed the electronic system to vet referrals,
at a flat-rate fee by private providers, speeding up the process; this encouraged
the decision matrix for outsourcing was the SMOs to vet electronically, which in
amended to more equally distribute longer
Figure 6: Waiting list segmentation.
31
NZMJ 25 June 2021, Vol 134 No 1537
ISSN 1175-8716 © NZMA
www.nzma.org.nz/journalarticle
turn reduced the workload for adminis- number of cancellations and changes to
trative staff. patient bookings.
Another operational reform refined the
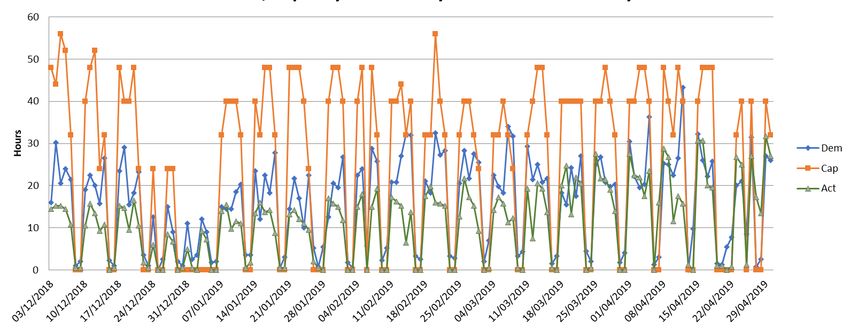
booking template that dictated the duration Results
of scanning appointments. The original The waiting list decreased from 1,954
template was provided by the MRI vendor. in January 2019 to 413 in November 2020
However, over time, clinical protocols had (Figure7), and the target compliance for P2
been updated, as had regional and colle- scans increased from 23% to 87.5%, close to
giate standards, and these updates were not the MoH’s 90% target.
reflected in the booking template. A revised
Within the overall backlog reduction,
template that accurately reflected up-to-date
significant improvements have been made
standard scanning times was introduced,
in the number of patients waiting in excess
allowing the scheduler to accurately book
of 42 days (Figure 8). At the commencement
based on scan duration times. This resulted
of the project, 1,312 patients had waited
in efficient booking practices.
over 42 days; by the end there were 48, and
The allocation of SMOs to MRI sessions the whole waiting list shifted to the left. The
was also changed. Initially, when SMOs most dramatic reduction was in the longest
were allocated to work in MRI, the admin- wait category, with 204 patients waiting
istrative team booked patients according more than 180 days for a scan at the start of
to the sub-specialty interest of the SMO (eg, the study, and zero by the end.
head and neck patients). This created issues
Associated with this change, patients
if the SMO was unable to do the session,
received MRI scans in a timely manner, with
resulting in patients being postponed and
73 days being removed from the average
re-booked and wasted scanning capacity.
waiting time. Simultaneously, scanning
Instead, a patient-focused template was
hours per week more than doubled (55.38 to
developed enabling sessions to be allocated
136.50)—see Table 1.
by patient referral requirement, and SMOs
were rostered to cover the sessions. This
allowed the roster co-ordinator to allocate Discussion
an alternate SMO should the allocated SMO At the start of this study, the radiology
be unavailable. This markedly reduced the department had a limited understanding
Figure 7: Number of patients on waiting list, January 2019–November 2020.
Number of Patients on Outpatient MRI Waiting List Jan 2019 - Nov 2020
2000
MRT Strikes MRT Strikes COVID-19
1800
begin. end. Lockdowns
begin.
1600
Reduction in
1400 outsourcing numbers
Number of Patients
1200
1000
800
600
400
200
0
Date
Number on WL Median
32
NZMJ 25 June 2021, Vol 134 No 1537
ISSN 1175-8716 © NZMA
www.nzma.org.nz/journalarticle
of their capacity and demand for MRI. referrals electronically released SMO time
In fact, the department believed more and encouraged SMOs to adopt electronic
resources were required, particularly MRTs, vetting). Likewise, understanding the
to meet the demand. The collaborative characteristics of the long waits enabled
effort between Ko Awatea and the radiology specified lists for those patient groups,
department, through this capacity and reducing the long waiting list tail.
demand study, showed that in fact there was This attention to detail is not common in
sufficient capacity to meet the demand, but waiting list management in New Zealand
that it was not organised optimally. healthcare. However, understanding the
Through nine interventions covering three principles of Lean thinking (eliminating
major areas—matching capacity to demand, waste and increasing value for customers)
list segmentation and redesigning opera- has the potential to improve many waiting
tional systems—the department sustainably lists. Adopting such manufacturing tools is
reduced the number of people waiting for not always appropriate in medicine,4 but
MRI scans (from 1,954 to 413), shortened the radiology is perhaps peculiarly suited to this
average waiting time (from 96 days to 23 production planning model, as it is a series
days) and decreased the number of patients of well-defined technical processes.
with excessively long waits (from 1,312 to New Zealand as a whole has relatively few
48). By-products of this ‘shift to the left’ public MRI machines per head of popu-
were an improvement in the MoH target lation. In Counties Manukau Health, there
for P2 patients (from 23% to >85%) and the are three for a population of 600,000 (~5
exposure of the radiology department to machines per million). It is not clear how
QI methodologies and their enthusiasm to many is optimal; internationally numbers
continue improvement efforts. range from 55 per million in Japan to
The use of data to drive improvement 2.65 in Mexico.5 Given the constrained
challenged several long-standing prac- resources, it is important for New Zealand
tices (eg, MRTs’ expanded scope to vet to be innovative and apply the appropriate
Figure 8: Changes in waiting list numbers by waiting time segments, December 2018 to November 2020.
Table 1: Waiting list descriptive characteristics.
Descriptive stats December 2018 November 2020
Total number of patients on waiting list 1954 413
Average number of days waiting 96.4 23.1
Range of days waiting 0-308 0–170
Scanning hours per week 55.38 136.50
33
NZMJ 25 June 2021, Vol 134 No 1537
ISSN 1175-8716 © NZMA
www.nzma.org.nz/journalarticle
improvement methodologies to optimise demand is generalisable. Most radiology
resources. departments in New Zealand will be facing
A similar approach was used by similar constraints, especially in the face of
Canterbury District Health Board (CDHB)6 the COVID-19 lockdowns.
when they faced increased waiting times A further constraint is that ethnicity
for imaging. Using the principles of Lean, of each patient on the waiting list is not
production planning and constraint theories, captured in the RIS, and it is therefore not
they worked with in-house production possible to comment on any inequity in
planning engineers to improve waiting waiting times. In future it would be bene-
times. In this case, the main constraint ficial to conduct this work through an equity
was limited radiologist hours, which was lens and, if inequity were to be identified, to
improved by rationalising and delegating use patient experience and co-design meth-
some tasks traditionally undertaken by odologies to uncover the reasons for this
radiologists. As in Counties Manukau Health, disparity.
having visibility of the gap between capacity The team faced several constraints that
and demand allowed several improvements threatened the sustainability of improve-
in the process. ments. The first challenge was the impact
A systematic review of the application of of national industrial action that occurred
Lean and Six Sigma (which aims to decrease through the third and fourth quarters of
defects to one in a million) approaches 2019, severely affecting the availability of
in radiology was published in 2016 and MRT staff and directly increasing the waiting
concluded that these methodologies had list. At the same time, the outsourcing
the potential to reduce errors and cost, contract for 60 scans per week was reduced
and improve quality.7 The five studies that to 15 in July 2019, increasing demand. A
looked at reducing waiting times were further compounding factor in 2020 was
not representative of Counties Manukau COVID-19, which significantly reduced the
Health’s situation; starting from a much availability of outpatient scans, particularly
shorter baseline: decreasing the waiting during the first lockdown in April 2020—
time from 25 days to one. A review of MRI consequently the backlog during this period
waiting lists in Canada8 in 2009 noted that increased.
most centres routinely used scanners at the
weekend, but only 3% were utilised on a Conclusion
24/7 basis, and median scanning hours per
Although the original premise for the
week was 93.5, whereas our work increased
long waiting times for MRI was a lack of
this to 136.50.
capacity, this study showed that existing
There are some limitations to this study. It capacity was sufficient, but inefficiently
was neither feasible nor sensible to conduct matched to demand. Acting on detailed
a randomised controlled study as the team data of the causes of this inefficiency and
were examining the whole department employing Lean thinking principles and
and MRI process pathway. Learning and the Model for Improvement methodology,
adjusting hypotheses based on small tests of a number of innovative changes were
change, a central tenet of most QI methods, made in the process of care, leading to a
meant that this was an iterative process with dramatic reduction in waiting times. There
multiple tests—some sequential, some in are lessons for other waiting lists in the
parallel—so it is unclear which initiative had healthcare system, particularly in building
the biggest impact. Therefore, generalising capability in capacity and demand analysis
results to other jurisdictions is not possible. and other QI tools, which will be important
However, the process of understanding a for the New Zealand health system as it
given department’s data on capacity and faces a future of fiscal constriction.
34
NZMJ 25 June 2021, Vol 134 No 1537
ISSN 1175-8716 © NZMA
www.nzma.org.nz/journalarticle
Competing interests:
Nil.
Acknowledgements:
The authoring team would like to acknowledge the co-operation, assistance and involve-
ment from the MRI team at Middlemore Hospital. The staff had a direct positive impact on
the uptake and retention of the improvement initiative resulting in improved patient and
organisational outcomes.
Author information:
Heera Bhullar: Improvement Advisor, Ko Awatea,
Counties Manukau District Health Board, Auckland.
Bernadette County: Portfolio Manager, Ko Awatea,
Counties Manukau District Health Board, Auckland.
Stuart Barnard: Clinical Director of Central Clinical Services,
Counties Manukau District Health Board, Auckland.
Anne Anderson: Service Manager, Radiology,
Counties Manukau District Health Board, Auckland.
Mary E Seddon: Director Ko Awatea,
Counties Manukau District Health Board, Auckland.
Corresponding author:
Dr Mary Seddon, Director Ko Awatea, Middlemore Hospital, Counties Manukau District
Health Board, 100 Hospital Road, Auckland 2025, +64275769669
mary.seddon@middlemore.co.nz
URL:
www.nzma.org.nz/journal-articles/reducing-the-mri-outpatient-waiting-list-through-a-capac-
ity-and-demand-time-series-improvement-programme
REFERENCES
1. Kruskal JB, Reedy A, Pascal improvement-hub/ and Managing Radiologist
L et al. Quality Initiatives. publication/improve- Workload: Application
Lean Approach to Improv- ment-leaders-guide-match- of Lean and Constraint
ing Performance and ing-capacity-and-de- Theories and Production
Efficiency in a Radiology mand-process-and-sys- Planning Principles to Plan-
Department. Radiographics tems-thinking/ ning Radiology Services in
2012; 32 (2): 573-587. Accessed 09/02/21 a Major Tertiary Hospital.
2. The Institute for Healthcare 4. Bahensky JA. Lean sigma – Journal of Medical Imaging
Improvement [Internet]. will it work for healthcare? and Radiation Oncology.
Available from: http:// Journal of Healthcare 2013; 57: 544-550
www.ihi.org/resources/ Information Management 7. Amaratunga A, Dobranows-
Pages/HowtoImprove/ 2005; 19 (1): 39 - 44 ki J. Systematic Review of
ScienceofImprovemen- 5. Statista [Internet]. 2019. the Application of Lean and
tHowtoImprove.aspx Viewed 9th February Six Sigma Quality Improve-
Accessed 09/02/21 2021. Available from: ment Methodologies in
3. NHS Institute for Inno- https://www.statista. Radiology. Journal of the
vation and Improvement com/statistics/282401/ American College of Radiol-
[Internet]. Improvement density-of-magnet- ogy. 2016; 13(9): 1088-1095
Leaders’ Guide – Matching ic-resonance-imag- 8. Emery DJ, Forster AJ,
Capacity and Demand ing-units-by-country/ Shojania KG, Magnan S.
Process and Systems 6. MacDonald SLS, Cowan IA, Management of MRI Wait
Thinking. 2005 https:// Floyd R, et al. Measuring Lists in Canada. Healthcare
www.england.nhs.uk/ Policy. 2009; 4 (3):76-86
35
NZMJ 25 June 2021, Vol 134 No 1537
ISSN 1175-8716 © NZMA
www.nzma.org.nz/journalYou can also read