LABOUR MARKET - Sarnia Lambton Workforce ...
←
→
Page content transcription
If your browser does not render page correctly, please read the page content below

LOCAL
LABOUR
MARKET
P L A N

2020-2021

Table of Contents
Acknowledgments............................................................................................. 1
Data Sources.................................................................................................... 2
Executive Summary........................................................................................... 3
Sarnia Lambton Workforce at a Glance............................................................... 4
Local Population................................................................................................ 6
         Components of Population Change............................................................ 7
         Migration................................................................................................ 8
         Commuting............................................................................................. 8
         Education............................................................................................... 9
         Apprenticeship: Women in Trades ............................................................ 10
         International Student Population............................................................... 10
         Income................................................................................................... 11
Occupation Trends............................................................................................. 13
Local Business Profile......................................................................................... 15
Industry Trends................................................................................................. 18
Labour Force Data............................................................................................. 20
Job Demand...................................................................................................... 21
         Job Posting Trends................................................................................... 21
         EmployerOne Survey Highlights................................................................ 22
         WISL: Work In Sarnia Lambton................................................................. 24
Impact of COVID-19 on the Labour Force............................................................ 26
COVID-19 Community Impact............................................................................. 28
COVID-19 Initiatives.......................................................................................... 29
Employment Ontario Programs........................................................................... 30
Community Consultations................................................................................... 33
2021-2022 Action Plan....................................................................................... 35
Appendix 1: Note on Data Sources...................................................................... 39
Acknowledgments
   The views expressed in this publication are the views of the Sarnia Lambton
 Workforce Development Board and do not necessarily reflect those of the Province.

      The Government of Ontario and its agencies are in no way bound by the
                 recommendations contained in this document.

         Mission
 SLWDB is a diverse and dedicated organization, committed to identifying needs
 and facilitating solutions to attract, train and retain a viable workforce through
                              community partnerships.

          Vision
         Growing Sarnia Lambton’s workforce for tomorrow’s economy.

SLWDB leads Sarnia Lambton in its approach to workforce development and la-
bour market planning. Our team actively engages organizations and community
  partners in local labour market projects. We also conduct consultations with
 business owners throughout the year in order to identify needs and facilitate
                       solutions to grow our local workforce.

        Network
 SLWDB is one of 26 local planning board areas that make up Workforce Planning
Ontario. We are funded through the Ontario Ministry of Labour, Training, and Skills
   Development to conduct and disseminate local labour market research and
    engage community stakeholders in a planning process that supports local
                             solutions to local issues.

                   This project is funded in part by the Government of Canada
                                  and the Government of Ontario

                                                                                      1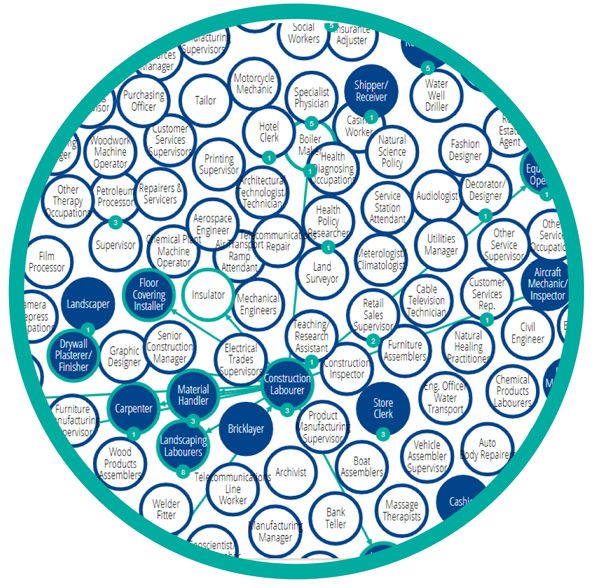
Data Sources
    This report combines data from a variety of sources to provide a relevant picture of the local
    labour market and economic conditions. It is a comprehensive report that is evidence-based and
    community-driven.

    The sources consulted include:

              Canadian                                                          Employment
              Business            Labour Force               Census               Ontario
               Counts                Survey                   Data                 Data

                                                         Focus Groups             WISL:
          Talent Neuron           EmployerOne            & Community              Work in
              Data                Survey Data            Consultations        Sarnia Lambton

    SLWDB makes no representation or warranty, expressed or implied, as to the accuracy or complete-
    ness of the data referenced. In providing this material, SLWDB does not assume any responsibility or
    liability. A note on the restrictions and limitations of the above mentioned data sources can be found
    on page 39.

    We invite your feedback on all publications produced by SLWDB. Additional information can be
    obtained by contacting:

    Mikelle Bryson-Campbell, Interim Executive Director
    Sarnia Lambton Workforce Development Board
    St. Clair Corporate Centre
    265 Front Street North, Suite 504
    Sarnia, Ontario N7T 7X1
    (519) 332-0000
    mikelle.bryson.campbell@slwdb.org

2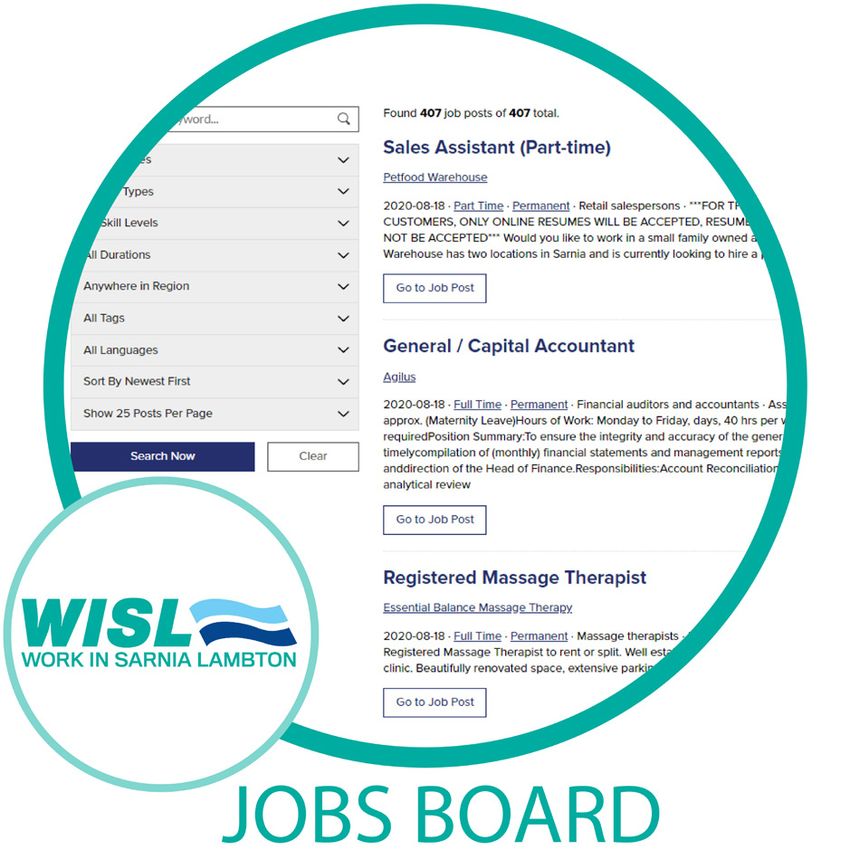
Executive Summary
The Sarnia Lambton Workforce Development Board’s Local Labour Market Plan is a comprehensive
report that seeks to inform the public, job seekers, service providers, and employers on the local la-
bour market. This report brings together our research findings over the last year, including statistical
data and input received through community consultations.

This year we had the added challenge of developing a labour market plan during a time of unprec-
edented change. We hope that the information this report contains will help to direct programming,
economic development and workforce planning for the community. Some key themes have emerged
this year relating to our workforce including: women in skilled trades, the out migration of youth
and how to maintain our workforce needs, the shift in employer needs, connecting newcomers to
employment opportunities, the importance of Employment Ontario services, and the shift to remote
workforces.

A key component of this report is the Action Plan, which can be found on page 35. We hope that
it will serve to engage employers, service providers, job seekers, and other community partners
through enhanced community connections. The strategies outlined will further the conversations
required to identify opportunities and resolve gaps in the current workforce including: retention of
skilled workers, international student recruitment, and navigating the barriers to remote work.

We look forward to continuing the discussion in the coming year.

Warmly,

Mikelle Bryson-Campbell, Interim Executive Director
Sarnia Lambton Workforce Development Board

                                                                                                           3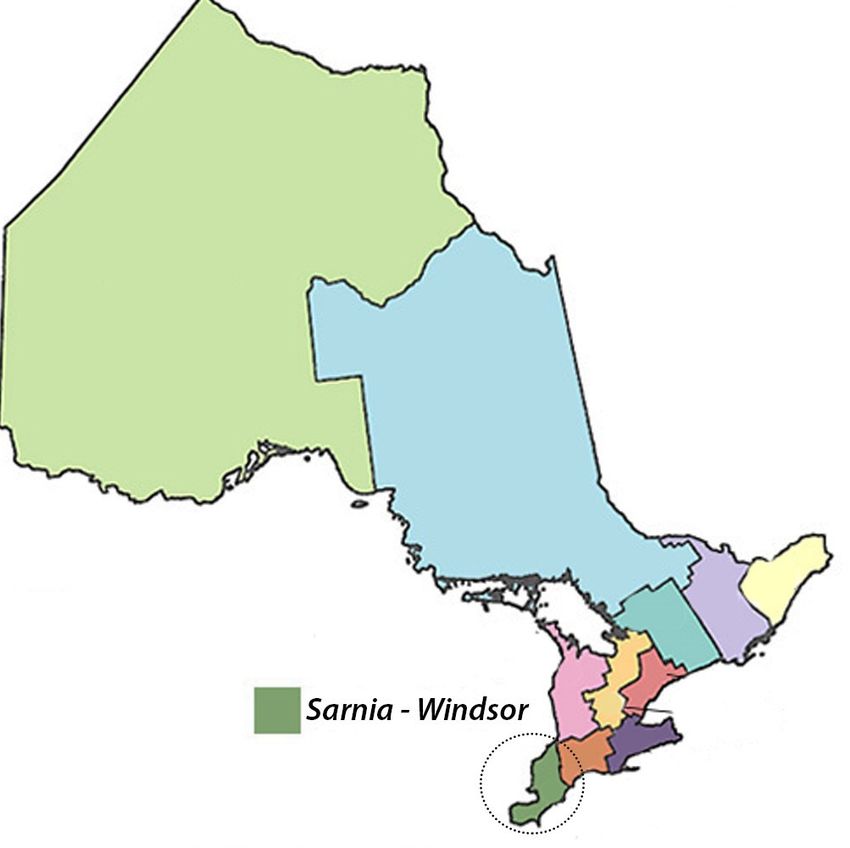
Sarnia Lambton Workforce at a Glance

    Figure 1: Population trends from 2006 to 2019.
         132,539

                    132,283

                                                                                                                                                    132,243
                                132,043

                                           131,722

                                                       131,478

                                                                 131,362

                                                                                                                                          131,236
                                                                           131,064

                                                                                     130,342

                                                                                                  129,936

                                                                                                                                129,794
                                                                                                            129,453

                                                                                                                      129,364
        2006       2007        2008        2009       2010       2011      2012      2013        2014       2015      2016      2017      2018      2019

    Source: Statistics Canada. Table: 17-10-0139-01

    Figure 2: Age and gender                                                                   Figure 3: Local Jobs Board.
    breakdown of Sarnia Lambton
    residents.

                                     Under 19
                                      21%
       55+
       39%
                   Female           Male
                    51%             49%

                                            20-44
                                            29%
                   45-54
                   12%

    Source: Statistics Canada. Table: 17-10-0139-01

    Figure 4: Top industries with the largest workforce sizes.

       Health Care and
       Social Assistance                             Manufacturing
                                                                                               Retail Trade

                               7,670                                    6,495                                 6,490
                               In the                                   In the                                In the            Source: Statistics Canada.
                              workforce                                workforce                             workforce          2016 Census, Custom Table
4                                                                                                                               T29 POR Boards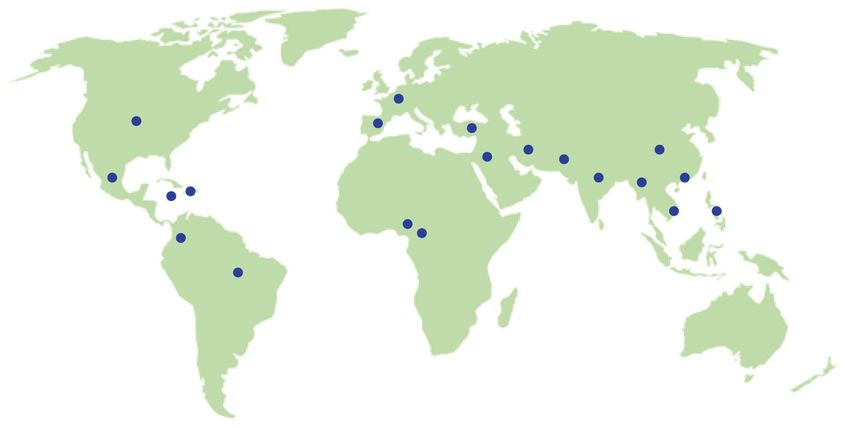
Figure 5: Top occupations with the largest labour force sizes.
          Sales and                     Trades, transport and                   Business, finance
           service                      equipment operators                    and administration
            14,690                               11,225                                 7,300
                                           in the labour force
Source: Statistics Canada. 2016 Census, Custom Table T19 POR Boards CD

                                                                                                11,050

   2019 Population Estimates
                                                                             1,056

                                   2,038
                                                                                      3,924

                                                                     8,393

                         74,779

                                  667                        6,010

                                                                                              2,391
                                                 2,794

                                                                 667

                         14,755
                                                               2,122

                                                                                     Total Population
                                                                                         132,243
                 1,629

Source: Statistics Canada. Table 17-10-0142-01 Population estimates, July 1, by census subdivision, 2016
boundaries                                                                                                 5
Source: Image modified from: WISL: Work In Sarnia Lambton - www.slwdb.org/wisl/map/
Local Population
    With a population of 132,243 people, Lambton County is located at the southern point of Lake Huron.
    The landscape is both urban and rural with 11 municipalities and three First Nations communities
    within the county. The average age of the local population is 44 years of age, compared to the On-
    tario average of 40 years. Those who identify as female account for 51% of the population, with the
    other 49% identifying as male. The area has an aging population, with the largest percentage of
    residents, 72%, being between the ages of 45 to 74 years of age. The local workforce is employed
    predominantly in Sales and service occupations, Trades, transport and equipment operators and re-
    lated occupations, and Business, finance and administration occupations.

    Figure 6: Age and gender breakdown of Sarnia Lambton Population
                                                                             Male      Male
                                                                                      Female    Female
                                                                                                 Male     Female

                             85+           85+          85+                         1.2%0.9%
                                                                             1.2%0.9%      1.2%0.9%

                       7 5 T O 8 47 5 T O 8 47 5 T O 8 4               3.4%     3.4% 2.9%
                                                                                        3.4% 2.9%            2.9%

                       6 5 T O 7 46 5 T O 7 46 5 T O 7 4       6.3%     6.3%         6.3%       6.0%      6.0%       6.0%

                       5 5 T O 6 45 5 T O 6 45 5 T O 6 8.6%      8.6%                                           8.0%
                              AGE GROUPS

                                                       4                      8.6%                    8.0%                 8.0%
          AGE GROUPS

                                           AGE GROUPS

                       4 5 T O 5 44 5 T O 5 44 5 T O 5 4      6.9%     6.9%         6.9%         6.5%        6.5%      6.5%

                       3 5 T O 4 43 5 T O 4 43 5 T O 4 4        5.5%         5.5%     5.5%     5.4%      5.4%       5.4%

                       2 5 T O 3 42 5 T O 3 42 5 T O 3 4        5.6%     5.6%         5.6%     5.7%      5.7%       5.7%

                       1 5 T O 2 41 5 T O 2 41 5 T O 2 4        5.6%     5.6%         5.6%     5.9%      5.9%       5.9%

                        0 T O 1 4 0 T O 1 4 0 T O 1 4 7.7%            7.7%     7.7%                   8.0%      8.0%       8.0%
                                                                     % OFLAMBTON
                                                              % OF SARNIA SARNIA
                                                                            % OFLAMBTON  POPULATION
                                                                                 POPULATION
                                                                                 SARNIA LAMBTON POPULATION
    Source: Statistics Canada. 2016 Census, Custom Table T1 POR Boards CD

    Table 1: Number of persons in the labour force by occupation
                                                                                                                              Number of persons
    Occupations
                                                                                                                              in the labour force
    6   Sales and service occupations                                                                                                     14,690
    7   Trades, transport and equipment operators and related occupations                                                                 11,225
    1   Business, finance and administration occupations                                                                                   7,300
    0   Management occupations                                                                                                             6,130
    4   Occupations in education, law and social, community and gov't services                                                             5,870
    3   Health occupations                                                                                                                 4,640
    2   Natural and applied sciences and related occupations                                                                               3,940
    9   Occupations in manufacturing and utilities                                                                                         3,485
    8   Natural resources, agriculture and related production occupations                                                                  1,675
    5   Occupations in art, culture, recreation and sport                                                                                  1,070
    Source: Statistics Canada. 2016 Census, Custom Table T19 POR Boards CD
6
Local Population Continued...
There are three First Nations communities residing in Lambton County, including Aamjiwnaang First
Nations, Kettle and Stony Point First Nations, and Walpole Island First Nations. There are approxi-
mately 4,607 registered First Nation community members living on reserve in the area, while 5,372
members live off reserve.

Table 2: Indigenous population in Sarnia Lambton living on and off reserve.
                                           Aamjiwnaang Kettle and Stony Point Walpole Island
2016 Census population                         630              1,000             1,585
Registered population                         2,474             2,548             4,957
   Living on own reserve                       896              1,354             2,357
   Not living on own reserve                  1,578             1,194             2,600
Median age                                   38 years          46 years          38 years
Sources: Government of Canada. Indigenous and Northern Affairs, First Nation Profile as of July 2020.

Components of Population Change
According to Statistics Canada Census data, factors that in-
fluence changes in the population of Sarnia Lambton include:                 1,249                  1,524
births, deaths, immigration and emigration. There were                      BIRTHS                 DEATHS
1,249 births in Sarnia Lambton for the reference period of
2018/2019. Population projections from the Ontario Ministry
of Finance indicate that Lambton’s population is expected to
increase to 133,300 by 2021 and 134,700 by 2026.1 Despite
the increasing population for Lambton, an open session re-
                                                                             186                 174
port by the Planning and Building Department (March 2018)
                                                                         IMMIGRANTS           EMIGRANTS
estimated that the City of Sarnia’s population will continue to
decline over the next decade. As of November 25, 2020 there
were 25 deaths locally directly attributed to COVID-19 by the
Lambton Public Health Unit.
                                                                                                  73
There were 186 peoples immigrating to the Sarnia Lambton                                      RETURNING
area with 73 of those being returning emigrants who had
                                                                                              EMIGRANTS
previously left the area. There was a total of 174 emigrants
during the 2018/2019 period. Statistics Canada defines emi-
                                                                        Sources: Statistics Canada. Table 17-
grants as Canadian citizens or immigrants who left Canada for
                                                                        10-0140-01 Components of population
a period of time.                                                       change by census division, 2016 bound-
                                                                        aries

1
    Source: Statistics Canada estimates, 2011-2019, and Ontario Ministry of Finance projections.

                                                                                                                 7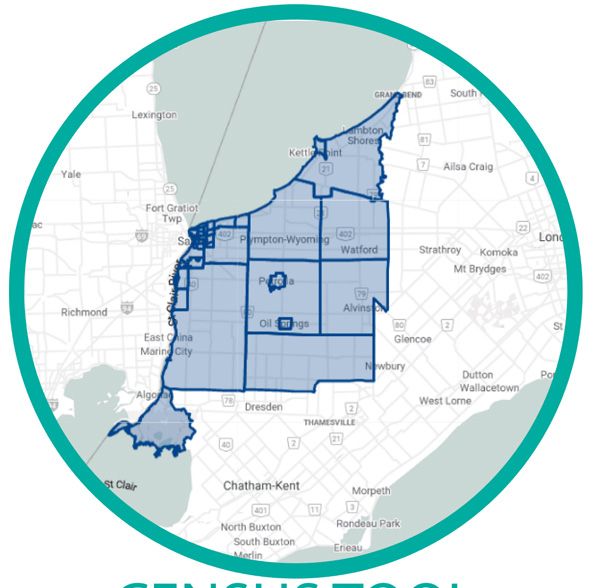
Migration
    Within the timeframe spanning between 2013 and 2018, roughly 17,108 persons migrated to the
    area, while 16,191 left the Sarnia Lambton area. The age groups migrating to the area include those
    between 45-64 years of age, while the age groups with the largest number of persons leaving the
    area include young adults between 18-24 years of age. Working age adults, aged 25-44 accounted
    for 29% of those migrating out between 2013 and 2018.

    Due to the nature of the aging population, it can be expected that the Health Care industry and
    health care-related occupations will continue to increase in importance and size, while the overall
    working age population is expected to decrease. In order to compensate for the decrease in working
    age adults, immigrants and migrant workers to our area will be important to sustain the local work-
    force.

    Table 3: In and out migration characteristics between 2013 and 2018
                                    Migration Characteristics
                                           2013 - 2018
          Age Group             In-migrants          Out-migrants Net-migrants
          0-17                     3,446                 2,585        861
          18-24                    2,094                 2,837        -743
          25-44                    5,565                 5,866        -301
          45-64                    3,946                 2,843       1,103
          65+                      2,057                 2,060         -3
          Total                    17,108               16,191        917
    Source: Statistics Canada, 2018 Taxfiler

    Commuting
    With both urban and rural communities across Sarnia Lambton, the median commuting duration is
    approximately 15 minutes. According to the 2016 Census, the main mode of transportation used by
    42,045 residents to travel between their home and place of work was by vehicle, while 2,175 walked,
    and 1,025 used public transportation. The commute times are relatively low for the area, however,
    persons who reside in rural areas of Lambton County typically commute outside of their community
    to go to their place of work.

    Figure 7: Modes of transportation for Sarnia Lambton residents.

    Driving personal       Passenger in a           Walk                 Bus               Bicycle
         vehicle              vehicle
         39,400                2,645               2,175                1,025               520

    Source: Statistics Canada. 2016 Census, Custom Table T28 POR Boards CD
8
Education
The education levels of the Sarnia Lambton population align with the occupations and industries with
the largest workforce sizes. Of those in the labour force, 90% of residents have some form of certif-
icate, diploma or degree. Secondary school graduates account for 28% of those in the labour force,
college graduates comprise 34%, and persons with a university diploma or degree make up 17% of
those in the labour force. The Sarnia Lambton area has seen an increase in those holding a college
certificate, diploma, or degree between 2011 and 2016, with a decrease in those with secondary
school certificates.
Of the 56,485 persons employed during the 2016 Census, 35% had a college level education, 28%
had a secondary school level education, and 18% had a university level education. Only 9% of those
employed had no form of formal education. The education levels with the highest rate of unemploy-
ment include those without formal education (14.8%) and those with a secondary diploma as their
highest level of education (9.8%). Those who had education in Apprenticeship accounted for 11%
of those employed in 2016, with an unemployment rate of 7.4%.
Figure 8: Changes in educational attainment levels from 2011 to 2016
2011 2016
Degree in medicine, dentistry, veterinary medicine or optometry 285
280
Earned doctorate 190
190
University certificate, diploma or degree 10,260
10,745
College, CEGEP or other non-university certificate or diploma 18,595
20,830
Apprenticeship or trades certificate or diploma 7,140
6,500
Secondary (high) school diploma or equivalency certificate 19,990
17,510
No certificate, diploma or degree 6,165
5,875
Source: Statistics Canada. 2016 Census, Custom Table T3 POR Boards CD
Statistics Canada. 2011 Census, Custom Table T3
According to the results of the 2020 EmployerOne Survey findings, employers ex-
perience hiring challenges due to skills gaps and hard-to-fill positions that exist due
to a lack in qualifications of potential candidates. SLWDB addresses skills gaps in
the community by providing interactive sessions and supports to both employers
and job seekers. Find out how SLWDB plans to address skills gaps on page 37.
9Apprenticeship: Women in Trades
The number of people with apprenticeship or trades certificates decreased between 2011 and 2016.
SLWDB’s previous research on the in demand skilled trades identified a lack of female representa-
tion in the skilled trades, an assertion supported by local statistics. Of the 11,075 persons with a
trade certificate or in an apprenticeship only 2,155 are female.2 Local job demand data reflects the
dire need for skilled trades people locally. Jobs in the skilled trades remain posted to job boards for
several months at a time.3 To bridge this supply and demand gap recruitment of men and women in
the skilled trades must be a priority. This sentiment is best highlighted by participants in our skilled
trade research who said:
“ inWethisespecially need more women
trade. There are literally no
” “ You used to see ads for the trades
to get more women in the trades
”
women in the trades. but I don’t see anything anymore.
- Local Employer - Local Employer
International student population
In fall 2020, 667 international students began their studies at Lambton College, 98% of whom were
enrolled in full-time studies. Of those enrolled, 50% were male and 50% were female. In total, 23%
were studying at the diploma level and 76% were studying at the post-graduate level. This suggests
that the majority of international students had already completed a degree before arriving in Canada.
Students have come from 20 different countries, but the vast majority are from the Indian subconti-
nent (India, Nepal and Sri Lanka).
The list of countries includes:
• Belgium
• Brazil Figure 9: Data points of countries recruited from.
• Cameroon
• China
• Colombia
• Dominican Republic
• Hong Kong
• India
• Iran
• Jamaica
• Jordan
• Mexico
• Myanmar
• Nigeria
• Pakistan
• Philippines
• Spain
• Turkey
• USA
• Vietnam
2
Source: Statistics Canada, Apprenticeship Data 2016
10 3
Source: WISL Data collected October 2020; Talent Neuron Data collected September 2020Income
The average net employment income in Sarnia Lambton is $69,298 (Table 4), which is slightly above
the Ontario average net income of $68,628. For Lambton County the average income is slightly
higher at $73,776. Single person average annual household income was $38,902, Whereas a two-or-
more person households in 2016 was $88,468.4
Since the 2016 Census, the minimum wage an employer is responsible for paying an employee in
Ontario increased from $11.60 per hour between October 1, 2017 to December 31, 2017 to $14.00
per hour between January 1, 2018 to September 30, 2020. Recently, an additional increase was es-
tablished on October 1, 2020 to September 30, 2021 to a minimum wage of $14.25 per hour.5
For more information on the changes to Minimum Wage rates in Ontario, visit https://www.ontario.
ca/document/your-guide-employment-standards-act-0/minimum-wage
Table 4: Average employment income for Sarnia Lambton residents
Total Male Female
Number of persons in the workforce (2016) 31,530 18,260 13,265
Average net employment income $ 69,298 81,887 51,967
Source: Statistics Canada. 2016 Census, Custom Table T15 POR Boards CD
Figure 10: Average income related to highest level of educational attainment
Degree in medicine, dentistry, veterinary medicine or optometry $174,353
Earned doctorate $120,885
University certificate, diploma or degree $95,284
College, CEGEP or other non-university certificate or diploma $68,400
Apprenticeship or trades certificate or diploma $86,304
Secondary (high) school diploma or equivalency certificate $48,947
No certificate, diploma or degree $42,387
Source: Statistics Canada. 2016 Census, Custom Table T15 POR Boards CD
4
Source: Census Profile, Lambton County, 2016 Census
11
5
Source: Government of Ontario, Employment Standards Act, Updated October 2020Income Continued...
Occupations with the highest average annual income based on 2016 Census data. These include
Natural and applied sciences and related occupations, Occupations in manufacturing and utilities, as
well as Management occupations (Figure 11). Occupations with the largest workforce sizes include
Trades, transport and equipment operators and related occupations with 6,115 workers, Sales and
service occupations with 5,125 workers, and Management occupations with 4,570 workers (Table 5).
Figure 11: Changes in average annual income by occupation in 2011 vs 2016
2011 2016
9 Occupations in manufacturing and $43,538
utilities $96,832
8 Natural resources, agriculture and $27,830
related production occupations $48,877
7 Trades, transport and equipment $47,068
operators and related occupations $70,806
$37,206
6 Sales and service occupations
$39,710
5 Occupations in art, culture, recreation $41,721
and sport $41,767
4 Occupations in education, law and $62,142
social, community and gov't services $70,884
$57,932
3 Health occupations
$68,908
2 Natural and applied sciences and $73,030
related occupations $104,065
1 Business, finance and administration $48,470
occupations $61,126
$59,217
0 Management occupations
$77,100
$51,209
Total - Occupation
$69,298
Source: Statistics Canada. 2016 Census, Custom Table T15 POR Boards CD
12Occupation Trends
In 2016, there were approximately 60,000 persons in the labour force. The top occupations with the
largest labour force sizes in the Sarnia Lambton area include Sales and service, Trades, transport
and equipment operators, and Business, finance and administrative occupations. The number of per-
sons working in each occupation decreased from 2011 to 2016, and the Management occupations
and Occupations in education, law and social, community and government services had the largest
decrease.
Of those in the labour force, 31,530 persons in Sarnia Lambton were working in 2016, with the top
occupations by workforce sizes being Management, Business, finance and administration, and Nat-
ural and applied sciences and related occupations (Table 5). Although Natural and applied sciences
and related occupations had a decrease in the number of persons working between 2011 and 2016,
the proportion of the workforce employed in those occupations grew by 2% (Figure 12).
Through consultations with employers, the top occupations identified as continually hard-to-fill in-
clude those in the Health care, Business, finance and administration occupations, Education, law and
social, community and Government services. Positions were hard to fill due to the lack of qualified
workers in the Sarnia Lambton area, and retention was a challenge as wages for these professions
were competitive amongst businesses within the industry.
Due to the impacts of COVID-19 and the large number of layoffs caused by the economic shutdown,
employers expect that there will be an increase in the number of qualified and skilled candidates in
the near future. Services such as the Second Career program have experienced an increase in pro-
gram usage due to an increase in job seekers looking to re-train or re-skill in order to be competitive
as they re-enter the workforce. More information on the Second Career program can be found on
page 31.
Table 5: Number of persons working in each occupation in 2011 vs 2016
Number of Number of
persons persons
National Occupational Classification (NOC) 2011 and 2016
working working
2011 2016
Total - Occupation - National Occupational Classification (NOC) 2011 58,450 31,530
0 Management occupations 8,885 4,570
1 Business, finance and administration occupations 10,620 4,275
2 Natural and applied sciences and related occupations 3,870 2,695
3 Health occupations 3,310 2,345
4 Occupations in education, law and social, community and gov't services 6,995 3,260
5 Occupations in art, culture, recreation and sport 720 335
6 Sales and service occupations 9,200 5,125
7 Trades, transport and equipment operators and related occupations 10,495 6,115
8 Natural resources, agriculture and related production occupations 805 520
9 Occupations in manufacturing and utilities 3,550 2,300
Source: Statistics Canada. 2016 Census, Custom Table T15 POR Boards CD
13Occupation Trends Continued...
In comparison with Ontario, the Sarnia Lambton area has a significantly higher proportion of people
working in the trades, transport and equipment operator related occupations. Figure 12 shows the
percentage of the workforce in trades related occupations in Ontario is 14%, compared to Sarnia
Lambton where the proportion of trades related workers accounts for 19% of the workforce. The
skilled trades are comprised of both union and non-union businesses, with 15 local unions repre-
sented in Sarnia Lambton.6
Table 6: Population of workforce by occupation as a percentage of the total
workforce
2011 2016
Ontario Lambton Ontario Lambton
Management occupations 15% 16% 15% 14%
Business, finance and administration occupations 19% 15% 18% 14%
Natural and applied sciences and related occupations 9% 7% 9% 9%
Health occupations 6% 7% 6% 7%
Education, law and social, community and gov't services 12% 10% 12% 10%
Occupations in art, culture, recreation and sport 2% 1% 2% 1%
Sales and service occupations 17% 18% 16% 16%
Trades, transport and equipment operators and related occupations 13% 18% 14% 19%
Natural resources, agriculture and related production occupations 1% 2% 1% 2%
Occupations in manufacturing and utilities 6% 7% 6% 7%
Source: Statistics Canada. 2016 Census, Custom Table T15 POR Boards CD
Figure 12: Number of persons working by occupation in Ontario vs Lambton, 2016
Ontario Lambton
Management occupations 15%
14%
Business, finance and administration occupations 18%
14%
Natural and applied sciences and related occupations 9%
9%
Health occupations 6%
7%
Education, law and social, community and gov't services 12%
10%
Occupations in art, culture, recreation and sport 2%
1%
16%
Sales and service occupations 16%
14%
Trades, transport and equipment operators and related occupations 19%
1%
Natural resources, agriculture and related production occupations 2%
Occupations in manufacturing and utilities 6%
7%
Source: Statistics Canada. 2016 Census, Custom Table T15 POR Boards CD
6
Source: Sarnia Construction Association Membership and Trade Directory 2019/2020
14Local Business Profile
There were approximately 10,533 businesses in Sarnia Lambton in June 2020, compared to the
11,113 businesses in June of 2016. Approximately 98% of businesses are considered small business-
es while micro businesses with 1-4 employees account for 46% of businesses that have employees.
Over 67% of the total businesses are those without employees meaning they are owned and oper-
ated by the business owner, also referred to as sole proprietors, and do not retain any employees on
payroll (Figure 14).
Industries with the largest increase in business counts both with and without employees between
2016 and 2020 include Real estate, Securities, commodity contracts, and other financial investment
and related activities, as well as Religious, grant-making, civic and professional and similar organi-
zations. Meanwhile, business counts that have been subject to decreases include those in the Man-
agement of companies and enterprises, Animal production and aquaculture, as well as Professional,
scientific and technical service industries.
Through community consultations, we found that due to COVID-19, some businesses are now adapt-
ing to the digital requirements accompanied with the changing workforce. Some of the adaptations
that businesses are now pursuing include the shift to implementing e-commerce into their oper-
ations, curb-side pickup and delivery services, virtual services, and having employees work from
home. More work needs to be done to assess how the physical landscape of business has shifted
since the pandemic. These adaptations have posed some challenges which are discussed in the Com-
munity Consultations section on page 33, however, the businesses that were able to adapt during the
pandemic were most successful throughout the pandemic.
Figure 13: Business breakdown
Throughout COVID-19, local initiatives were put in place to
support local and small businesses. Through community con-
10,533
Source: Business Counts, June 2020.
sultations conducted between April and November, businesses
expressed their gratitude to the amount of local support pro- Businesses in
vided by residents in Sarnia Lambton. Community groups and Sarnia Lambton
businesses collaborated and partnered to support one another
through the pandemic, with some pivoting their product or 7,086
service offerings to accommodate the changes in consumer Without
demands. Employees
Figure 14: Business counts by employee size range, 2016 3,447
With Employees
1,585
Businesses 737
Businesses 576 351
Businesses Businesses 118
Businesses 44
Businesses 23
13
Businesses
Businesses
1-4 5-9 10-19 20-49 50-99 100-199 200-499 500+
Number of Employees
Source: Business Counts, June 2020. 15Business Increases
Table 7: Business increases by business size range
Top 5 Overall Business Increases 2016 2020 Change
621 - Ambulatory health care services 490 782 292
238 - Specialty trade contractors 583 831 248
531 - Real estate 1,504 1,702 198
813 - Religious, grant-making, civic, and professional and similar organizations 210 401 191
722 - Food services and drinking places 317 505 188
Top 3 increase in businesses without employees 2016 2020 Change
531 - Real estate 1417 1486 69
523 - Securities, commodity contracts, other financial investment activities 275 339 64
813 - Religious, grant-making, civic, and professional and similar organizations 64 125 61
Top 3 increase in small businesses (1 to 99 employees) 2016 2020 Change
531 - Real estate 82 106 24
523 - Securities, commodity contracts, other financial investment activities 41 59 18
621 - Ambulatory health care services 577 595 18
Top 3 increase in medium businesses (100-499 employees) 2016 2020 Change
111 - Crop production 1 3 2
562 - Waste management and remediation services 0 2 2
623 - Nursing and residential care facilities 7 9 2
Top 3 increase in large businesses (500+ employees) 2016 2020 Change
913 - Local, municipal and regional public administration 0 2 2
324 - Petroleum and coal product manufacturing 0 1 1
445 - Food and beverage stores 0 1 1
Source: Business Counts, June 2016, June 2020
Table 7 shows the top business increases for businesses with employees were among those in Am-
bulatory health care services and Specialty trade contractors. Real estate and Crop production have
the largest number of businesses in Sarnia Lambton, and both operate primarily without employees
or as a small business with 1-99 employees. Table 8 shows the largest decreases were among those
in Management of companies and enterprises and Animal production and aquaculture. Businesses
that operate within Animal production and aquaculture sustained a decrease in both businesses with
and without employees, with a total decrease of 102 businesses, and an additional decrease in 77
businesses that operate in Crop production.
16Business Decreases
Table 8: Business decreases by business size range
Top 5 Overall Business Decreases 2016 2020 Change
551 - Management of companies and enterprises 188 79 -109
112 - Animal production and aquaculture 491 464 -27
518 - Data processing, hosting, and related services 6 2 -4
443 - Electronics and appliance stores 42 40 -2
519 - Other information services 12 10 -2
Top 3 decreases in businesses without employees 2016 2020 Change
551 - Management of companies and enterprises 167 61 -106
112 - Animal production and aquaculture 392 314 -78
541 - Professional, scientific and technical services 542 470 -72
Top 3 decrease in small businesses (1 to 99 employees) 2016 2020 Change
112 - Animal production and aquaculture 102 74 -28
541 - Professional, scientific and technical services 255 231 -24
111 - Crop production 114 92 -22
Top 3 decrease in medium businesses (100-499 employees) 2016 2020 Change
238 - Specialty trade contractors 7 4 -3
445 - Food and beverage stores 4 2 -2
237 - Heavy and civil engineering construction 2 1 -1
Top 3 decrease in large businesses (500+ employees) 2016 2020 Change
237 - Heavy and civil engineering construction 2 1 -1
452 - General merchandise stores 1 0 -1
622 - Hospitals 2 1 -1
Source: Business Counts, June 2016, June 2020
Through consultations, local employers expressed the need for additional sup-
ports for sole proprietors and small businesses. To support local businesses,
SLWDB will be taking action in 2021 by exploring the needs and challenges creat-
ed by the shift to a remote workforce.
17Industry Trends
In 2016, there were 31,530 employed persons in Sarnia Lambton, whereas in 2006 there were ap-
proximately 32,275 employed persons indicating a decrease in the number people working in the
area. Sarnia Lambton has a diverse set of industries in the area. The top five industries with the
largest workforce sizes are in Manufacturing, Health care and social assistance, Retail trade, Con-
struction, and Education Services (Table 9).
Through consultations with employers, it was found that there continues to be a shortage of Personal
Support Workers in the area. As a result of the Health care and social assistance industry experienc-
ing high level of turnover. Due to Sarnia Lambton’s aging population there is high demand for occu-
pations within the health care and social assistance industry, however, employers are experiencing
challenges retaining current employees and filling vacant positions.
Other industries are impacted by the aging population, for instance, Professional, scientific and tech-
nical services where waves of retirements are expected. Succession planning is needed in order to
sell or change leadership of existing businesses. Employers indicate that recruitment and retention
in this industry is challenging as the candidate supply with the required skills and qualifications is
low in Sarnia Lambton area.
Table 9: Comparison of Sarnia Lambton’s employed workforce industry,
2006 vs 2016
Industry 2006 2016 % Difference
Manufacturing 5,005 4,640 -7.3%
Health care and social assistance 3,945 4,065 3.0%
Retail trade 2,900 2,955 1.9%
Construction 2,520 2,740 8.7%
Educational services 2,075 1,825 -12.0%
Professional, scientific and technical services 1,435 1,740 21.3%
Public administration 1,640 1,705 4.0%
Wholesale trade 1,445 1,600 10.7%
Accommodation and food services 1,540 1,575 2.3%
Transportation and warehousing 1,440 1,560 8.3%
Agriculture, forestry, fishing and hunting 1,745 1,460 -16.3%
Other services (except public administration) 1,480 1,440 -2.7%
Administrative & support, waste management & remediation services 1,380 1,210 -12.3%
Finance and insurance 950 830 -12.6%
Mining, quarrying, and oil and gas extraction 325 460 41.5%
Real estate and rental and leasing 715 460 -35.7%
Utilities 720 460 -36.1%
Arts, entertainment and recreation 685 435 -36.5%
Information and cultural industries 325 320 -1.5%
Source: Statistics Canada. 2016 Census, Custom Table T16 POR Boards CD
Statistics Canada. 2006 Census, Custom Table T16 POR Boards CD
18Industry Trends Continued...
Figure 15: Top 3 industry increases and decreases from 2006 vs 2016
Top 3 Industries with Increases Top 3 Industries with Decreases
Mining, quarrying, and oil and gas extraction Arts, entertainment and recreation
42% Increase 37% Decrease
Professional, scientific and technical Utilities
21% Increase 36% Decrease
Wholesale Trade Real estate and rental and leasing
10% Increase 36% Decrease
Source: Statistics Canada. 2016 Census, Custom Table T19 POR Boards CD
In 2019, SLWDB conducted research on the In-Demand Skilled Trades in Sarnia Lambton. Of the
115 employers who took part in the research, the majority suggested there is a drastic need for
skilled tradespeople in the local area. Employers anticipate the current shortage will continue and
likely increase in the next five years as the current workforce retires and/or largescale projects move
forward. The research also identified a need to attract more youth and women to the skilled trades
to combat this shortage.
Expected trends due to the impacts of COVID-19 vary across the industries. It was concluded through
consultations with employers in industries such as Retail trade, and Accommodation and food ser-
vices, and Professional, scientific and technical services that a shift to digital is necessary, however,
this is not the only challenge faced. According to the Lambton Federation of Agriculture, migrant
workers play a vital role in Sarnia Lambton’s agriculture industry. A recent commentary by the Di-
rector of the Ontario Federation of Agriculture noted the impact of the pandemic on farmers. Many
farmers who benefited from the Seasonal Agricultural Worker Program are reporting ongoing labour
shortages and subsequent changes to their operations.
Migrant workers are a key workforce accessed by the Agriculture sector. Due to
COVID-19, access to migrant workers was restricted in 2020, and is expected to
be a challenge going forward. Migrants and immigrants will play a vital role in
growing Sarnia Lambton’s workforce as the population ages and domestic work-
ing age adults continue to leave the area.
19Labour Force Data
The local labour market in Sarnia Lambton has shown steady improvement between 2011 and 2019
with the unemployment rate decreasing at a steady rate, despite the labour force7 decreasing slightly
from 66,200 people in 2011 to 64,400 people in 2016 (Table 10). The decrease in labour force size is
likely attributable to working age adults leaving the area and the aging population in Sarnia Lambton,
where continuous waves of retirement are expected within the community across all industries.
As a result of the impacts of COVID-19, the unemployment rates for 2020 have increased drastical-
ly during the months of March to end of May. Unemployment data for 2020 can be found on page
26, currently only Economic Region of Windsor-Sarnia which includes aggregate data for Lambton,
Chatham-Kent, and Essex. A glimpse at what SLWDB is doing to support labour force growth post
pandemic can be found on page 27.
Table 10: Labour market information for Sarnia Lambton from 2011-2019
CD 3538 Lambton 2011 2012 2013 2014 2015 2016 2017 2018 2019
Source Population 15+ 108.4 108.4 108.3 108.1 107.8 107.7 107.9 108.3 108.8
Participation Rate (%) 61.1 61.7 60.6 60.9 60.7 60.0 59.3 59.1 59.2
Labour Force 66.2 66.9 65.6 65.9 65.4 64.6 63.9 64.0 64.4
Employed 59.6 60.0 59.7 60.1 59.9 59.4 59.4 59.8 60.0
Unemployed 6.6 6.9 5.9 5.7 5.5 5.2 4.5 4.2 4.4
Unemployment Rate (%) 9.9 10.4 9.0 8.7 8.5 8.1 7.0 6.6 6.8
Ontario
Unemployment Rate (%) 7.9 7.9 7.6 7.3 6.8 6.6 6.0 5.6 5.6
Source: Statistics Canada. Labour Force Survey, 2011-2019. Estimates calculated by metro economics
Figure 16: Trend in Sarnia Lambton’s unemployment rate from 2011-2019
9.9 10.4
9.0 8.7 8.5
8.1
7.0 6.8
6.6
2011 2012 2013 2014 2015 2016 2017 2018 2019
Source: Statistics Canada. Labour Force Survey, 20011-2019. Estimates calculated by metro economics
Definitions:
7
Labour force participants are persons 15 years and older who are either employed or unemployed.
• Employed persons are actively working as employees, self-employed persons or unpaid family workers
(e.g., on farm), or who hold a job but are on leave (e.g. disability, labour dispute).
20 • Unemployed persons are actively looking for work or on temporary layoff.Job Demand
The following section provides insight into online job posting trends in the Sarnia Lambton area,
collected from data sources such as Talent Neuron, SLWDB’s annual EmployerOne survey highlights,
and SLWDB’s newly launched Jobs Board, WISL: Work in Sarnia Lambton. The data collected by
Talent Neuron and WISL only account for jobs posted online, thus it should be noted that not all
employers utilize online job boards as a recruitment method. As noted in the EmployerOne Survey,
word of mouth remains the top recruitment method by local employers.
Job Posting Trends
The data in this section were collected from Talent Neuron be- Figure 17:
tween July 1, 2019 and June 21, 2020. The industries with the Top 3 Certification
top number of hires included Health care and social assistance, Employers Requested
Retail trade, and Educational services. There was a total of Driver’s License
3,829 job postings: Sarnia had 2,722 job postings, while the
remaining 1,107 postings were posted for jobs within other First Aid/CPR
municipalities within the count.
Continuing Education
Table 11: Industry breakdown of job postings
Industry July 1st 2019 - June 30, 2020
Health Care and Social Assistance 521
Retail Trade 352
Educational Services 218
Admin & support, waste mgmt & remediation services 192
Wholesale Trade 164
Other Services (except Public Administration) 161
Finance and Insurance 150
Transportation and Warehousing 149
Professional, Scientific, and Technical Services 139
Accommodation and Food Services 119
Figure 18: Top 8 occupations with the highest amount of job postings
Transport truck Retail Customer service Home support
driver salesperson representatives workers
204 183 142 116
Job Postings Job Postings Job Postings Job Postings
Retail sales Food attendants Sales representative Automotive service
supervisor & kitchen helpers in wholesale trade technicians
114 80 77 73
Job Postings Job Postings Job Postings Job Postings
21EmployerOne Survey Highlights
The figures in this section provide a snapshot of the data collected through the 2020 EmployerOne
Survey. The EmployerOne survey is a community-wide survey that gathers information directly from
local employers to help local employers with local workforce needs and assists in identifying trends.
The full report provides job seekers and employers with data on the latest local hiring trends and
recruitment methods for future and career planning.
In 2020, the number of business respondents increased to 241, with an increase in employer partici-
pation from the Manufacturing and Construction sectors. The employers who participated in the sur-
vey reported hiring for over 3,000 new or existing positions. Despite this large number of hires, 42%
of employers still indicated they had a number of hard-to-fill positions due to a lack of applicants, lack
of qualifications, or lack of work experience. Not surprisingly, employers continued to have ongoing
concern regarding employee retention.
Figure 19: Number of survey responses from 2014-2020
241
208
170
143
119
80
54
2014 2015 2016 2017 2018 2019 2020
Figure 20: Number of new hires by industry
Healthcare and social assistance 925
3,000
Educational services 522 Total
Public administration 458
Hires
Manufacturing 193
2,336
Construction 183
Separations
Accommodation and food services 157
Arts, entertainment and recreation 133 Figure 21
Retail trade 126
22EmployerOne Survey Highlights Continued...
Figure 22: Percentage of Figure 23: Top 3 reasons positions were hard-
businesses that indicated to-fill
they had hard-to-fill posi- 22%
tions 20%
17%
Not enough applicants Lack of qualifications Lack of work experience
(education level/credentials)
Figure 24: Employment
type of hires in 2020
Top
Recruitment Online
Methods Job Boards
Word of Mouth
Social
& Personal
Media
Contacts
Figure 25
Figure 26: Top competencies Figure 27: Top strategies used
employers are looking for: to encourage retention:
Work Ethic Regular salary increases
Self-motivation Training opportunities
Teamwork & interpersonal Employee Recognition
`
To access the full report, visit:
https://www.slwdb.org/wp-content/uploads/2020/06/2020-EmployerOne-Report.pdf
23Jobs Board Jobs Map Career Explorer Census Map
AN INTERACTIVE TOOLKIT DESIGNED FOR JOB SEEKERS AND EMPLOYERS IN SARNIA LAMBTON
WISL: Work In Sarnia Lambton is an online platform operated by the SLWDB. The interactive tool-
kit was launched in June of 2020 and is equipped with resources to help support employers search-
ing to connect with local job seekers within our labour force. The WISL tools also help job seekers
find the job training, skills development resources, entrepreneur supports and employment service
providers in Sarnia Lambton.
Regional Jobs Board
Searchable list of job opportunities found exclusively within the Sarnia Lambton region. These
postings are collected by WISL from the top 23 job posting websites for the area, reducing the
need to ‘hop’ between job site search engines.
Regional Jobs Map
Geolocates the job opportunities listed on the Regional Jobs Board onto a map of the Sarnia
Lambton region. In addition, built in filters make it easy to view locations for childcare, schools,
apprenticeship training, employment service providers and Ontario Disability Support Program
centers to help job seekers find job opportunities and resources that best fit their needs, lifestyle
and career path.
Regional Career Explorer & Career Library
The Career Explorer is a visual tool that makes finding information about career paths between
jobs easier. The Career Library complements the Career Explorer, providing details about occupa-
tion description, alternative job titles, median wages, and local employment participation statistics.
It also links job seekers to the active occupation job listings on the WISL Job Board and allows
users to trace and explore the occupations that lead into a given occupation, as well as the paths
that are available as next steps following that career trajectory.
Regional Census Map
Easy to navigate georeferenced census population data for the various areas of Sarnia Lambton.
The Census tool is a great resource for employers, entrepreneurs and economic advisors who
are interested in having key demographic information from municipalities across Lambton County
on a user friendly, easily accessible platform.
24WISL connects local job seekers to local employers via a one-stop, user-friendly platform. WISL
aggregates all the local job opportunities featured on top 24 job postings websites for the Sarnia
Lambton region (listed on WISL FAQs page). Job postings collected by WISL are incorporated into
the individual WISL tools including the Job Board, the Job Map, the Career Explorer and Career
Library. More information for employers on how to ensure their job postings are featured on WISL
is available on the WISL FAQ page.
A Guidebook has been created to help navigate the many tools WISL
offers as well as FAQs. Find out how you can:
• Have WISL feature job postings from your company’s job board
for a one-time only setup fee, no subscriptions required.
• Have your job postings appear on the WISL Jobs Board and Jobs
Map by adding your job postings to one of the top 23 job sites
that WISL collects from.
» Aboriginal Job Board » Indigenous Careers
» Canadian Executive Search » Job Bank (Government of Canada)
» Career Arc » Jobilico
» Career Builder » Kijiji
» Charity Village » Local Work
» City of Sarnia » Monster
» Commission de la fonction » Recruit
» Community Employment Services – Lambton » Simply Hired
College » The Workplace Group - Connects
» County of Lambton » Work Cabin
» Eluta » Workopolis
» Express Employment Professionals » Wow Jobs
» Indeed
Access the Guidebook here:
https://www.slwdb.org/wisl/work-in-Sarnia-Lambton-guidebook/
Visit the FAQ page here:
www.slwdb.org/wisl/faqs/
25Impact of COVID-19 on the Labour Force
The COVID-19 pandemic, declared March 11th 2020, swept the globe leading to economic disruption
worldwide. In Canada, the level of impact caused by the public health crisis on the workforce has not
been seen since the years of the Great Depression. Ontario declared a State of Emergency March
17th followed by orders for the mandatory closure of all non-essential workplaces March 23rd, 2020.
Between the onset of the pandemic in early March to May 2020, the employment rate in the eco-
nomic region declined by 9.2%. The employment rate started recovering in June, but remains 3.5%
lower than pre-COVID-19 at the end of September 2020. This employment rate is marginally lower
than that for Ontario (3.4%), and lower than seen nationally (2.4%).7
In line with the impact of COVID-19 on employment, the unemployment rate in the economic region
rose by 8.2% between early March and May 2020. As lockdown restrictions began to be lifted for
some non-essential sectors during Stage 2 of Recovery across Ontario in June, the unemployment
rate dropped by 5.2% between June to September. The unemployment rate reported in September
(10.2%) remains 3 points higher than observed in February, pre-COVID-19. In comparison, the
provincial unemployment rate in September (11%) remains nearly 6 points higher than observed
pre-pandemic. 7
Table 12: Unemployment Rate (%) between February - September 2020
Feb March April May June July Aug Sept
Canada 6 7 9 12 13 12 11 10
Ontario 5 6 8 11 13 13 12 11
Windsor-Sarnia, ER 7.2 9.5 11.7 15.4 14.7 13.1 11.3 10.2
Source: Statistics Canada Data: Table 14-10-0293-01
The initial impact of the COVID-19 crisis on employment type was similar for full- and part-time em-
ployment positions. Between the onset of the pandemic in March to May 25,700 full time positions
were lost while the same measure for part time employment was 24, 100. However, the recovery
has been uneven for each employment type. Since June, full time employment positions rose to
nearly pre-COVID-19 levels with a net loss measured to be 1,100. This is drastically different from
17, 700 part-time employment positions that have not yet returned as of September 2020.8 Given the
sectors that continue to be impacted by the public health measures in place to mitigate the impact
of COVID-19 (Technical occupations in art, culture, recreation and sport; Sales and Services occupa-
tions), it is unsurprising that recovery of part-time employment has trailed behind that of full-time
employment.
7
Source: Statistics Canada Data: Table 14-10-0293-01: Labour force characteristics by economic region,
three-month moving average, unadjusted for seasonality.
26Impact of COVID-19 on the Labour Force Continued...
Due to the COVID-19 pandemic, Labour force
information on employment in Sarnia Lambton
was unavailable, however, we were able to pro-
vide updates on the labour force statistics for
the entire Economic Region 3570 which includes
Lambton, Chatham-Kent and Essex.
Economic Regions of Ontario:
Figure 28: 2020 Unemployment Rate for the Economic Region 3570 which
includes Lambton, Chatham-Kent and Essex
17.7
14.7 14.5
11.7
10.7 9.9
8.6
7.2 7.5
JANUARY FEBRUARY MARCH APRIL MAY JUNE JULY AUGUST SEPTEMBER
Source: Statistics Canada. Labour Force Survey, January to September 2020. Estimates calculated by
Metro Economics
To support the local community and assist job seekers and employers in Sarnia
Lambton, SLWDB launched WISL: Work in Sarnia Lambton. The interactive job
search toolkit allows job seekers to locate job postings specifically within Sarnia
Lambton from the top 25 job boards and job sites in the area. Along with this tool,
SLWDB will also be working to address and promote existing opportunities to re-
skill job seekers with the necessary skills to find employment following COVID-19.
27COVID-19 Community Impact
A snapshot of the early impact of the COVID-19 outbreak on the labour force in Sarnia Lambton was
captured from 297 respondents by the Worker Impact Survey conducted by SLWDB. The occupa-
tions most affected by the pandemic were those in the arts, entertainment and recreation (100% of
respondents in this occupation are out of work temporarily or permanently) as well as information
and cultural industries (80% of respondents in this occupation are out of work temporarily or per-
manently).
Over 50% of respondents in the following occupations were out of work temporarily or permanently:
arts, entertainment and recreation; construction and utilities; information and cultural industries;
and mining. In contrast, over 75% of respondents in the following industries were working in their
usual place of work or from home: professional, scientific, technical and administrative services;
public administration; health care and social assistance; finance and real estate; and agriculture,
forestry and fishing. In terms of the type of worker impacted by COVID-19, those who identified as
self-employed described experiencing a bigger impact than employees, with 72% reporting being out
of work. Conversely, under 33% of employees indicated they were out of work.
Read the complete Covid-19 Worker Survey Report for additional insights here: https://www.slwdb.
org/wp-content/uploads/2020/05/COVID-19-Worker-Impact-Survey-Complete-Results.pdf
Impact
Figure 29: of the
Impact COVID-19 crisis
of COVID-19 on Respondents'
on respondents’ Employment
employment Status
status
I AM STILL WORKING IN MY USUAL PLACE OF WORK 45.6%
I AM TEMPORARILY NOT WORKING DUE TO THE COVID-19 CRISIS 33.2%
I AM WORKING FROM HOME TEMPORARILY 17.2%
I HAVE PERMANENTLY LOST WORK DUE TO THE COVID-19 CRISIS 3.3%
Source: Sarnia Lambton Workforce Development Board’s COVID-19 Worker Impact Survey Results, 2020.
Figure 30: Impact of COVID-19
Impacton employees vs
on employment those self-employed
type
66.5% 72.0%
32.7% 28.0%
EMPLOYEE SELF-EMPLOYED
Working in usual place or from home temporarily due to COVID-19
Out of work due to COVID-19 (temporary or permanent)
28 Source: Sarnia Lambton Workforce Development Board’s COVID-19 Worker Impact Survey Results, 2020.COVID-19 Initiatives
From the onset of the economic impact of the pandemic, SLWDB recognized the importance of sup-
porting local employers and job seekers through this tumultuous period. SLWDB collaborated with
a number of community partners on several initiatives designed to help businesses navigate these
uncertain times.
Sarnia-Lambton COVID-19 Business and Economic Task Force: committee comprised of
the Sarnia Lambton Economic Partnership, the Sarnia Lambton Business Development Corporation,
Tourism Sarnia Lambton, the Sarnia Lambton Chamber of Commerce, and the Grand Bend and Area
Chamber of Commerce. These organizations support economic and workforce development that
meet weekly to collect, coordinate and disseminate information on strategies and implement pro-
grams to mitigate the negative effects of the COVID-19 pandemic on employers and our workforce.
COVID-19 Worker Survey: SLWDB launched a survey designed to assess the impact of COVID-19
on the local workforce.
Business Impact of COVID-19 Survey: SLWDB supported the development and dissemination
of a business survey designed to capture a snapshot of the challenges presented by the pandemic
on business operations.
Shop Lambton Map: SLWDB supported an initiative to launch an interactive online map of local re-
tail and service delivery businesses at no charge to owners/operators. The aim was to create an easy
to navigate visual database of local business information including hours of operations and contact
protocols for services to promote and support the SHOP LOCAL campaign.
Scenario Planning: SLWDB spearheaded an initiative to define the future workforce. Through col-
laborative effort with key partners across economic sectors and community service providers, scenar-
ios representing what the future workforce may look like are being designed to serve as foundations
for sector specific plans of actions to support the workforce. The action plans will provide guidance
on how businesses can mitigate possible negative impacts of COVID-19 on our labour force over a
short, intermediate and long-term timeframe based on the direction and pace of the post-pandemic
economic recovery. They will also outline strategies to harness opportunities for our labour force and
economy arising post-COVID-19 over a short, intermediate and long-term timeframe.
While we continue to identify immediate challenges to overcome and opportunities to seize, the
next step in supporting our businesses and their workforce is to provide guidance on developing a
recovery strategy that will create resiliency for the upcoming years. Continued uncertainty about
the progression of the COVID-19 pandemic as well as its long-term impacts on the global economy
mean that a scenario-based approach is required to plan proactively for these stages of recovery.
Our priority is to ensure the sustainability and growth of our labour force in Sarnia Lambton. The
blueprint generated through this project will serve as a guide for local employers to understand and
prepare for the potential challenges and opportunities awaiting the local labour force beyond the era
of COVID-19.
29You can also read