Large-Scale Study of Perceptual Video Quality - arXiv
←
→
Page content transcription
If your browser does not render page correctly, please read the page content below
Large-Scale Study of Perceptual Video Quality
                                                                  Zeina Sinno, Student Member, IEEE, and Alan Conrad Bovik, Fellow, IEEE

                                             Abstract—The great variations of videographic skills, camera             video watch hours each day [1]. On YouTube, the overall
                                          designs, compression and processing protocols, communication                durations of the videos that are uploaded daily exceeds 65
                                          and bandwidth environments, and displays lead to an enormous                years, and more than 1 billion hours of their video content is
                                          variety of video impairments. Current no-reference (NR) video
                                          quality models are unable to handle this diversity of distortions.          watched each day [2]. These numbers are continuing to rise
                                          This is true in part because available video quality assessment             and to reshape digital marketing, entertainment, journalism,
                                          databases contain very limited content, fixed resolutions, were             and amateur videography. The volume of streaming video
                                          captured using a small number of camera devices by a few                    viewed online has become so large that more than 130 million
arXiv:1803.01761v2 [eess.IV] 4 Nov 2018

                                          videographers and have been subjected to a modest number of                 people are now Netflix subscribers [3]. Streaming videos now
                                          distortions. As such, these databases fail to adequately represent
                                          real world videos, which contain very different kinds of content            comprises the majority of Internet traffic today. It is no surprise
                                          obtained under highly diverse imaging conditions and are subject            that videos account for the largest portion of Internet traffic,
                                          to authentic, complex and often commingled distortions that                 which is expected to eclipse 82% of all transmitted bits by
                                          are difficult or impossible to simulate. As a result, NR video              2021 [4]. These videos are captured using a very wide variety
                                          quality predictors tested on real-world video data often perform            of camera devices by users having very diverse goals and
                                          poorly. Towards advancing NR video quality prediction, we
                                          have constructed a large-scale video quality assessment database            expertise.
                                          containing 585 videos of unique content, captured by a large
                                          number of users, with wide ranges of levels of complex, authentic           A. Conventional Laboratory VQA Databases
                                          distortions. We collected a large number of subjective video qual-             It is necessary that VQA algorithms be trained and/or tested
                                          ity scores via crowdsourcing. A total of 4776 unique participants           on extensive subjective video quality data sets so that it maybe
                                          took part in the study, yielding more than 205000 opinion scores,
                                          resulting in an average of 240 recorded human opinions per                  asserted that they reflect or are capable of closely replicating
                                          video. We demonstrate the value of the new resource, which we               human judgments. As a result, over the past decade numerous
                                          call the LIVE Video Quality Challenge Database (LIVE-VQC                    researchers have designed and built VQA databases. The LIVE
                                          for short), by conducting a comparison of leading NR video                  VQA Database [5] contains 10 pristine high-quality videos
                                          quality predictors on it. This study is the largest video quality           subjected to 4 distortion types: MPEG-2 compression, H.264
                                          assessment study ever conducted along several key dimensions:
                                          number of unique contents, capture devices, distortion types and            compression, H.264 bitstreams suffering from IP, and wireless
                                          combinations of distortions, study participants, and recorded               packet losses. The resource in [6] offers 156 video streams
                                          subjective scores. The database is available for download on this           suffering from H.264/AVC artifacts and wireless packet losses.
                                          link: http://live.ece.utexas.edu/research/LIVEVQC/index.html .              The LIVE QoE Database for HTTP-based Video Streaming
                                                                                                                      [7], studies the quality of experience of users under simulated
                                            Index Terms—Video Quality Assessment, Database, Crowd-                    varying channel induced distortions, and the LIVE Mobile
                                          sourcing, Multimedia
                                                                                                                      Video Quality Database [8] includes channel induced distor-
                                                                                                                      tions and dynamically varying distortions, such as varying
                                                                   I. I NTRODUCTION
                                                                                                                      compression rates. More recent databases include the TUM
                                             The goal of Video quality assesement (VQA) research is                   databases [9], [10], which target H.264/AVC distortions on a
                                          to develop video quality models that produce predictions that               few contents (4 and 8); and the MCL-V [11] database consists
                                          are in close agreement with human judgments, regardless of                  of 12 video source clips and 96 distorted videos, targeting
                                          the video contents or the type and severities of the distortions            distortions related to streaming (compression, and compres-
                                          (or the mixtures of distortions) that have corrupted the videos.            sion followed by scaling). The MCL video quality database
                                          Over the past decade, we have experienced a surge in the                    contains 200 raw sequences targeting compression artifacts
                                          number of videos recorded, shared and watched. Sharing “in-                 [12]. Most available video quality databases were conducted
                                          the-moment” experiences in the form of video has become                     under highly-controlled laboratory conditions by introducing
                                          quite popular using applications such as Instagram, Facebook,               sets of graded simulated impairments onto high-quality videos.
                                          Twitter via Periscope, Snapchat, and so on. Online videos have              Given questions that arise regarding the realism and accuracy
                                          also revolutionized modern journalism as they enable online                 of representation of synthetic distortions, researchers have also
                                          news stories to unfold live, and allow the viewing audience                 conducted studies on the quality perception of authentic, real-
                                          to comment on or otherwise interact with it. Over the past                  world distortions such as distortions that occur during video
                                          year, Facebook alone generated more than 100 million of                     capture [13], [14].
                                                                                                                         Here we aim to further advance these efforts by the con-
                                            Zeina Sinno and Alan C. Bovik are with the Department of Electrical and
                                          Computer Engineering at The University of Texas at Austin, Austin, TX,      struction of a new large VQA database that is more repre-
                                          78712, USA (e-mails: zeina@utexas.edu - bovik@ece.utexas.edu).              sentative of real-world videos, the authentic distortions that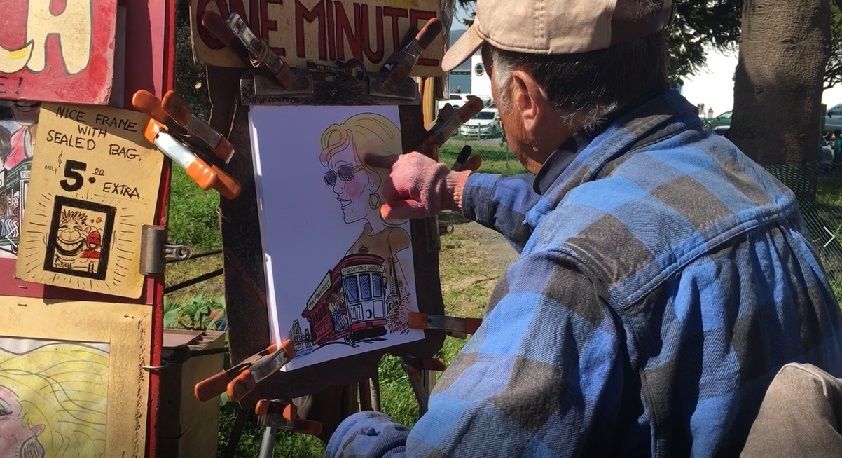
affect them, and more typical users’ opinions of their quality.      bandwidth conditions on the participant’s side. We carefully
By authentic distortions, we refer to degradation that occurs in     designed a framework in Amazon Mechanical Turk (AMT)
actual practice, rather than being synthesized and introduced in     to crowdsource the quality scores while accounting for these
a controlled manner in the laboratory. The videos we gathered        numerous factors, including low bandwidth issues which could
were captured by everyday, generally inexpert videographers          result in video stalls, which are very annoying during viewing
using some kind of handheld camera or by smartphone. These           and can heavily impact the experienced video quality.
kinds of devices now account for a preponderance of all                 Previous crowdsourced video quality studies have not ad-
videos being captured, watched and shared. The video capture         dressed the latter very important concern. For example, in the
device, level of skill of the camera operator, and the lighting      study in [20], the participants were allowed to use either Adobe
conditions and other environmental factors deeply effect the         Flash Player or HTML5 to display videos, depending on the
visual quality of a given video. Most existing video quality         compatibility of their browser. However, in their methodology,
assessment databases offer only very limited varieties of video      no assurance could be made that the videos would fully
content, shot by only a few users, thereby constraining the          preload before viewing, hence there was no control over
ability of learned VQA models trained on them to generalize          occurrences of frame freezes or stalls, or even to record such
to diverse contents, levels of videographic expertise, and           instances on the participants’ end, as Flash Player does not
shooting styles [9], [10], [5], [7], [11], [13]. The majority        have this option, and some browsers disable this option for
of the videos in these databases were captured using high-           HTML5 video element. When the videos are not preloaded
end cameras. These were then synthetically impaired by a             and are streamed instead, interruptions and stalls are often
few controlled distortion types. However, real world videos          introduced, whereas the study in [20] did not report any
are quite diverse and have often been subjected to complex,          effort to record whether such events took place. The early
nonlinear, commingled distortions that are likely impossible         QoE crowdsource framework [18] also did not report any
to accurately synthesize. To account for all these issues, we        accounting of this important factor.
have constructed a real-world, “in the wild”, video quality             A significant and recent crowdsourced VQA database was
assessment database which consists of 585 videos, sourced            reported in [21], providing an important new resource to
from 80 different inexpert videographers, and captured using         the video quality community. In this study, a subject was
43 different models of 101 unique devices. The new database          asked to rate any number of videos within the range 10 to
represents unprecedented degrees of realism, data authenticity,      550 videos. We note that viewing as many as videos as the
and relevance.                                                       upper end of this range is likely to produce fatigue, which
B. Crowdsourced VQA Databases                                        affects performance. Generally, it is advisable to restrict the
                                                                     number of watched videos per session so that the session
   Crowdsourcing is a portmanteau of the words crowd and             time does not exceed 30-40 mins including training, to reduce
outsourcing. The term was first used in 2006 to describe the         fatigue or loss of focus [22]. Also, we observed that the study
transfer of certain kinds of tasks from professionals to the         participants in [21] were allowed to zoom in or out while
public via the Internet.                                             viewing, which can introduce artifacts on the videos, and can
   Crowdsourcing has recently proved to be an efficient and          lead to interruptions and stalls. Scaling a video up or down
successful method of obtaining annotations on images regard-         is computationally expensive. Under these conditions, stalls
ing content [15], image aesthetic [16] and picture quality           could occur even if a video was fully preloaded into memory
[17]. An early effort to crowdsource video quality scores            before being played. Downscaling and upscaling artifacts, and
was reported in [18]. The authors proposed a crowdsourced            video stalls are factors that significantly impact the perceived
framework, whereby pairwise subjective comparisons of the            video quality. Detecting whether stalls occurred is also critical.
Quality of Experience of multimedia content (audio, images           It appears that the authors of the study did not account
and videos) could be recorded.                                       in any way for stalls, which is highly questionable, since
   The authors of [17] conducted a large-scale, comprehensive        stalls can deeply impact reported subjective quality. These
study of real-world picture quality and showed that their results    types of issues underline the difficulty of online video quality
were quite consistent with the results of subjective studies         studies, and the need for careful design of the user interface,
conducted in a laboratory.                                           monitoring of the subjects, and the overall supporting pipeline
   This success of latter study [17] has inspired our work here,     used to execute a large-scale study.
with a goal to build a large, diverse and representative video          A few other video crowdsourcing methods have been re-
database on which we crowdsourced a large-scale subjective           ported, at much smaller scales without addressing the difficult
video quality study. We encountered many difficulties along          technical issues [23], [24], [25], [26], [27] described in the
the way, many of which were significantly more challenging           preceding.
than in the previous picture quality study [17]. The issues
                                                                        The contributions of the paper are summarized as follows:
encountered from simple participant problems (distraction,
reliability and a imperfect training [19]), to more serious issues    1) A new robust framework for conducting crowdsourced
such as variations in display quality, size and resolution, to           video quality studies and for collecting video quality
very difficult problems involving display hardware speed and             scores in AMT.
Fig. 1. Screenshots of frames from some of those presented during the study.

 2) A new VQA database, that we call the LIVE Video Qual-               concludes with future thoughts in Section VI.
    ity Challenge (LIVE-VQC), which contains contains 585
                                                                           II. LIVE V IDEO Q UALITY C HALLENGE (LIVE-VQC)
    videos of unique content and associated MOS, captured
                                                                                               DATABASE
    by 80 different users and 101 devices. The videos are
    afflicted by authentic distortions like those that occur in            While considerable effort has been applied to the VQA
    the real world. We are making this database available to            problem for high-end streaming video (e.g., Internet televi-
    the research community at no charge. [28].                          sion), much less work has been done on videos captured by
                                                                        mobile and digital cameras by casual users. Our objective was
   In the following sections, we present the results of a large-        to create a resource to support research on this very large-
scale crowdsourced video study, where we collected more than            scale, consequential topic. Our specific aim is to offer a large,
205000 opinion scores on 585 diverse videos containing com-             high-quality dataset of authentically captured and distorted
plex authentic distortions. We also evaluate the performances           videos, and a large corpus of science-quality psychometric
of prominent blind VQA algorithms on the new database. The              video quality scores.
rest of the paper is organized as follows: we present the details
of the video database in Section II, the experimental methods           A. Content Collection
in Section III, the experimental methods of post-processing of            Our data was collected with the assistance of 80 largely
the subjective scores and the outcomes of our study in Section          naı̈ve mobile camera users from highly diverse age groups,
IV, and the algorithm comparisons in Section V. The paper               gender, and social, cultural and geographic diversity. We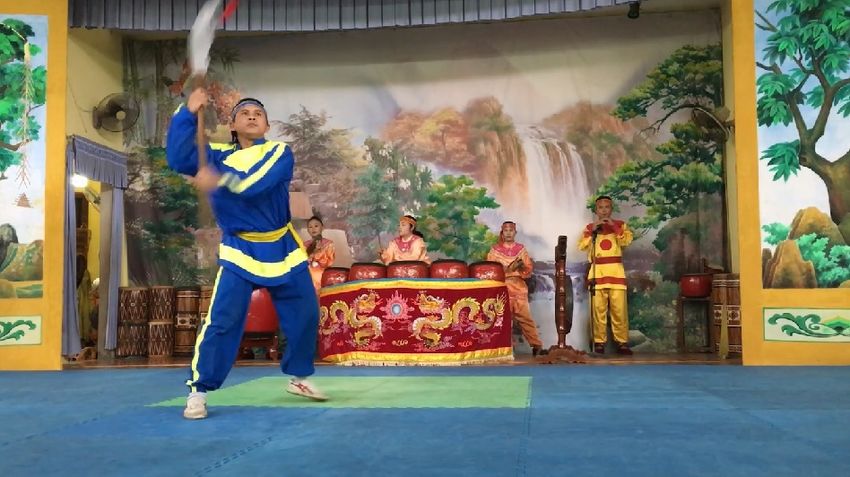
requested the collaborators to upload their videos just as            of the videos were captured using devices that were released
captured, without any processing (for example by video pro-           after 2015 and beyond.
cessing ‘apps’ like Instagram or Snapchat). Only videos having
durations of at least 10 seconds were accepted. No instructions                                 TABLE I
regarding the content or capture style was provided, other than        N UMBER OF VIDEOS CAPTURED BY EACH TYPE OF CAMERA DEVICES .
it reflect their normal use.                                                       Make             Model       Number of Videos
   Most of the video contributors were volunteers, including                     Amazon          Fire HDX              1
acquaintances of LIVE members; i.e, from family, friends,                         Apple            Ipad Pro            2
                                                                                  Apple         Iphone 3GS             1
friends of friends, and so on, from around the world, while                       Apple            Iphone 4           14
the rest (∼18%) were students solicited from the undergrad-                       Apple          Iphone 4S             2
uate and graduate population at The University of Texas at                        Apple            Iphone 5           25
                                                                                  Apple           Iphone 5s           49
Austin. The number of videos provided by each contributing
                                                                                  Apple            Iphone 6           48
videographer varied but none contributed by more than 9%                          Apple           Iphone 6s          107
of the video set, to ensure diversity of method, content and                      Apple       Iphone 6s plus           5
style. The contributors spanned a wide age range (11 to                           Apple            Iphone 7           17
                                                                                  Apple        Iphone 7 plus           3
65 years old), and were divided about evenly by gender.                           Apple          Ipod touch            8
The content was shot on all the populated continents and in                        Asus        Zenfone Max             1
many countries, including Australia, U.S.A., Mexico, Peru,                        Google             Pixel             7
Panama, Colombia, Bolivia, India, Malaysia, Vietnam, China,                       Google          Pixel XL            20
                                                                                 Hisense              S1               1
South Korea, Germany, Norway, Switzerland, Poland, Sweden,                         HTC                10              13
U.K., Portugal, Turkey, Lebanon, the United Arab Emirates,                         HTC                M8               5
Oman, Tunisia, Egypt and more. More than 1000 videos were                         Huawei          Nexus 6P            10
                                                                                    LG                G3               3
gathered, cropped to 10 seconds while seeking to preserve                           LG                G4               2
‘story’ continuity, culled to remove redundant content captured                     LG             Nexus 5            50
by a same user and videos with disturbing content (e.g. a scene                  Motorola             E4               1
of surgery). After this cleaning, we were left with 585 videos.                  Motorola       Moto G 4G              3
                                                                                 Motorola        Moto G4+              1
   As exemplified in Fig. 1, the obtained video content is                       Motorola     Moto Z Force            12
quite diverse, and includes scenes of sports games, music                         Nokia          Lumia 635             5
concerts, nature, various human activities (parades, dancers,                     Nokia          Lumia 720             3
street artists, cowboys etc.), and much more. The scenes were                    OnePlus               2               4
                                                                                 OnePlus               3               4
captured under different lighting conditions (different times of                 Samsung        Core Prime             5
day and night), and include both indoor and outdoor scenes.                      Samsung       Galaxy Mega             1
Widely diverse levels of motion (camera motion and in-frame                      Samsung      Galaxy Note 2           21
                                                                                 Samsung      Galaxy Note 3            5
motion) are present and often contibute to complex, space                        Samsung      Galaxy Note 5           72
variant distortions. While it is very difficult to categorize real-              Samsung         Galaxy S3             4
world picture and video distortions with any precision, owing                    Samsung         Galaxy S5            25
to their intrinsic mutability, their tendency to commingle, many                 Samsung         Galaxy S6            14
                                                                                 Samsung         Galaxy S8             6
distortions have been observed including, for example, poor                       Xiaomi             MI3               1
exposures, and a variety of motion blurs, haziness, various im-                   Xperia         3 Compact             3
perfect color representations, low-light effects including blur                    ZTE              Axon 7             1
and graininess, resolution and compression artifacts, diverse
defocus blurs, complicated combinations of all of these, and          Figure 2 depicts the distribution of the viewed videos grouped
much more. The interactions of multiple artifacts also give rise      by brand. As expected [29] the majority of these videos (∼
to very complex, difficult to describe composite impairments.         74%) were captured using commercially dominant Apple and
Often visible distortions appear, disappear, or otherwise morph       Samsung devices.
during a video, as for example, temporary autofocus blurs,
exposure adjustments, and changes in lighting. As such, we
made no attempt to supply distortion labels to the videos.

B. Capture Devices
   A taxonomy of the mobile devices used to capture the
videos is given in Table I. Unsurprisingly, the majority of
these were smartphones. A total of 101 different devices were
deployed (some users provided videos captured by multiple de-
vices), including 43 different models. The commercial releases
of the devices varied between 2009 and 2017, although most                 Fig. 2. Distribution of viewed videos grouped by device brand.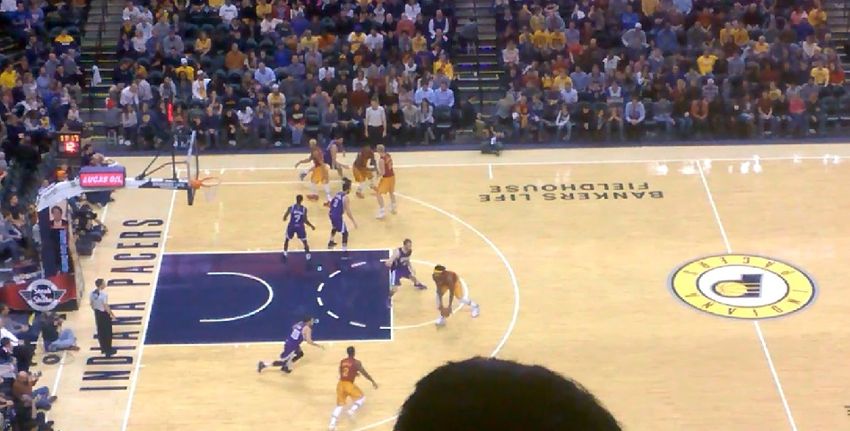
C. Video Orientations and Resolutions                                   then half of the videos they evaluated would have this reso-
   We imposed no restrictions on the orientation of the camera          lution, whilst the rest were randomly selected from the rest
device during capture (or after), and 23.2% of the videos in the        of the database. All of the other participants viewed randomly
database were taken in portrait mode and the other 76.2% in             selected videos having resolutions less than 1920×1080.
landscape mode. The majority of the videos shot in portrait and
                                                                                        III. T ESTING M ETHODOLOGY
are of high resolutions (1080×1920 and 3840×2160) which
cannot be fully displayed by most available displays without               Given that real users nearly always view single videos,
downscaling them. The median display configuration in use               rather than side-by-side pairs, and since, in every case we
today appears to be 1280×720 [30]. To ensure compatibility,             have only a single, authentically distorted version of each
all portrait videos of resolutions 1080×1920, 2160×3840, and            content, we deployed a single stimulus presentation protocol.
720×1080 were downscaled using bicubic interpolation to                 Since the study is crowdsourced and conducted in the wild,
404×720, so that they could be displayed at the native display          we could not apply many ITU standard recommendations
resolutions of all subjects accepted to participate in the study.       (e.g. [22]) when conducting the subjective studies [31]. We
   Among the videos in landscape mode, many were of                     did, however abide by agreed-on principles regarding timing,
resolutions that cannot be displayed by viewers (those that             stimulus presentation, and subject training, as detailed in the
were 1920×1080 and 3840×2160). At the time the study                    following.
was conducted, it was estimated that only between 10-20% of
global web viewers possessed high resolution displays equal             A. Participation Requirements
to or exceeding 1920×1080 [30]. As a way of accessing both                 We first list the participation requirements, then explain each
high and low resolution display groups, we decided to down-             in detail. To be eligible to participate, the worker should:
scale a portion of the large resolution videos to 1280×720 to           1) Have an AMT reliability score above 90% (reliability
better distribute the scoring tasks, since we expected relatively           constraint).
few participants to be capable of viewing high resolutions.             2) Have not participated previously in the study (unique
Thus, 110 videos randomly selected videos were maintained                   worker constraint).
at resolution of 1920×1080, while the remaining 1920×1080               3) Use a non-mobile display device, viz. desktop and laptops
and higher resolution videos were downsampled to 1280×720                   are allowed, while mobile phones and tablets are not
using bicubic interpolation. We ended up with 18 different                  (display constraint).
resolutions in our database, as summarized in Table II.                 4) Use a display having a minimum resolution of 1280×720
                                                                            (resolution constraint).
                             TABLE II                                   5) Use a recently updated supported browser. The study sup-
                V IDEO RESOLUTIONS IN THE DATABASE
                                                                            ports Google Chrome, Safari, Mozilla Firefox, and Opera.
 1920×1080    1280×720     960×540     800×450     480×640    640×480       Internet Explorer, Microsoft Edge and other browsers were
  404×720     360×640      640×360     352×640     640×352    320×568
  568×320     360×480      480×360     272×480     240×320    320×240
                                                                            not allowed (browser constraint).
                                                                        6) Have a good Internet capacity (connectivity constraint).
   The predominant resolutions were 1920×1080, 1280×720                 7) Use a device with adequate computational power (hardware
and 404×720, which together accounted for 93.2% of the total,               constraint).
as shown in Fig. 3. The other resolutions combined accounted            Explanations supporting these choices are as follows:
for 6.8% of the database.                                                  1) Reliability constraint: AMT records how many jobs
                                                                        each worker has completed, and how many jobs were accepted,
                                                                        to determine the acceptance ratio, known as the reliability
                                                                        score. Because of the subtlety of many distortions and to better
                                                                        ensure subject assiduity, we only allowed workers having an
                                                                        acceptance rates exceeding 90% to participate.
                                                                           2) Unique worker constraint: We imposed this condition
                                                                        to avoid any judgment biases that might arise if workers rated
                                                                        videos more than once.
                                                                           3) Device constraint: We enforced this condition for two
                                                                        reasons. First, mobile browsers do not support preloading
                                                                        videos, which is a major concern. Second, it is not possible to
                                                                        control the resolutions of videos displayed on mobile browsers,
   Fig. 3. Distribution of the resolutions viewed by the AMT workers.   since they must be played using a native player on the device
                                                                        where are upscaled or downscaled, then played in full screen
   We managed the videos shown to each worker by first de-              mode, whereby additional, unknown artifacts are introduced.
tecting their display resolution by executing code in the back-            4) Resolution constraint: We required the worker display
ground. If their display resolution was at least 1920×1080,             resolutions to be at least 1280×720 (720p) as discussed earlier.
Fig. 4. Chart showing the categories of videos seen by a subject viewing session.

   5) Browser constraint: As of early 2018, Internet Explorer            one established. This was allowed to occur only once. As a
and Microsoft Edge do not support video preloading in                    global constraint, the duration of each study session was not
HTML5. For this reason, we did not allow users of those                  allowed to exceed 30 minutes. This helped to filter out corner
browsers to take part of the study. Google Chrome, Safari,               cases where connections were successfully established but the
Mozilla Firefox, and Opera support this option starting at               loading progress was very slow. We also implemented two
a certain version. We verified that the browser (and the                 temporal checkpoints to track the progress of each worker.
version) used by each worker was compatible with the HTML5               After a third of the session videos were viewed, if it was
video preloading attribute. We verified that each session could          detected that more than 10 minutes (one third of the allowed
proceed with smooth preloading, thereby eliminating the pos-             time) had elapsed, then a warning message was displayed
sibility of bandwidth-induced stalling (rebuffering) events.             informing the worker that they might not be able to complete
   6) Connectivity constraint: Poor Internet connectivity or             the test on time. The second checkpoint occurred after two
slow bandwidths can cause annoying delays as the videos                  thirds of the content had been viewed, warning them if 20
are loading leading to possible frustration and loss of focus            minutes had passed. We encouraged the workers (as part of
on the part of the subjects. Under extremely poor bandwidth              the training process) to close any other windows or tabs open
conditions, it can also lead to timeouts in the connection               in the background before commencing the study to avoid
established between the server where the videos are stored               draining their bandwidth. They were reminded of this again
and the worker’s side. Internet bandwidth is stochastic and              if their progress was slow or if they were experiencing large
unpredictable as it changes over time. In rare cases, a timeout          delays. Before launching the study, we extensively tested the
can emerge at the users’ side, with good bandwidth conditions.           framework under highly diverse bandwidth conditions and
For example, a new device may join the network and initiate              scenarios to ensure its efficacy.
a large download. In such a case, a sudden drop in the                      7) Hardware constraint: Slow hardware or poor computa-
bandwidth could be experienced. To minimize these problems,              tional power can lead to “frame freeze” stalls while a video
we tracked the loading progress of each video and acted                  is played. To minimize the frequency of these occurrences,
accordingly. Each video was requested at least 30 seconds                we encouraged each worker (via the training instructions) to
before it was needed by the subject. If the connection was not           close any programs running in the background, and if they
successfully established the first time, a second attempt was            were using a laptop, to ensure that it was plugged into an
made 10 seconds later, and a third 10 seconds after that. If             outlet to further promote better performance.
the connection again failed, the session was terminated and
the worker was informed. Once a connection was successfully              B. Viewed Content
established and the loading commenced, if it was detected                  During a single session, each subject viewed a total of 50
that the loading progress halted for a certain interval of time,         videos: 7 training and the remaining 43 during the rating
the connection with the server was terminated and a new                  process (Fig. 4). The videos displayed during the training

Fig. 5. Subjective study workflow.

process were selected to broadly span the ranges of video           video quality compares to an ideal, or best possible video of
quality containing within the database, and were of mixed           the same content. Several example videos were then played
resolutions, to prepare the subjects for their later viewing.       to demonstrate exemplars of some of the video distortions
The training varied slightly with the detected sizes of the         such as under exposure, stalls, shakes, blur and poor color
workers’ displays. Those viewers using displays of resolution       representation. The worker was informed that other types of
of 1920×1080 or higher were presented with two videos               distortions exist and would be seen, so the worker would not
matching their display, along with a mixture of videos of           supply ratings based only on the exemplar types of distortions,
smaller resolutions (1280×720 and less). Those subjects hav-        but would instead rate all distortions.
ing display resolutions lower than 1920×1080 were presented            Step 2: Eligibility check: If the user accepted to work on the
with videos of mixed resolutions no higher than 1280×720.           ‘hit’, and it was determined whether s/he did not previously
   The 43 videos viewed during the judgment (test) phase            participate in the study, and that s/he met conditions 2)-5)
included:                                                           above. If the worker did not meet any of those conditions, a
   • 4 distorted videos drawn from the LIVE Video Quality           message was displayed indicating which condition was unmet,
     Assessment Database [5], which we will refer to as the         and that s/he was kindly requested to return the hit. If it was the
     “golden videos.” These videos were previously rated by         case that any of conditions 3)-5) was unmet, then the displayed
     human viewers in the tightly controlled study [5], and are     message invited the worker to try working on the hit again,
     used, along with the prior subjective scores from [5], as      but using another device/ browser etc., depending on which
     a control to validate the subjects’ ratings.                   condition was not met. During this step, the browser zoom
   • 31 videos randomly selected from the new distorted video       level was adjusted to 100% to prevent any downscaling or
     database. If the worker had a display resolution no less       upscaling artifacts from occurring when the videos are played.
     than 1920×1080, then 18 videos were drawn from the                Step 3: Timed Instructions: If the worker was able to
     pool of videos having a resolution of 1920×1080, and           proceed, the instruction page was displayed again, with a
     the remaining 13 videos selected from the other, lower         countdown timer of one minute. Once the countdown timer
     resolution videos.                                             reached zero, a proceed button would appear at the bottom
   • 4 videos randomly selected from the same pool of 31            of the page, thereby allowing the worker to move forward.
     videos as above, but repeated at relatively displayed          The instructions were repeated because while the study was
     moments as a control.                                          in progress (at the end of 2017), AMT was in the process
   • 4 videos selected from the database were viewed and            of migrating towards a new user interface that allowed the
     rated by all of the workers.                                   users to accept a ‘hit’ without first previewing it. Additionally,
The 43 videos were placed in re-randomized order for each           some workers used scripts while working on AMT, such as
subject.                                                            Microworkers and Tampermonkey, which would auto-accept
                                                                    hits on behalf of the workers when posted. Hence, some of
C. Experimental Flow                                                the workers would not have had the opportunity to read the
   Each subjective study session followed the workflow de-          instructions if they were not repeated. While the instructions
picted in Fig. 5. We now describe each step in detail.              were being repeated, the first three videos began loading in the
   Step 1: Overview: Once a worker with a reliability score         background, and the videos that were to be displayed during
exceeding 90% selected our study to preview it, s/he was            the testing phase were determined.
prompted to an overview page describing the task, the require-         Step 4: Training: Once a subject clicked on the Proceed
ments to participate (conditions 2-7), the instructions on how      button, a message was displayed indicating that the training
to rate a video, and a few example videos to give them a            phase was about to start. This phase consisted of 7 videos.
clearer sense of the task. The worker was instructed to rate        A screenshot of the interface featuring each video to be rated
the videos based on how well s/he believes the presented            (during both the training and test phase) is shown in Fig. 6.
a) Step 1: viewing a video.

                                                     b) Step 2: rating the video
                                       Fig. 6. Screenshot of the interface used to rate the videos.

As shown, the video controls were hidden and inaccessible,            and Excellent was provided to generally guide their ratings.
to prevent less dedicated workers from pausing, replaying             The initial position of the cursor was randomized. This was
or skipping the videos. Before a video was fully loaded, a            mentioned in the instructions and was also indicated in a note
message was displayed showing the loading progress. Once              above the rating bar. Once each video finished playing, the user
the video was fully loaded, a message informed the user that          moved the cursor to the appropriate position. The user was not
“Video loaded and ready to be played.” At this point, the zoom        allowed to proceed to the next video unless s/he moved the
level was checked to determine whether it was at 100%, and            position of the cursor. Once a change in the cursor location
was then adjusted if need to be. The video was then played in         was detected, the Next Video button became clickeable. Once
entirety (while being muted) if the page was displayed in full        clicked, the worker moved to a new page, with a new video
screen mode. Otherwise, a message was displayed directing             to be rated and the process continued until the last video had
the worker to adjust it and to again press the play button            been rated.
afterwards. This had the additional benefit of reducing worker
multitasking, which could distract attention from the video              A number of processes were ongoing as the user was
task.                                                                 viewing/rating rating each video. For example, the following
                                                                      videos to be rated next start would begin loading in the
   Once each video finished playing, it disappeared, revealing        background, as described in the previous section. During the
the rating interface shown in Fig. 6(b). A continuous bar             training process, the play duration of each video was measured
allowed the workers to rate the quality of the videos, where          to assess the workers’ play capability. There are many ways
a Likert-like scale with 5 marks; Bad, Poor, Fair, Good,              that stalls could occur while a video is playing. If a worker’s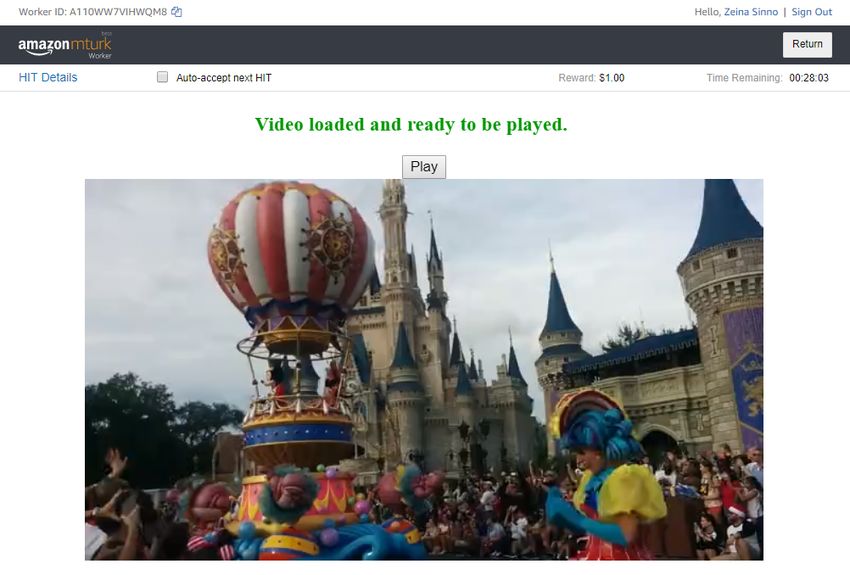
hardware CPU was slow, if other programs were running in the participants. About half of the participants were of each
the background (CPU is busy) or if the Internet connection gender (46.4% male versus 53.6% female).
was poor, then stalls or frame freezes could (and did) occur.
Required background tasks (such as loading the videos to
be played next) added processing overhead, while slower
Internet bandwidths required increased processing overhead,
further impacting foreground performance. During the training
process, 7 videos of 10 seconds duration each were played.
Importantly, the workers were not able to proceed further if
it took more than 15 seconds to play any of the 7 videos or
if any 3 of the 7 videos each required more than 12 seconds
to play. Adopting this strategy guaranteed that most of the
training videos were played smoothly, and also allowed us to
eliminate workers who were unlikely be able to successfully
complete the ‘hit.’
(a)
Step 5: Testing: After the training phase was completed, a
message was displayed indicating that the video rating phase
was about to begin. The testing phase was very similar to
the training phase; the videos were displayed, controlled and
rated in the same way. However, the testing phase required 43
videos to be rated, instead of 7.
Once a third of the study was completed, (10 testing videos
rated), if the progress of the worker was sufficient, then the
following message was displayed: “You have completed one
third of the overall study! Good Job :-) Keep up the Good
Work!” As shown in [32], providing workers with motivational
feedback can encourage them to provide work of better quality.
If the progress of the worker was slow (>10 minutes had
passed), the following message was displayed “You have (b)
completed one third of the overall study but your progress Fig. 7. Participant demographics (a) Countries where participants were
is slow. Are the videos taking too long to load? If so, make located; (b) Age distribution of the participants.
sure to close any programs running in the background.” A
similar message was displayed after two thirds of the study 2) Viewing Conditions: As with any crowdsourced study,
was completed. the participants operated under diverse viewing conditions;
Step 6: Exit Survey: Once the worker finished rating all including locations, visual correction, viewing distances,
of the videos, s/he is directed to the exit survey so that browser, display device, resolution, ambient lighting, and so
information regarding the following factors could be collected: on. Figure 8 presents statistics that we collected regarding
• the display, some of the aspects of subject viewing. As shown in Fig.
• viewing distance, 8(a), the majority of the participants had normal or corrected-
• gender and age of the worker, to-normal vision (e.g., glasses or contacts). A tiny percentage
• country where the task study was undertaken, (2.5%) had abnormal, uncorrected vision, and we excluded
• whether the worker needs corrective lenses, and if so, if their results. The participants used mostly laptop and desktop
s/he wore them. monitors to view the videos (Fig. 8(b)), and were mostly
positioned between 15 and 30 inches from the display (Fig.
The subjects were also asked whether they had any additional 8(c)). The subjects used 83 different display resolutions which
comments or questions. At the same time, information was ranged between 1280×720 and 3840×2160 pixels, as plotted
automatically collected regarding the display resolution. in Fig. 8(d). Of these, 31.15% had display resolutions of at
least 1920×1080, while the rest had lower resolution displays.
D. Human Subjects
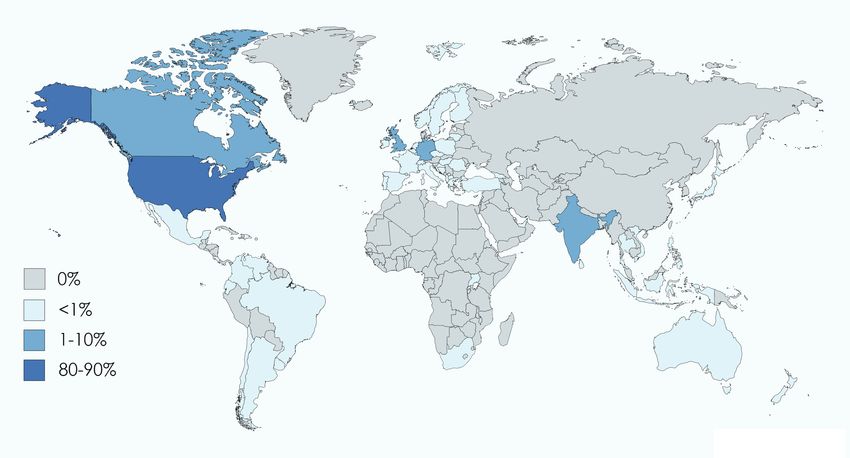
1) Demographic Information: The study participants were 3) Compensation: On average the subjects require 16.5
workers from AMT having approval rates exceeding 90% on minutes each to complete the study. The financial compen-
previous studies. A total of 4776 subjects took part in the sation given for completing the hit was one US dollar. We
experiment. The participants were from 56 different countries wanted to attract high-quality workers, hence maintaining a
as highlighted in Fig. 7(a) with the majority being located good AMT reputation was important. There exists a variety
in the United States and India (together accounting for 91% of forums, like TurkerNation.com, where AMT workers can
of the participants). Figure 7(b) shows the age distribution of share their experiences of AMT hits. These forums build a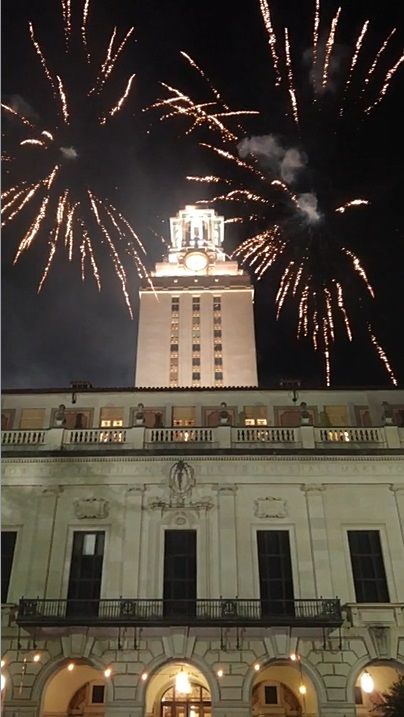
(a)                                                                (b)

                                          (c)                                                               (d)
        Fig. 8. Participant statistics: (a) Visual correction; (b) type of display device; (c) approximate viewing distance; (d) display resolution.

valuable sense of community among Turk workers, and helps                      important modifications, by repeating 4 of the videos (at
to protect them from unfair or bad practices. We noticed                       random relative spacings) to measure intra-subject consistency.
that a small number of workers were uneasy about being                         However this measurement problem was more complex in
unable to complete the study because of some of the eligibility                our study than in [17] since hardware-related stalls; although
requirements that we imposed. This was especially true when,                   greatly reduced in frequency, could still occur. Thus, a video
because of hardware inadequacy, subjects were asked to return                  and its time-displaced repeat could each present with or
the hit during training. We notified a worker that s/he would                  without stalls (of different locations and durations), thereby
be ineligible to continue working on the hit as soon as a                      greatly affecting their perceived quality. We noticed that the
problem was detected (viz. when a video stalled >5 seconds                     workers were generally providing very similar ratings on
or when 3 videos stalled >2 seconds during training). The                      videos viewed twice, when no stalls occurred, which we
training instructions did inform the subjects that they could                  attribute at least in part to only including participants having
be asked to return the hit if any eligibility requirement was                  high reliability scores. When stalls occurred, the results were
not met. We did not compensate any “less dedicated” worker                     harder to interpret. We did not want to reject the workers
who skipped any video by re-enabling the controls of the                       unfairly, hence we decided to adopt a strategy similar to
video; either by using Javascript commands or by modifying                     that used in the crowdsourced video annotation study [32],
browser settings, since we wanted to discourage workers                        where the authors compensated the workers regardless of
from attempting such practices. Interestingly, about 2% of the                 the consistency of their results, arguing that keeping a good
workers were “skippers” and were not compensated.                              reputation among workers was worth the overhead cost, and
                                                                               helped motivate the workers to produce high quality work.
   Adopting a strategy to reject subjects on the fly that were                 While we informed the workers that we reserved the right to
not providing consistent results was a more challenging issue.                 reject poor work, we also adopted this method.
The previous large image quality crowdsourced study in [17]
repeated some of the images to determine how consistent a
subject would rate the same distorted content, and rejected                       A summary of those participants that were not compensated
inconsistent subjects. We adopted a similar strategy, with                     is given in Table III.
TABLE III
S UMMARY OF THE PARTICIPANTS THAT WERE NOT COMPENSATED .
Participants Group Filtering Action(s)
Device, display, resolution and browser Asked to return the hit.
Ineligible Participants information captured after the study overview. Not compensated.
Bandwidth and hardware tests during training. Video scores not collected.
Not compensated.
Video Skippers Measure of the viewing duration.
Video scores excluded.
4) Subject Feedback: We provided the workers with space
to give comments in the exit survey. The feedback that we
received was generally very positive, which suggests that the
workers successfully engaged in the visual task.
Among the 4776 workers who completed the study, 32%
completed the additional comments’ box. Among those, 55%
wrote that they did not have any additional comments (e.g.
no comment, none, not applicable), 31% described the test
as good, nice, awesome, great, cool, enjoyable or fun. Some
(13%) of the workers provided miscellaneous comments, e.g,
Fig. 9. Distribution of the video stall durations.
that they noticed that some videos repeated, or provided ad-
ditional information about their display, or wondered how the
results would be used, or just thanked us for the opportunity subjects. As mentioned earlier, 2% of subjects attempted to
to participate. circumvent the experiment and did not watch the videos fully;
their results were also excluded.
IV. S UBJECTIVE DATA P ROCESSING AND R ESULTS
We also excluded the ratings of users whose computa-
Here we discuss handling of stalled videos, subject rejec- tion/display problems were so severe that at least 75% of their
tion, and the effects of the various experimental parameters on viewed videos stalled, which eliminated ratings of 11.5% of
the study outcomes. the subject population. The remaining subjects viewed at least
11 out of the 43 test videos (usually many more) without expe-
A. Video Stalls riencing any stalls. For the remaining video ratings, we applied
As mentioned earlier, we adopted a strategy to identify, the standard BT-500-13 (Annex 2, section 2.3) [22] rejection
during the training phase, those subjects that were the most portion on the ratings of videos, played without any stalls. We
susceptible to experiencing video stalls. While we were able found that only 23 subjects were outliers (0.5%) from among
to substantially mitigate the video stall problem, we were the entire population. This number seemed low that we also
not able to eliminate it entirely. Although we were able to studied the intra-subject consistency. By design, each subject
eliminate network-induced video stalls by requiring that all viewed 4 repeated videos during the test phase; we examined
videos pre-loaded before display, the computational power that the differences in these pairs of scores, as follows. The average
was available to each participants’ device to play and display standard deviation of all non-stalled videos was about 18. We
the videos was a stochastic resource that was a function of used this value as a threshold for consistency: given a non-
other processes executing in the background. While we asked stalled video that was viewed twice, the absolute difference
the workers to close any other windows, tabs or programs, in MOS of the two videos was computed. If it was below
there was no way to verify whether these instructions were fol- the threshold, then the rating for the video was regarded as
lowed. Moreover, other necessary foreground, and background consistent. Otherwise, it was not. We repeated this analysis
processes related to high-priority operating system tasks could across all the 4 videos across all subjects, and found that
affect performance. Since network connectivity can be time- the majority (∼99%) of the subjects were self-consistent at
varying and unpredictable, further overhead may also have least half of the time. It is important to emphasize that we
weighed on processor performance during poor connections. excluded the stalled videos from the consistency analysis and
Figure 9 plots the distribution of the video stall durations. when applying the subject rejection [22], because the presence
It can be observed 92% of the videos had no stalls at all or of any stalls rendered the corresponding subject ratings non-
had stalls that lasted for less than 1 sec. In fact, 77% of the comparable.
videos played with no stalls at all. After rejecting the outliers, we were left with about 205
opinion scores for each video, without stalls, which is a
B. Outlier Rejection substantial number. We computed the MOS of each video; Fig.
We first rejected the ratings of those users who indicated 10 plots the histogram of these obtained MOS following all
that they wore corrective lenses, but did not wear them during of the above-described data cleansing. It may be observed that
the course of the experiment. This accounted for 2.5% of all the MOS distribution substantially spans the quality spectrumwith a greater density of videos in the range 60-80.
(a)
Fig. 10. Distribution of MOS of the final set of video ratings.
C. Validation of Results
1) Golden Videos: During the testing phase of each sub-
ject’s session, 4 distorted videos taken from the LIVE VQA
Database [5] - the aforementioned “Golden Videos” - were
displayed at random placements to each worker to serve (b)
as a control. The mean Spearman rank ordered correlation
(SROCC) values computed between the workers’ MOS on Fig. 11. Plots of (a) error bars of MOS; (b) standard deviation of MOS, for
the set of videos viewed by all of the subjects.
the gold standard images and the corresponding ground truth
MOS values from the LIVE VQA was found to be 0.99. The
mean absolute difference between the MOS values obtained stalls). We observed similar behaviors across the rest of the
from our study and the ground truth MOS values of the videos.
“Golden Videos” was 8.5. We also conducted a paired-sampled 2) Stalls.: We computed the differential mean opinion
Wilcoxon t-test, and found that the differences between these scores (DMOS) between the non-stalled videos and the stalled
to be insignificant at p < 0.05. A recent experiment [33] videos:
showed that the MOS collected in subjective studies tends DM OS = M OS without stalls − M OS with stalls (1)
to vary with the overall quality of the presented videos. The
videos in LIVE-VQC database span a wider range of quality The DMOS is plotted against the video index in Fig. 12.
than the LIVE VQA Database [5], which only contains videos
contaminated by only a few synthetic distortion types each
at a few levels of severity. We believe that this explains the
consistent shift in MOS across the 4 golden videos, when the
outcomes from both experiments are compared.
The excellent agreement between the crowdsourced scores
and the laboratory MOS significantly validates our experimen-
tal protocol.
2) Overall inter-subject consistency: To study overall sub-
ject consistency, we divided the opinion scores obtained on Fig. 12. DMOS between the videos that played normally and the stalled
each video into two disjoint equal sets, then we computed videos.
MOS values on each set. We conducted on all the videos, Stalls nearly always resulted in a drop of MOS (for > 95%
then computed the SROCC between the two sets of MOS. This of the videos). Since it is difficult to assert a reason for a rare
experiment was repeated 100 times, and the average SROCC small increase in MOS on a given content when stalled, we
between the halves was found to be 0.984. simply regard those events as noise in the data.
D. Impact of Experimental Parameters While we have not included an analysis of the stalled video
ratings here, we still regard the data as valuable, even though
1) Number of subjects.: To understand the impact of the we were only able to collect the per-video total stall durations
number of subjects on the obtained MOS, we considered the (but not the number or locations of the stalls). In future work,
set of videos that were viewed by all subjects, and plotted the we plan to analyze stalled video ratings as well, with an eye
error bar plots of the associated MOS along with the standard towards helping guide the development of models that can
deviation as a function of the number of ratings (up to 2000), account for stall occurrences when predicting the video quality.
as shown in Fig. 11.
We found that increasing the sample size behind beyond 200 E. Worker Parameters
did not improve or otherwise affect the figures. We collected 1) High vs low resolution pools: The low resolution group
slightly more than 200 opinion scores for each video (without (subjects with display resolutions less than 1920×1080) rated475 of the 585 videos in our database. Whereas, the high TABLE IV
resolution pool (resolutions of at least 1920×1080) rated all S PEARMAN C ORRELATION OF THE MOS DISTRIBUTIONS OBTAINED
BETWEEN THE DIFFERENT AGE GROUPS .
585 videos. We studied the inter-subject agreement between
the two groups over the common set of videos. We computed 40
the SROCC over the MOS obtained from both groups and 40 0.79 0.94 0.96 1
statistical noise. The high inter-subject agreement between the
two groups is important, as it shows that the subjects from
the high resolution pool (accounting for 31.15% of the total The difference between the MOS distributions becomes more
population), who had seen videos of higher resolutions, did subtle as the difference in the age gap increases; participants
not rate the low resolution videos differently than did the low younger than 20 tended to assign lower quality scores than
resolution pool of participants. did participants older than 40.
2) Participants’ Resolution: As can be observed in Fig.
8(d), the two dominant resolution groups were 1366x768 and V. P ERFORMANCE OF V IDEO Q UALITY P REDICTORS
1920×1080. The other resolutions occurred less frequently As mentioned earlier in the paper, we conducted this study
(less than 10% of the time). We studied the influence of with the aim to advance VQA research efforts, by providing a
resolution on the distribution of MOS for the two most database that closely represents distorted videos encountered
dominant resolutions. The SROCC between the two classes in the real world, along with a large number of accurate
was 0.95, while the mean difference in MOS between the two human opinions of them. In recent years, there has been
sets was close to zero. This result further supports our belief numerous efforts to develop blind VQA models. Noteworthy
that the participants’ display resolutions did not significantly examples include simple frame-based Natural Scene Statistics
impact the video quality ratings they supplied. (NSS) based models, NIQE [36] and BRISQUE [37], as well
3) Participants’ Display Devices: Laptops and computer as more sophisticated predictors that incorporate more com-
monitors most often used as display devices (Fig. 8(b)). We plex information such as motion. These include V-BLIINDS
also studied the influence of the display device, and found [38], VIIDEO [39], the 3D-DCT based NR-VQA predictor
that it did not noticeably impact the MOS either (the SROCC described in [40], the FC model [41], the statistical analysis
between the two groups was 0.97 and the mean difference in model in [42], and the convolutional neural network model in
the MOS was close to 1). [43].
4) Viewing Distances: Another parameter that we studied To demonstrate the usefulness of our database, we evaluated
was the reported viewing distance. There were three cate- the quality prediction performance of a number of leading
gories: small (30 inches) viewing distances as shown in Fig. 8(c). We NIQE[36] and VIIDEO [39] are training-free models capable
found that the viewing distance had only a small effect on the of outputting quality scores on video. V-BLIINDS [38] and
distribution of MOS. The SROCC between the three categories BRISQUE [37], require training hence we learned mappings
ranged between 0.91 and 0.97, while the average difference in from their feature spaces to the ground truth MOS, using a
the MOS was less than 1. support vector regressor (SVR) [44] that has been successfully
5) Other demographic information: We also analyzed the deployed in many prior image and video quality models. We
impact of subjects’ demographics on the distribution of MOS. used the LIBSVM package [45] to implement the SVR with
First, we did not find noticeable differences between the MOS a radial basis function (RBF) kernel and to predict the MOS.
distributions across the male and female populations. The We applied a 5-fold cross validation technique as described
SROCC between the two gender classes was 0.97, and the in [46]. To predict quality scores over the entire database, we
average difference between the MOS was about 2; female aggregated the predicted values obtained from each fold. The
participants tended to give slightly lower scores as compared NIQE [36] features were computed on non-overlapping blocks
to male participants. It is possible that this might be attributed of size 96×96, then the computed NIQE distance is computed
to biological differences in the perceptual systems between of over frames and averaged over time, similar to how it was
the two genders; for example, it has been reported that females originally implemented in V-BLIINDS [38]. BRISQUE [37]
are more adept at distinguishing shades of color [34]. was calculated over frames and averaged in time.
Age did impact the MOS distribution. We compared the Figure 13 presents scatter plots, of NIQE [36] and VIIDEO
distributions of MOS for the four age ranges, and found [39] quality predictions, and V-BLIINDS [38] and BRISQUE
that younger participants as a group delivered lower opinion [37] predictions obtained after the 5-fold cross validation.
scores than did older participants. These differences might be Since NIQE provides a distance measure that increases as
attributed to young participants having better vision [35], or the video becomes more distorted, we will instead analyze
it might related to differing expectations of younger and older the quantity -NIQE for simpler visual comparison with other
viewers. As it can be observed in Table IV, the larger the models. As may be observed in Fig. 13(a), the predicted
difference between the age groups, the lower the SROCC. VIIIDEO scores correlated poorly with the ground truth MOS,(a) (b)
(c) (d)
Fig. 13. Scatter plots of the predicted quality scores versus MOS for four NR VQA models; (a) VIIDEO; (b) NIQE; (c) BRISQUE; (d) V-BLIINDS.
while for the other models followed regular trends against the this problem in the span of the current report, or resolve it,
MOS, as shown in Fig. 13(b), 13(c) and 13(d). the results are reported on a subset of 553 out of the 585
videos. Note that computing the results on this subset led to a
We used three performance metrics to quantify the perfor- slim increase in the performance of NIQE [36] and BRISQUE
mance of the different VQA models. First, we computed the [37]. VIIDEO’s code [39]’s would not run successfully on 3
Pearson Linear Correlation Coefficient (PLCC) between the videos so we report the results for it on the remaining 582
predicted quality values and MOS distributions, after applying videos. The results reported for NIQE [36] and BRISQUE
a non-linear mapping as prescribed in [47] to the predicted [37] are on the full database, since these algorithms could
quality values. Second, we computed the Root Mean Squared run successfully on all the videos. As may be observed, V-
Error (RMSE) between the two distributions. Finally, we BLIINDS supplied the best performance in terms of the three
computed the SROCC values between the predicted quality performance metrics. However, there remain ample room for
values and MOS values. When evaluating V-BLIINDS [38] improvement, suggesting the need for developing better NR
and BRISQUE [37], we randomly divided the videos into VQA models, capable of better assessing authentic, real-world
two disjoint sets (80%-20%). We used the larger set for video distortions.
training and the other one for testing, then we normalized our
features, and fed them into the SVR module [44] to predict the VI. C ONCLUDING R EMARKS AND F UTURE W ORK
MOS. We repeated this process 100 times, and computed the We have described the construction of a new “in the
median PLCC, SROCC and RMSE values. A summary of the wild” video quality database, LIVE-VQC, containing 585
results obtained over all the models is given in Table V. We videos of unique contents, and impaired by authentic distortion
could not run V-BLIINDS [38] successfully on all the videos, combinations, captured by 80 users around the globe using
especially at lower resolutions. Unable to trace the source of 43 different device models. We also designed and built aYou can also read