Last interglacial sea levels within the Gulf of Mexico and northwestern Caribbean Sea - ESSD
←
→
Page content transcription
If your browser does not render page correctly, please read the page content below
Earth Syst. Sci. Data, 13, 1419–1439, 2021
https://doi.org/10.5194/essd-13-1419-2021
© Author(s) 2021. This work is distributed under
the Creative Commons Attribution 4.0 License.

                  Last interglacial sea levels within the Gulf of
                    Mexico and northwestern Caribbean Sea
                                                    Alexander R. Simms
           Department of Earth Science, University of California Santa Barbara, Santa Barbara, CA 93106, USA
                             Correspondence: Alexander R. Simms (asimms@geol.ucsb.edu)

                               Received: 26 August 2020 – Discussion started: 28 September 2020
                        Revised: 23 February 2021 – Accepted: 23 February 2021 – Published: 1 April 2021

      Abstract. During the last interglacial (LIG) the volume of additional water in the world’s oceans was large
      enough to raise global sea levels about 6–9 m higher than present levels. However, LIG sea levels vary regionally
      and those regional differences hold clues about the past distribution of ice sheets and local rates of subsidence
      and tectonic uplift. In this study, I used a standardized database template to review and summarize the existing
      constraints on LIG sea levels across the northern Gulf of Mexico and Caribbean shoreline of the Yucatán Penin-
      sula. In total, I extracted 32 sea-level indicators including the insertion of 16 U-series ages on corals, 1 electron
      spin resonance age, 2 amino acid racemization ages, and 26 luminescence ages. Most dated sea-level indicators
      for the northern Gulf of Mexico are based on optically stimulated luminescence (OSL) ages of beach deposits of
      a mappable LIG shoreline. This shoreline extends from the Florida Panhandle through south Texas but is buried
      or removed by the Mississippi River across most of Louisiana. A similar feature is observed in satellite images
      south of the Rio Grande within the Mexican portions of the Gulf of Mexico but has yet to be dated. Elevations
      measured on portions of this feature close to the modern coast point to sea levels less than 1 m to ∼ 5 m higher
      than present for much of the northern Gulf of Mexico. However, a few, albeit undated, portions of the same
      shoreline located at more inland locations point to sea levels up to +7.2 m, attesting to up to 7 m of differential
      subsidence between the inland and coastal sites.
         Across the Yucatán Peninsula, U-series dating of corals has provided the main index points for LIG sea levels.
      Other carbonate coastal features such as beach ridges and eolianites have also been described but rely on corals
      for their dating. The maximum elevation of the LIG coral-based relative sea-level (RSL) estimates decrease from
      around +6 m across the Caribbean shoreline of the Yucatán Peninsula near Cancún, Mexico, to as low as −6 m
      to the south beneath the southern atolls of Belize, although discussion continues as to the validity of the ages
      for these southern corals. If these lower-elevation corals are LIG in age, their below-present elevations may be a
      result of vertical motion along faults dipping into the Cayman Trough. South of Belize only one purported LIG
      coral has been dated on the Isla de Roatán off the coast of Honduras at a likely tectonically uplifted elevation of
      37.2 m. Thus the elevation of LIG sea levels within the inland siliciclastic shorelines of Guatemala and Honduras
      as well as the southwestern Gulf of Mexico remains poorly constrained and a potential venue for future research.
         The database described in this paper is available open access in spreadsheet format as Simms (2020), at this
      link: https://doi.org/10.5281/zenodo.4556163.

Published by Copernicus Publications.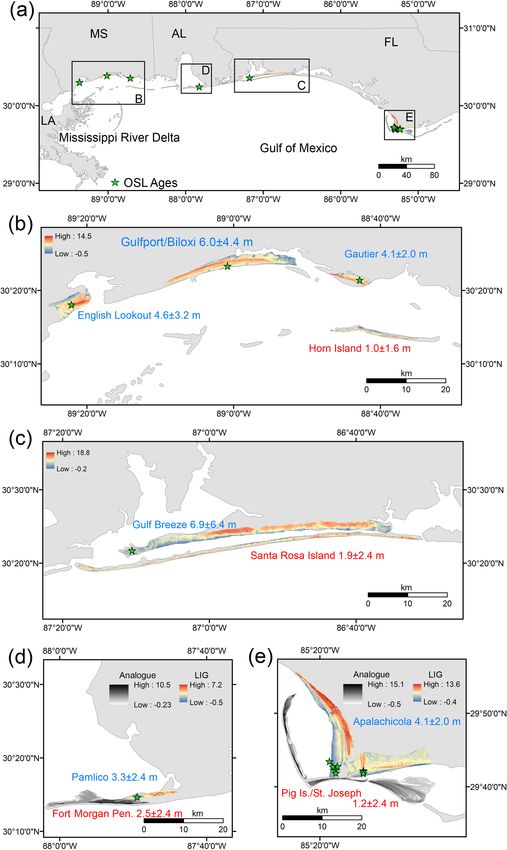
1420                  A. R. Simms: Last interglacial sea levels within the Gulf of Mexico and northwestern Caribbean Sea

1   Introduction                                                   2     Background

During the last interglacial (LIG) Earth experienced global        2.1    Geologic overview
sea-surface temperatures on average 0.7 ± 0.6 ◦ C warmer
than today (McKay et al., 2011) with global average sea lev-       The region of interest covered by this review contains two
els reaching 6–9 m higher than current levels (Kopp et al.,        contrasting types of coastlines with respect to depositional
2009; Dutton et al., 2015). As such it provides a possible         settings and climate at the present and by extension during
analogue for what the future may bring to global coastlines        the LIG. Along the northern and western Gulf of Mexico, the
(Dutton and Lambeck, 2012). However, debate continues as           coastline is dominantly siliciclastic with the LIG paleoshore-
to the origin of the 6–9 m of excess meltwater with Greenland      lines marked by sandy paleo-raised beaches and potentially
and West Antarctica as the two most likely candidates (Dut-        paleo-barrier islands (Price, 1933; Otvos, 1972b). Across
ton et al., 2015). One method commonly applied to deter-           the northern Gulf of Mexico, tides are diurnal and microti-
mining the hemispheric origin for meltwater during the past        dal with tidal ranges generally 0.4 to 0.6 m but approaching
is sea-level fingerprinting (Clark et al., 2002). Sea-level fin-   1 m within the Florida Panhandle (Stumpf and Haines, 1998;
gerprinting works on the premise that glacial-isostatic adjust-    Livsey and Simms, 2013). Wave energy is generally low with
ment (GIA) results in differences in relative sea-level histo-     wave heights averaging less than 1 m (Hwang et al., 1998),
ries at different locations across the globe (Ferrel and Clark,    with the exception of during the passage of tropical cyclones,
1976; Hay et al., 2014). The nature of this variability is a       which enter the Gulf of Mexico on average every 1.6 years
function of the past distribution of ice sheets and can thus       (Parisi and Lund, 2008), and winter cold fronts originating
be used for determining the origin of past meltwater contri-       from North America. The climate across the northern Gulf of
butions (Clark et al., 2002). In addition, the elevation of sea    Mexico varies from arid to semi-arid along the US–Mexico
levels during the LIG is also commonly used as a datum for         border to humid temperate conditions along the eastern Gulf
determining rates of tectonic uplift and loading-induced sub-      of Mexico (Thornthwaite, 1948).
sidence (e.g., Simms et al., 2016; Paine, 1993). However, due         The northern Gulf of Mexico is a passive margin, but, lo-
to the regional variability caused in part by GIA, relative sea-   cally, Quaternary growth faults have been identified (Yea-
level reconstructions are needed on a local basis for their use    ger et al., 2019). However, most known active growth faults
in determining vertical motions of the land.                       are located seaward of the LIG shoreline, although an-
   This work is part of the World Atlas of Last In-                thropogenic activities such as groundwater and hydrocar-
terglacial Shorelines (WALIS), a community effort to               bon withdrawal have potentially contributed to motion along
construct a database of LIG relative sea-level indica-             faults landward of the modern shoreline (White and Morton,
tors (https://warmcoasts.eu/world-atlas.html, last access:         1997 ; Qu et al., 2015). The passive margin is experiencing
29 March 2021). Within WALIS, this paper aims to sum-              subsidence across most of the coastline. Attempts to quan-
marize the current knowledge on LIG shorelines and rel-            tify long-term subsidence usually rely on the elevation of the
ative sea levels (RSLs) for the Gulf of Mexico and far             LIG (Paine, 1993; Simms et al., 2013) and are on the or-
western Caribbean. This summary includes data collected            der of 0.05 mm yr−1 with locally higher rates around large
on LIG shorelines from the Florida Panhandle to the coast          deltaic centers (Dokka et al., 2006). Similar to motion along
of Honduras (Fig. 1). In total, this review covers 62 pa-          growth faults, groundwater and hydrocarbon extraction have
pers and 32 sites with constraints on paleo-sea levels. This       led to increased rates of subsidence during historical times
included the insertion of 16 U-series ages on corals, 1            (Morton et al., 2006). Compared to the Texas and Louisiana
electron spin resonance (ESR) age, 2 amino acid racem-             coasts, less is known about the vertical motions of the Mis-
ization (AAR) ages, and 26 optically stimulated lumines-           sissippi, Alabama, and Florida coasts. Few faults have been
cence (OSL) ages into the WALIS database. The database             mapped although the area is not free of seismicity (Gomberg
for the region mentioned above is available open ac-               and Wolf, 1999). Otvos (1981) suggests the coast is uplifting
cess in spreadsheet format as Simms (2020), at this link:          very slowly over the Quaternary, but estimates for the rate of
https://doi.org/10.5281/zenodo.4556163. Database field de-         uplift are lacking.
scriptors are available from Rovere et al. (2020) at this             Farther to the south along the Yucatán Peninsula and south
link: https://doi.org/10.5281/zenodo.3961543. The following        to Honduras, the coastline is marked by increasingly more
paragraphs give an overview of the geologic and literature         tropical climates as well as a mixed siliciclastic–carbonate
background as well as present the data points included in the      coastline with LIG shorelines largely marked by fossil coral
database and discuss the main opportunities for future work.       reefs and eolianites (Ward and Brady, 1979; Gischler and
                                                                   Hudson, 1998; Blanchon et al., 2009). The coastline is more
                                                                   carbonate-dominated at the northeastern tip of the Yucatán
                                                                   Peninsula with an ever increasing influence of siliciclastics
                                                                   to the south such that within Honduras the carbonate en-
                                                                   vironments are restricted to the offshore islands of Roatán

Earth Syst. Sci. Data, 13, 1419–1439, 2021                                        https://doi.org/10.5194/essd-13-1419-2021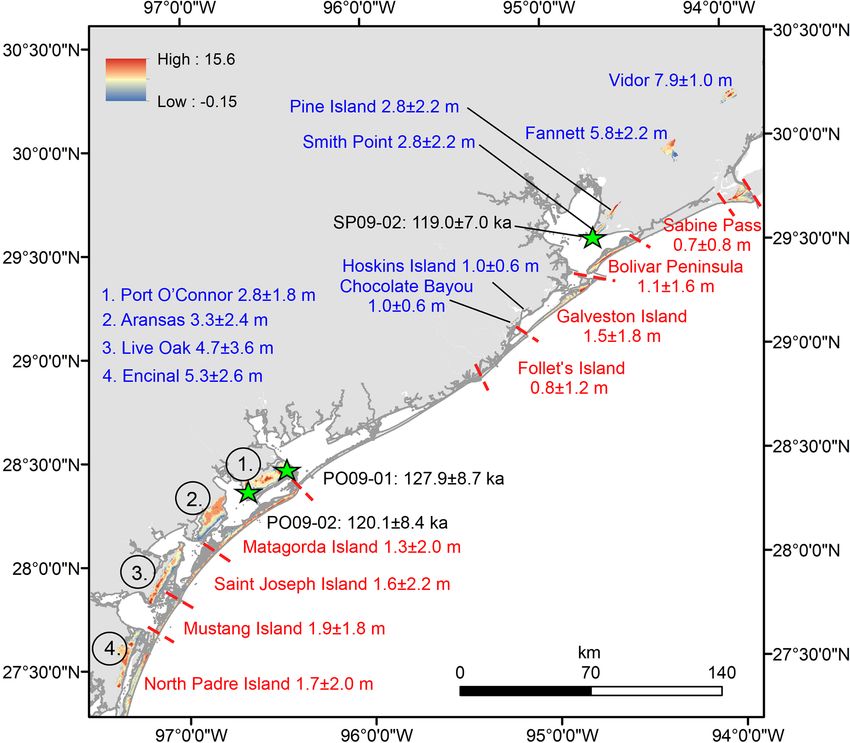
A. R. Simms: Last interglacial sea levels within the Gulf of Mexico and northwestern Caribbean Sea 1421
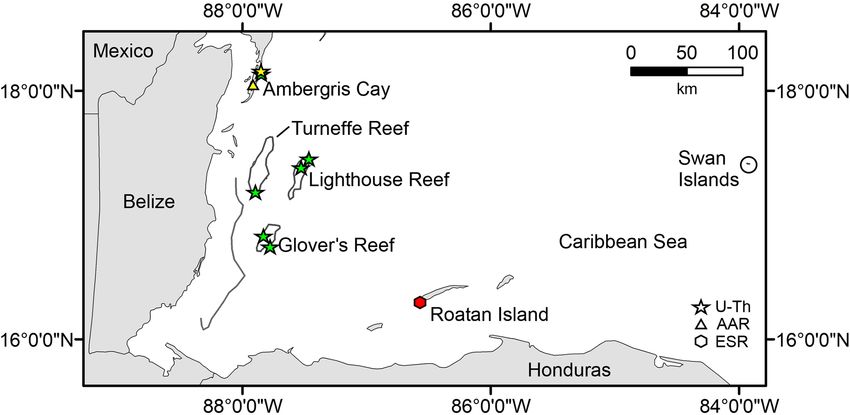
Figure 1. Map illustrating the location of the figures and locations mentioned in the text. LA: Louisiana; MS: Mississippi; AL: Alabama;
FL: Florida.
and the Swan islands (Fig. 1). This change is a reflection mon (LIG) shoreline. MacNeil (1949) mapped similar Pleis-
of the Maya Mountains and interior highlands that hug the tocene raised beach/barrier islands across western Florida.
shore across portions of southern Belize and Honduras, re- However, MacNeil (1949) separated features of similar age
spectively, as the coastline leaves the stable platform of the into more than one stage of Pleistocene shoreline devel-
Yucatán Peninsula and nears the orogenic belts marking the opment and potentially mixed others (Otvos, 1995). Over
North American–Caribbean plate boundary (Pindell and Bar- the next several decades discussion continued over the age
rett, 1990). To the north, for most of its extent, the Gulf of of the raised beach/barrier island features mapped by Price
Mexico and northern Yucatán shorelines are located along (1933) and MacNiel (1949), with some suggestions of a mid-
a passive margin except near the southwestern corner of Wisconsin (∼marine isotope stage (MIS) 3) age (Bernard
the Gulf of Mexico where the Trans-Mexican Volcanic belt and LecBlanc, 1965; Lundelius, 1972; Wilkinson et al.,
butts up against the Gulf (Ortega-Gutierrez et al., 1992). 1975; Shideler, 1986), a Sangamon (LIG) age (Price, 1933,
Like the northern Gulf of Mexico, the tidal range is rela- 1958; Shepard and Moore, 1955; Otvos, 1972a, b, 1995;
tively low, with values ranging from 0.1 to 0.8 m (Rankey Winker and Howard, 1977; Morton and Price, 1987; Tan-
et al., 2021). Trade winds drive the dominant wind direc- ner and Donoghue, 1992; Paine, 1993), and possibly even
tion from the northeast with average offshore wave heights portions of it dating to the middle Holocene (Donoghue and
of ∼ 2.5 m (Rankey et al., 2021). Similar to the northern Gulf White, 1995; Blum et al., 2002, 2003). Some of this confu-
of Mexico, wave heights increase during the passage of cold sion may have stemmed from stratigraphic correlations with
fronts, termed “Nortes” within Mexico, and tropical cyclones similar Pleistocene shallow-marine and beach deposits in the
(Ojeda et al., 2017). subsurface (Wilkinson, 1975; Shideler, 1986). Early attempts
to obtain absolute ages of the feature relied on radiocarbon
dating (Schnable and Goodell, 1968; Shideler, 1986; Otvos
2.2 Literature overview and Howat, 1996) but produced near finite ages, adding to
Across the northern Gulf of Mexico, Price (1933) was the confusion. However by the early 2000s a LIG origin was
one of the first to recognize the raised beach/barrier is- largely agreed upon thanks to a pair of studies by Blum et
land shoreline across Texas now recognized as the Sanga- al. (2003) and Otvos (2005), who provided the first abso-
https://doi.org/10.5194/essd-13-1419-2021 Earth Syst. Sci. Data, 13, 1419–1439, 2021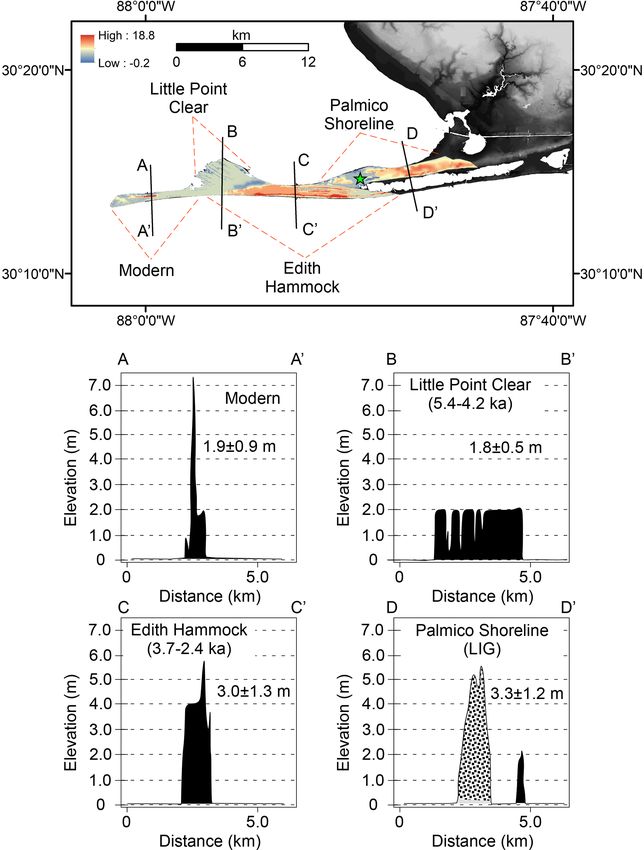
1422                  A. R. Simms: Last interglacial sea levels within the Gulf of Mexico and northwestern Caribbean Sea

lute ages consistent with a LIG origin. Using OSL, they ob-        3.1     Gulf of Mexico
tained ages varying between 116.1 and 137.8 ka along the
Mississippi and Alabama portions of the paleoshoreline but         The LIG shoreline across most of the northern Gulf of Mex-
not without a few other spurious thermoluminescence ages.          ico formed what is locally known as the Ingleside shoreline
Burdette et al. (2012) and Simms et al. (2013) soon added          across Texas (Price, 1933) and the Gulfport shoreline across
additional OSL ages supporting a LIG origin to the feature         Mississippi, Alabama, and the panhandle of Florida. Buried
in Florida and Texas, respectively.                                presumed LIG deposits have been identified beneath the Mis-
   Across the Yucatán, most early work on the carbonate            sissippi River (e.g., Prairie Terrace; Fisk, 1944), but their
shorelines was conducted by graduate students of J. L. Wil-        sea-level significance is not well constrained (Otvos, 2005),
son of Rice University in the 1960s and 1970s (Ward, 1985).        and their elevations are likely significantly contaminated by
Purdy (1974) was one of the first to describe in situ corals       sediment-loading-induced subsidence.
of Acropora palmata within pre-Holocene limestone reefs
of present-day Belize. These studies along with the work           3.1.1    Northwestern USA Gulf of Mexico (Texas)
of a handful of other groups led to several publications dis-
cussing the sedimentology and diagenesis of the Yucatán’s          Along the Texas coast, the Ingleside shoreline is composed of
late Pleistocene calcarenites (Ward and Brady, 1976), stran-       a +1 to +8 m high, 3 to 16 km wide shore-parallel sand de-
dlines (Ward and Brady, 1979; Lauderdale et al., 1979), and        posit up to ∼ 30 m thick (Wilkinson et al., 1975; Paine, 1993;
reefs (Purdy, 1974; Tebbutt, 1975; Ward and Halley, 1985),         Simms et al., 2013). Cores through the feature contain many
but ages on these rocks were first conducted by Szabo et al.       shell beds, intact oyster reefs, and bedding stratification in-
(1978) within Mexico and by Gischler et al. (2000) within          dicative of an old beach system (Paine, 1993; Wilkinson et
Belize. Following the work of Jordan-Dahlgren (1997), Blan-        al., 1975). Its mixed transgressive and regressive nature sug-
chon et al. (2009) and Blanchon (2010) examined a particu-         gests it was deposited near the maximum shoreline transgres-
larly well exposed section of the Pleistocene reefs within a       sion of the LIG highstand in sea levels (Paine, 1993). It can
theme park near Playa del Carmen, Mexico. Blanchon et al.          be mapped intermittently from near Baffin Bay north to near
(2009) combined detailed stratigraphic sections through the        the Texas–Louisiana border (Fig. 1), although the age and
paleoreef within the park with new U–Th ages to place tight        depositional origin for the most eastern portions of the shore-
constraints on sea levels during the LIG. With this frame-         line mapped by Fisher et al. (1973) are still debated (Otvos
work, they argued for two distinct levels of higher-than-          and Howat, 1997). In many locations, its surface still main-
present RSLs within the LIG. Mazzullo (2006) added a hand-         tains the ridge and swale topography of old beach ridges
ful of additional LIG age constraints to the reefs in Belize via   (Fig. 2). Simms et al. (2013) obtained six OSL ages from
amino acid racemization and U-series ages of corals, while         four cores up to ∼ 5 m in length from two portions of the In-
Mosley et al. (2013) used speleothems to constrain late Pleis-     gleside shoreline. Three of the ages came from the core of
tocene sea levels within the Mexican portions of the Yucatán       the sand deposit, while three additional ages were obtained
Caribbean Sea.                                                     from the reworked top veneer of the feature. The three ages
                                                                   from the core of the feature were 119.0 ± 7.0 (WALIS LUM
3   Sea-level indicators                                           ID no. 145), 120.1 ± 8.40 (WALIS LUM ID no. 119), and
                                                                   127.9 ± 8.70 ka (WALIS RSL ID no. 118) (Simms et al.,
In the following discussion, I use “WALIS RSL ID” followed         2013). The younger ages ranged between 1.3 and 57.0 ka,
by a number to identify each of the RSL indicators discussed       and all coincided with time periods of known heightened ae-
in the text that has been entered into the WALIS database.         olian activity (Otvos, 2004; Simms et al., 2013).
The number corresponds with the WALIS database identifi-              The elevation of the Ingleside shoreline varies across its
cation numbers. Similarly, I use “WALIS U-series ID” fol-          expression in Texas. Paine (1993) provided one of the first
lowed by a number to identify each of the RSLs identified          attempts at a rigorous quantitative estimate of RSL change at
from a single coral discussed in the text that has been en-        the last interglacial based on the Ingleside shoreline in Texas.
tered into the WALIS online database. I also use “WALIS            In order to quantify subsidence across the Gulf of Mexico at
LUM ID”, “WALIS ESR”, or “WALIS AAR ID” followed                   different timescales, Paine (1993) noted the maximum ele-
by a number to reference optically stimulated luminescence         vation of shell horizons in boring descriptions from a com-
ages, electron spin resonance ages, or amino acid racemiza-        pilation of older geotechnical reports was 2 m above modern
tion ages, respectively, discussed in the text that have also      sea level (general definition), with the highest in situ oysters
been entered into the WALIS online database.                       (Crassostrea virginica) at an elevation of 0.5 m. The indica-
                                                                   tive meaning of Crassostrea virginica is not well constrained,
                                                                   but restoration efforts suggest they prefer water depths of 0.5
                                                                   to 3 m or −1.75 ± 1.25 m along the US Gulf Coast (Barnes
                                                                   et al., 2007; Pollack et al., 2012), although the lower bounds
                                                                   may simply reflect the scarcity of water depths more than 3 m

Earth Syst. Sci. Data, 13, 1419–1439, 2021                                          https://doi.org/10.5194/essd-13-1419-2021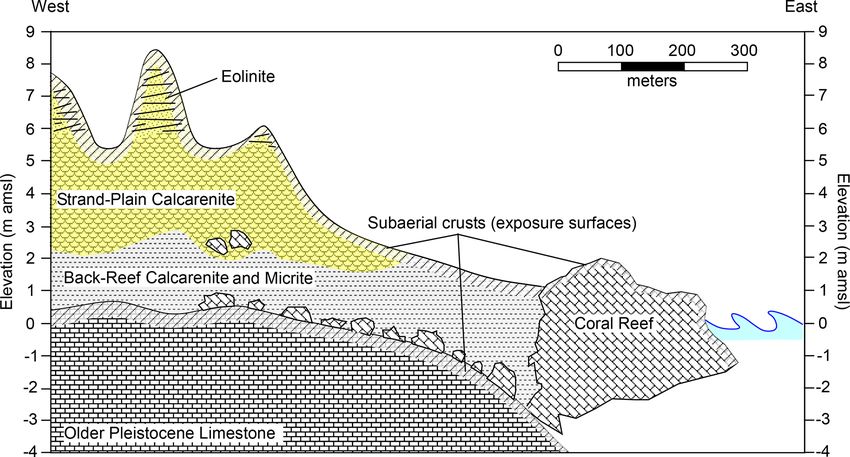
A. R. Simms: Last interglacial sea levels within the Gulf of Mexico and northwestern Caribbean Sea                               1423

                                                                     ∼ 1 m above modern sea levels along the Texas coast (Brown
                                                                     et al., 1976; Rodriguez et al., 2004; Simms et al., 2006). The
                                                                     shell deposits may have originated in deeper water. Although
                                                                     sandy deposits (e.g., upper-shoreface sands) along the mod-
                                                                     ern central Texas coast extend into water depths as great as
                                                                     12 m (Rodriguez et al., 2001), they likely do not represent de-
                                                                     position within water depths any greater than 2.5 m as water
                                                                     depths greater than that would place coeval Ingleside eolian
                                                                     deposits underwater (Wilkinson et al., 1975). Taken together
                                                                     this suggests an indicative meaning for the shell horizons of
                                                                     −0.75±1.75 m. Assuming the Ingleside eolian cap was origi-
                                                                     nally eolian in origin and simply reworked by later dry phases
                                                                     of climate (Otvos, 2004; Simms et al., 2013) and the ele-
                                                                     vations reported by the Texas Highway Department and US
                                                                     Navy have an error of ±1 m, I assign a LIG sea-level range
                                                                     of +2.75 ± 2.0 m for the shell horizons mentioned by Paine
                                                                     (1993) (WALIS RSL ID no. 915). For the in situ oysters, us-
                                                                     ing an indicative range of −1.75 ± 1.2 m suggests LIG sea
                                                                     levels greater than +2.25 ± 1.6 m, assuming an error of±1 m
                                                                     for the elevations reported by the Texas Highway Department
                                                                     and the US Navy. We report the higher of these two sea-level
                                                                     estimates in the WALIS database but note that they are within
                                                                     error of one another.
                                                                        As it is difficult to assign a strict indicative meaning to the
                                                                     Ingleside deposits as presently described, Simms et al. (2013)
                                                                     took a different approach to estimate paleo-RSL from the In-
                                                                     gleside by mapping the feature in a geographical informa-
                                                                     tion system (GIS) software package using soil survey maps
                                                                     and determining its elevation from the United States Geo-
                                                                     logical Survey’s (USGS) National Elevation Dataset (NED)
                                                                     digital elevation model (DEM). The NED has a published
Figure 2. Aerial photographs illustrating well-preserved beach       95th percentile confidence level of 3.0 m (Gesch et al., 2014)
ridges on the LIG shorelines within (a) the Gulfport shoreline       but is more accurate (1.94 m) along regions surveyed by li-
near the Apalachicola delta (Florida) (USGS, 1993) and (b) the       dar, which includes most of the coastal counties (Gesch et
Fannett (Texas) segment of the Ingleside shoreline (Texas Gen-
                                                                     al., 2014). Assuming the Ingleside was a LIG barrier island
eral Land Office, 1938) in addition to the potential LIG shoreline
equivalents to the Ingleside and Gulfport shorelines (c) northeast
                                                                     (Price, 1933; Paine, 1993) similar to the modern barrier is-
of Soto la Marina, Tamaulipas, Mexico (Maxar Technologies), and      lands of the Texas Gulf Coast, which is still a matter of dis-
(d) south of Tampico in Veracruz, Mexico (CNES/Airbus). Images       cussion (Otvos, 2018, 2020), Simms et al. (2013) subtracted
from ©Google Earth.                                                  the average elevation of the closest modern equivalent bar-
                                                                     rier island from the elevation of each of the Ingleside barrier
                                                                     island segments of the Texas coast. Assuming the preserved
within Gulf of Mexico bays (Barnes et al., 2007). The Ingle-         Ingleside deposits formed when RSLs reached their highest
side shoreline attains higher elevations, but a portion of that      during the LIG, as many of them contained preserved beach
elevation is late Pleistocene coastal dunes that covered the         ridges (Fig. 2b), and erosion led to little loss in elevation of
underlying beach deposits during progradation shortly after          the feature, the resulting calculations lead to a range of RSL
the time of beach deposition (Wilkinson et al., 1975). Paine         differences at the LIG across the Texas coast from a high of
(1993) subtracted the 2 m of elevation from a global 8 m sea-        7.2 m for the Vidor segment (WALIS RSL ID no. 778) to a
level highstand at the LIG to suggest a long-term subsidence         low of 0.2 m for the Hoskins Island segment (WALIS RSL
rate of 0.05 mm yr−1 for the central Texas coast. Although           ID no. 774) (Fig. 3). However, the Vidor segment (Orange of
the indicative meaning of the shell horizon is poorly con-           Otvos, 1997) and the Hoskins Island segments may not rep-
strained, as it comes from Texas Highway Department and              resent barrier islands (Otvos, 1997) and have yet to be dated.
US Navy boring descriptions (Paine, 1993), it likely repre-          If the Vidor segment represents a different age or deposi-
sents deposition within a foreshore or barrier flat (landward        tional environment, then the highest non-contested LIG bar-
side of a barrier island dominated by washover processes)            rier island in East Texas would be the Fannett segment, which
environment, which do not extend to elevations of more than          has well-preserved beach ridge features, with an average el-

https://doi.org/10.5194/essd-13-1419-2021                                            Earth Syst. Sci. Data, 13, 1419–1439, 2021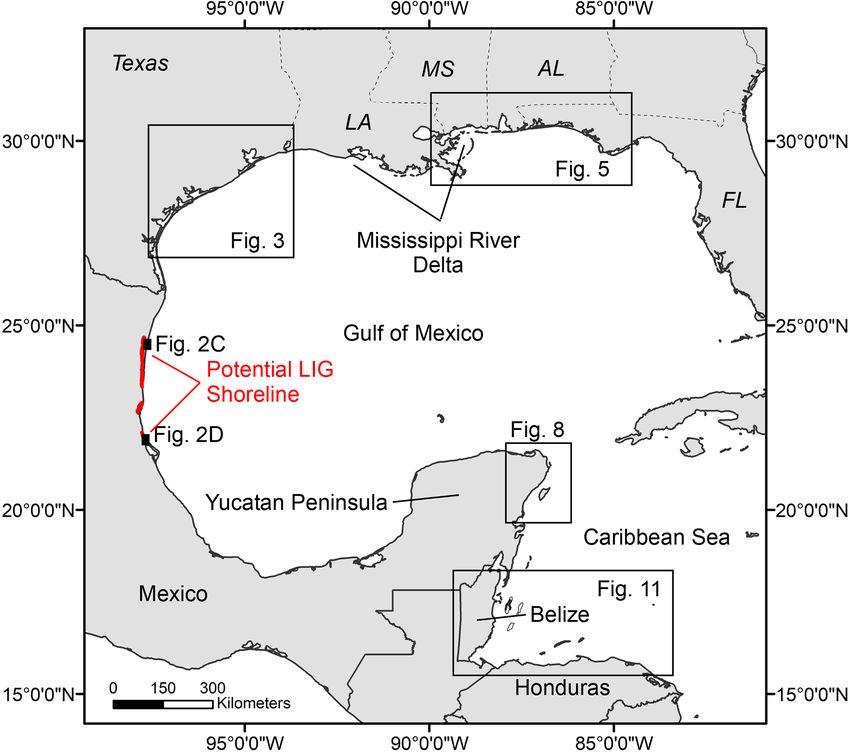
1424                    A. R. Simms: Last interglacial sea levels within the Gulf of Mexico and northwestern Caribbean Sea

Figure 3. Map of the Texas coast of the northwestern Gulf of Mexico showing the locations of the LIG Ingleside shoreline segments (blue
text) and modern barrier islands (red text) discussed in the text with their average elevations. Also shown as green stars and black text are the
optically stimulated luminescence ages obtained from the Ingleside shoreline.

evation of +5.8 m (WALIS RSL ID no. 777) (Otvos, 1997;                     timates of Simms et al. (2013) to 2 standard deviations plus
Simms et al., 2013). Regardless, variability in the elevations             an additional error term of ±2.0 m to account for errors in
of the LIG shorelines is more than 5 m, even after correcting              the DEM. Another assumption in the analysis of Simms et
for GIA-predicted variations across the Ingleside (Simms et                al. (2013) and of the extension of that analysis for the eastern
al., 2013). This variability was interpreted by Simms et al.               Gulf of Mexico below is that the modern and LIG equiva-
(2013) to represent differential subsidence across the Texas               lent barrier islands were both either transgressive or regres-
coastal plain with higher rates near the Brazos–Colorado                   sive barrier islands. One of the major geomorphic differences
delta complex. Simms et al. (2013) found a RSL difference                  between transgressive and regressive barrier islands is their
of 2.8 ± 4.9 m for the same segment of the Ingleside (Live                 widths as generally transgressive barrier islands are thinner
Oak; WALIS RSL ID no. 772) in which Paine (1993) found                     and lower than their regressive counterparts (Wallace et al.,
a shell horizon at an elevation of 2 m, which I assigned a                 2010; Otvos and Carter, 2013). In the absence of detailed sed-
RSL value of +2.75 ± 2.0 m (Willow Creek; WALIS RSL                        imentological descriptions of the individual LIG segments, I
ID no. 915), suggesting a reasonable result for the approach               use their widths as a reliability gauge of using a modern bar-
taken by Simms et al. (2013).                                              rier island’s average elevation as an analogue for their LIG
   Simms et al. (2013) assigned an elevation error in their                equivalent. For the Texas coast, the widths of the LIG barrier
analysis of 1 standard deviation of the DEM pixel elevations               islands are similar to their modern barrier islands equivalents
of the Ingleside segment and modern islands. They also did                 (Fig. 4), although some of the central Texas Ingleside seg-
not include an error term for the uncertainty in the DEM.                  ments are wider than their modern equivalents.
Given the assumptions in their analysis of no erosion of the
LIG features (either fluvial or eolian deflation), as well as
similar wave and wind climates and coastal sediment sup-                   3.1.2    Northeastern USA Gulf of Mexico
plies at the LIG compared to today (and thus average barrier
                                                                           The Gulfport shoreline, in some locations also known as
island elevations), this study takes a more conservative ap-
                                                                           the Pamlico shoreline, has a similar expression and eleva-
proach to the error by increasing the error for each of the es-
                                                                           tion as the Ingleside shoreline of Texas (Otvos, 1972b). It

Earth Syst. Sci. Data, 13, 1419–1439, 2021                                                   https://doi.org/10.5194/essd-13-1419-2021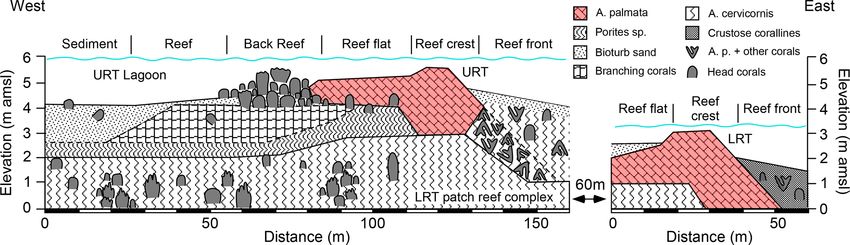
A. R. Simms: Last interglacial sea levels within the Gulf of Mexico and northwestern Caribbean Sea                                1425

Figure 4. Topographic profiles through selected portions of the Texas coast illustrating the elevation and width differences between the
Ingleside and modern barrier islands. See Fig. 3 for general locations.

rises between +5 and +9 m and can be traced from the                  ranged from 108.7±8.2 to 138.7±11.1 ka (WALIS LUM ID
Pearl River, Mississippi, to near the Apalachicola delta of the       nos. 149-165), with an average age of 125.3 ± 21.0 ka (error
Florida Panhandle (Otvos, 2005). It has been dated in four            is 2 standard deviations of the ages). Four attempts at dat-
general locations using OSL. Along the Mississippi coast,             ing the Gulfport shorelines along the eastern Gulf of Mexico
Otvos (2005) dated it in the city of Biloxi/Gulfport and Gau-         using thermoluminescence were less conclusive with ages
tier. OSL ages there were 117.2 ± 12.4 (WALIS LUM ID                  of ∼ 38.8 ± 3.7 to 103.0 ± 10 ka (not included in WALIS)
no. 146) and 124.0 ± 10.8 ka (WALIS LUM ID no. 147), re-              near the same location as the 117.2 ± 12.4 ka OSL age from
spectively. A third date in Mississippi near Bay Saint Louis          Biloxi/Gulfport (Otvos, 2005).
(English Lookout; WALIS LUM ID no. 200) returned an                      The original publications of Blum et al. (2003) and Otvos
older age of 160 ± 17 ka (Otvos, 2005). To the east at Fort           (2005) provide little information about the elevations of the
Morgan Peninsula near Mobile, Alabama, Blum et al. (2003)             Gulfport segments dated. However, Rodriguez and Meyer
obtained two OSL ages of 137.8 ± 34.4 (WALIS LUM ID                   (2006) did collect ground-penetrating radar (GPR) profiles
no. 168) and 133.5 ± 21.1 ka (WALIS LUM ID no. 168)                   through the beach ridges dated by Blum et al. (2003) on Fort
for the locally termed “Pamlico shoreline”. Farther to the            Morgan Peninsula but do not show the lines collected over
east in Florida the Gulfport shoreline has been dated in two          the LIG-aged deposits. However, they do report that the LIG
locations. In Gulf Breeze near Pensacola, Florida, Otvos              (Sangamon in their original publication) beach ridges (sensu
(2005) obtained an age of 116.1 ± 9.1 ka (WALIS LUM ID                Otvos, 2020) were 4–5 m in height, while the modern beach
no. 148). Near Apalachicola, Florida, Burdette et al. (2012)          ridges were 2–3 m in height. I thus assign a modern analogue
obtained 17 OSL ages from the Gulfport shoreline. The ages            value of 2.5 ± 1.0 m and a LIG elevation of 4.5 ± 0.5 m for

https://doi.org/10.5194/essd-13-1419-2021                                             Earth Syst. Sci. Data, 13, 1419–1439, 2021
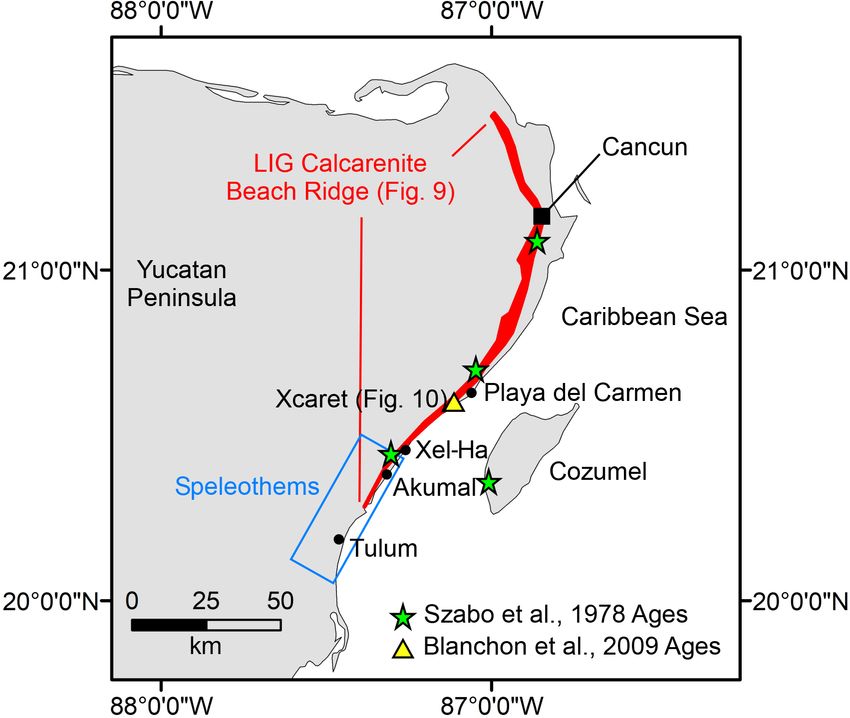
1426                  A. R. Simms: Last interglacial sea levels within the Gulf of Mexico and northwestern Caribbean Sea

the LIG beach ridge elevation. This suggests a LIG RSL of         vary more among the three Holocene phases than with the
+2.0±1.1 m (WALIS RSL ID no. 425). Burdette et al. (2012)         LIG (Fig. 7), likely reflecting the variability in sea levels and
used GPR to identify the transition point between overwash        wave climates at the time of their formation (e.g., Rodriguez
fan deposits or aeolian sand sheets and the underlying fore-      and Meyer, 2006; Donnelly and Giosan, 2008). In addition,
shore deposits to be at an elevation of 3.75 m. Subtracting out   the barrier island geomorphology is not as apparent for the
the ∼ 1 m elevation of the modern equivalent, they arrived at     Gulfport shoreline segments as it is for the Ingleside, nor are
a RSL estimate for LIG at the Apalachicola delta of +2.7 m        the analogue barrier islands as similar in width as the Ingle-
(they originally report +2.5 m; WALIS RSL ID no. 411). No         side segments from Texas. Thus using the larger error bars
error was reported by Burdette et al. (2012); thus I assign an    for this analysis seems warranted.
error of 1.0 m.
   As many of the LIG sites along the northeastern Gulf of        3.1.3    Mexican Gulf of Mexico
Mexico lack quantitative estimates of the elevation of RSL
at the LIG, and assigning an indicative meaning to the de-        A feature similar to the Ingleside appears to continue south
posits as currently described remains difficult, I followed the   along the Gulf of Mexico south of the USA/Mexico bor-
methods of Simms et al. (2013) to assign a RSL elevation          der to Soto la Marina, Tamaulipas (Price, 1958), and possi-
for the LIG. This estimate was determined by subtracting          bly farther south into Veracruz-Llave but has yet to be dated
the average elevations of the closest modern barrier islands      (Wilhelm and Ewing, 1972; Hernandez-Santana et al., 2016;
from the average elevations of the six segments of the Gulf-      Figs. 1 and 2). Near Soto la Marina these features are dotted
port shoreline dated with the assumption that they too rep-       with small ponds similar to the blowout features common to
resented barrier islands (Figs. 5 and 6; Table 1). Mapping        the Ingleside across Texas (Price, 1933; Otvos, 2004; Simms
the margins of the LIG features along the northeastern Gulf       et al., 2013). However, their LIG age has not been verified,
of Mexico using soil surveys is not as straightforward as it      and thus no data for these features have been input into the
is along the Texas coast due to the sandier nature of much        WALIS database. More work mapping and dating this poten-
of the northeastern Gulf of Mexico coastal plain and shelf        tial LIG shoreline is warranted.
(the Gulfport shoreline is not bordered along its inland mar-
gins by a muddy unit as the Ingleside is in Texas). From this     3.2     Yucatán Peninsula
approach I obtained RSL estimates at the LIG for the En-
glish Lookout, Gulfport/Biloxi, Gautier, Fort Morgan Penin-       Dated LIG beach ridges and reefs have been identified and
sula, Gulf Breeze (Florida), and Apalachicola sections of the     studied across many locations of the Yucatán coastlines of
Gulfport shoreline as +3.6 ± 4.6 (WALIS RSL ID no. 891),          Mexico and neighboring Belize (Fig. 8). Additional con-
+5.0 ± 5.5 (WALIS RSL ID no. 424), +3.1 ± 3.8 (WALIS              straints on LIG sea levels from the Yucatán have been re-
RSL ID no. 892), +0.9 ± 4.4 (alternative elevation assign-        ported based on speleothems within caves near the Mexican
ment for WALIS RSL ID no. 425), +5.0 ± 7.4 (WALIS RSL             LIG beach ridges and coral reefs. These are the subject of a
ID no. 893), and +2.9 ± 4.2 m (alternative elevation assign-      separate compilation within WALIS but are briefly discussed
ment to WALIS RSL ID no. 411), respectively (Table 1). The        with reference to the other data reviewed in this study.
value of +2.9 ± 4.2 m for Apalachicola agrees well with the
value obtained by Burdette et al. (2012) based on GPR of          3.2.1    Mexico
+2.75 ± 1.0 m derived from the same segment of the coast.
In addition, the value of +0.9±4.4 m for Fort Morgan Penin-       A prominent set of LIG calcarenite beach ridges extend
sula falls within error of the +2.0 ± 1.1 m value obtained        across much of the northeastern portion of the Yucatán (Sz-
when simply using the published elevations for the modern         abo et al., 1978; Ward and Brady, 1979). The calcarenite
and LIG beach ridges as reported by Rodriguez and Meyer           beach ridge plain extends 150 km from Cancún to Xel-Há
(2006). In each case, I deferred to the elevations derived from   with a width of 0.5 to 4 km and thicknesses ranging from 3
the GPR and beach ridge survey, respectively, rather than         to 10 m (Ward and Brady, 1979) (Fig. 8). The strand plain
the average elevations of the shoreline segments within the       is underlain by a caliche developed over older Pleistocene
WALIS database.                                                   coral-bearing limestones (Fig. 9). In addition, a few isolated
   Unlike many of the barrier islands in Texas, Fort Morgan       Diploria and Montastrea corals in growth position overlie
Peninsula displays a morphology suggestive of a complex           the caliche crust but are covered by the overlying calcarenite
and multi-stage evolution. Its complex architecture reveals       beach deposits (Ward and Brady, 1979; Szabo et al., 1978).
an additional potential pitfall in using the average elevation    Szabo et al. (1978) obtained five U-series ages on corals re-
of the LIG and modern barrier islands to determine the RSL        worked into the calcarenite beach ridge deposits as well as
difference at the LIG (Fig. 7). Fort Morgan Peninsula ex-         the underlying isolated in situ corals. Three of the corals re-
perienced at least three phases of Holocene growth (Little        worked into the overlying calcarenite beach deposits dated to
Point Clear, Edith Hammock, and modern spit; Rodriguez            121 ± 6, 123 ± 6, and 120 ± 6 ka (WALIS RSL ID no. 438).
and Meyer, 2006; Blum et al., 2003; Fig. 7). Their elevations     In situ or only lightly abraded corals of Montastrea sp. found

Earth Syst. Sci. Data, 13, 1419–1439, 2021                                          https://doi.org/10.5194/essd-13-1419-2021
A. R. Simms: Last interglacial sea levels within the Gulf of Mexico and northwestern Caribbean Sea 1427
Table 1. Last interglacial Gulf of Mexico shoreline elevations and relative sea levels.
LIG section Avg. 2 SD Modern Avg. 2 SD Diffe- Error∗ Strati- Error
eleva- (m) barrier/shoreline eleva- (m) rence (m) graphic (m)
tion tion (LIG RSL
(m) (m) RSL) (m)
(m)
Northwestern Gulf of Mexico (from Simms et al., 2013)
Vidor, TX 7.9 1.0 Sabine Pass 0.7 0.8 7.2 3.1
Fannett, TX 5.8 2.2 Sabine Pass 0.7 0.8 5.1 3.7
Pine Island, TX 2.8 2.2 Bolivar Peninsula 1.1 1.6 1.7 3.9
Smith Point, TX 2.2 1.8 Bolivar Peninsula 1.1 1.6 1.1 3.7
Hoskins Island, TX 1.0 0.6 Follet’s Island 0.8 1.2 0.2 3.1
Chocolate Bayou, 1.2 0.8 Follet’s Island 0.8 1.2 0.4 3.2
TX
Port O’Connor, TX 2.8 1.8 Matagorda Island 1.3 2.0 1.5 3.9
Aransas, TX 3.3 2.4 Saint Joseph Island 1.6 2.2 1.7 4.3
Live Oak, TX 4.7 3.6 Mustang Island 1.9 1.8 2.8 4.9 2.75 2.0
Encinal, TX 5.3 2.6 North Padre Island 1.7 2.0 3.6 4.3
Northeastern Gulf of Mexico (this study)
English Lookout 4.6 3.2 Horn Island 1.0 1.6 3.6 4.6
(Bay Saint Louis),
MS
Biloxi/Gulfport, 6.0 4.4 Horn Island 1.0 1.6 5.0 5.5
MS
Gautier, MS 4.1 2.0 Horn Island 1.0 1.6 3.1 3.8
Pamlico (Fort Mor- 3.3 2.4 Fort Morgan Penin- 2.5 2.4 0.9 4.4 2.0 1.1
gan Peninsula), AL sula
Gulf Breeze, FL 6.9 6.4 Santa Rosa Island 1.9 2.4 5.0 7.4
Apalachicola, FL 4.1 2.0 Saint Vincent 1.2 2.4 2.9 4.2 2.75 1.0
Island/Saint Joseph
Peninsula
∗ Also included in the root sum of the squares is a ±2.0 m error to account for errors in the DEM.
on top of the caliche crust dated to 123 ± 6 (WALIS RSL ID ment is also based on the assumption that the beach ridges
no. 439) and 125 ± 15 ka (WALIS RSL ID no. 440; Szabo et and associated upper shoreface and foreshore deposits rep-
al., 1978). In addition to the corals within and underlying the resent the highstand rather than a later regressive phase at
calcarenite beach ridges between Cancún and Xel-Há, Sz- a potentially lower stage of sea level. I attempt to provide
abo et al. (1978) also obtained a U-series date from a reef a more quantitative approach to estimating LIG RSLs based
coral on the nearby island of Cozumel that returned an age on the data of Ward and Brady (1979) by assuming the fore-
of 121 ± 6 ka (WALIS RSL ID no. 441). shore/upper shoreface contact represents the breaking depth
Although the calcarenite beach ridges reached elevations of the waves. Using the IMCalc application of Lorscheid
of 10 m (Szabo et al., 1978), they are capped by an eo- and Rovere (2019) for this region yields a breaking depth
lianite facies (Fig. 9). The base of the calcareous beach fa- of −1.4 ± 1.0 m. Combined with an elevation of the up-
cies with cross-bedding lies at elevations of +3.5 to +6.5 m per shoreface/foreshore contact at +4.8 m, with an assumed
above present sea level (general definition; Szabo et al., ±1.0 m of error to account for the uncertainties associated
1978). A more detailed stratigraphic description of the de- with how the elevation was measured, what datum was used,
posits by Ward and Brady (1979) suggests the boundary be- and the details of the modern analogue, yields a LIG RSL
tween the upper shoreface and foreshore/backshore is found of +6.2 ± 1.4 m (WALIS RSL ID no. 438). The two lower-
at ∼ +4.8 m across the calcarenite strand plain. Based on elevation Montastrea corals, which inhabit water depths of
the difference in elevation between that LIG contact and −1.1 to −17 m (Lightley et al., 1982; Hibbert et al., 2016)
the modern upper shoreface/foreshore contact (contact ele- at +2 m as well as a third on the nearby island of Cozumel
vation not given), Ward and Brady (1979) argue that RSL also at +2 m provide limiting constraints on LIG RSL that
during the LIG was between +5 and +6 m. This assess- are consistent with the +6.2 ± 1.4 m RSL assignment.
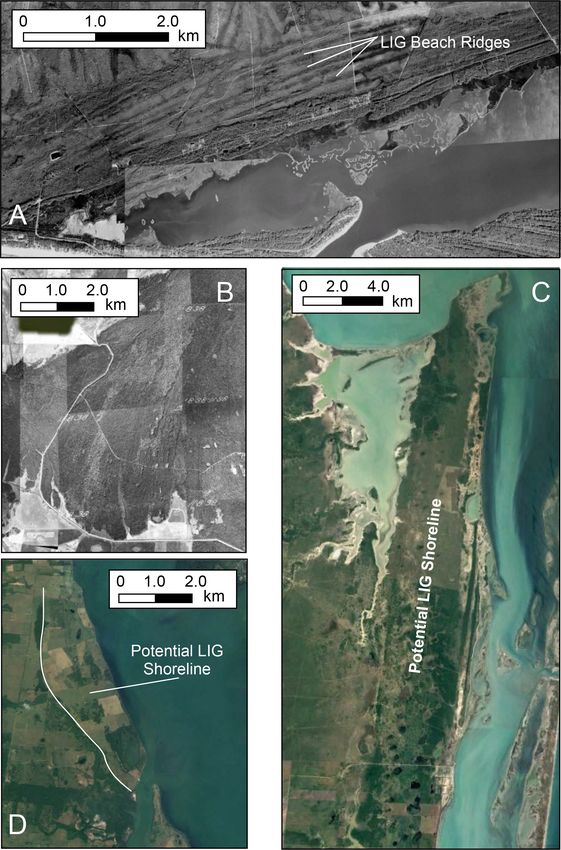
https://doi.org/10.5194/essd-13-1419-2021 Earth Syst. Sci. Data, 13, 1419–1439, 20211428 A. R. Simms: Last interglacial sea levels within the Gulf of Mexico and northwestern Caribbean Sea Figure 5. (a) Map of the LIG Gulfport shoreline across the northeastern Gulf of Mexico. Digital elevation models (DEM) of the LIG Gulfport shoreline segments dated along the Mississippi (b), western Florida Panhandle (c), Alabama (d), and Apalachicola delta (e) regions. Stars mark the locations of optically stimulated luminescence ages. The LIG shoreline segment names and average elevations are given in blue text, while the modern barrier island names and average elevations are given in red text. Earth Syst. Sci. Data, 13, 1419–1439, 2021 https://doi.org/10.5194/essd-13-1419-2021
A. R. Simms: Last interglacial sea levels within the Gulf of Mexico and northwestern Caribbean Sea                              1429

Figure 6. Topographic profiles through selected portions of the Mississippi–Alabama–Florida coast illustrating the elevation and width
differences between the Gulfport and modern barrier islands. See Fig. 5 for general locations.

   Ward and Brady (1979) also noted an extensive tract               overlain by the distal extension of the calcarenite grainstones.
of Pleistocene coral reefs seaward of the calcarenite beach          Blanchon et al. (2009) and Blanchon (2010) conducted an
ridges. The reef tract contains in situ corals of Montastrea an-     extensive description and dating of this reef tract in a theme
nularis, Acropora cervicornis, and rarely Porites porites that       park at Xcaret (Fig. 8). They were able to document two lev-
make an intact coral reef structure (Jordán-Dahlgren, 1997).         els of well-preserved in situ reef structures and reconstruct a
The A. cervicornis reef unit is found at elevations as high as       cross section through the reefs, which allowed them to con-
+4.5 m, with overlying storm deposits with reworked Acro-            fidently identify the reef flat and reef crest of the Pleistocene
pora palmata corals found at elevations as high as +5.5 m            reefs (Fig. 10). They obtained 33 U-series ages on corals
(Jordán-Dahlgren, 1997). In some locations this complex is           from the two different reef tracts. The U-series ages ranged

https://doi.org/10.5194/essd-13-1419-2021                                            Earth Syst. Sci. Data, 13, 1419–1439, 2021
1430                   A. R. Simms: Last interglacial sea levels within the Gulf of Mexico and northwestern Caribbean Sea

Figure 7. Digital elevation model and topographic profiles through the three Holocene (A–A0 , B–B0 , and C–C0 ) and the Pamlico (LIG,
D–D0 ) shorelines at Fort Morgan Peninsula, Alabama. See Fig. 4 for profile symbol legend.

from 107.7 ± 1.0 to 158.9 ± 1.9 ka, with two additional out-           the upper tract were 117±1.1, 117.7±1.1, and 119.5±1.1 ka
liers of 179 ± 2.4 and 567.3 ± 139.1 ka. Removing those two            (WALIS RSL ID no. 445); two of these ages were from in situ
outliers gives an average age of the reef tract of 126.7±27 ka         Acropora palmata colonies (Blanchon et al., 2009). Both sets
(error is 2 standard deviations of the ages). Blanchon et al.          of ages were recalculated by Hibbert et al. (2016). This new
(2009) screened the 33 samples, removing those whose 238 U,            recalculation based on updated decay constants (e.g., Cheng
232 Th, and δ 234 U(T) values were not the same as modern sea-         et al., 2013) and spike corrections (Hibbert et al., 2016) sug-
water. This filtering left two samples from the lower reef and         gests ages of 131.6±0.9 and 135.1±0.9 ka for the lower reef
five samples from the upper reef from well-preserved corals.           tract (WALIS RSL ID no. 446) and 117.5 ± 0.5, 118.2 ± 1.5,
The reliable ages from the lower reef tract returned ages of           and 121.3 ± 0.6 ka for the upper reef tract (WALIS RSL ID
132.6 ± 1.6 and 134.3 ± 1.4 ka (WALIS RSL ID no. 446).                 no. 445).
Of the five samples from the upper reef, two were from re-                The well-documented framework of the ancient reef sys-
worked clasts of A. palmata. The three remaining ages from             tems allowed for the identification of the different segments

Earth Syst. Sci. Data, 13, 1419–1439, 2021                                              https://doi.org/10.5194/essd-13-1419-2021
A. R. Simms: Last interglacial sea levels within the Gulf of Mexico and northwestern Caribbean Sea                                1431

                                                                         the root sum of the squares of one-half of the indicative range
                                                                         (0.15 m) and the measurement error, ±0.15 m.
                                                                            Inland and only a few tens of kilometers to the south of
                                                                         these LIG calcareous beach ridges and coral reefs, Mose-
                                                                         ley et al. (2013) surveyed and dated 10 subaerially formed
                                                                         speleothems from the cave networks south of Xel-Há in
                                                                         Quintana Roo, Mexico (Fig. 8). A total of 50 U-series ages
                                                                         were obtained from these speleothems. The ages ranged
                                                                         from 59.3 ± 0.4 to 117.7 ± 1.4 ka (Moseley et al., 2013). The
                                                                         speleothems were obtained from elevations of between +1.5
                                                                         and −15.1 m relative to modern sea level (general definition).
                                                                         Their elevations were determined based on a digital depth
                                                                         gauge relative to the modern water table with stated accura-
                                                                         cies of ±0.1 m with a maximum salinity-driven water density
                                                                         conversion uncertainty of 2 % (Moseley et al., 2013). The
                                                                         growth of the speleothems provides only limiting informa-
                                                                         tion on past sea levels and largely constrains the maximum
                                                                         elevations of sea levels during the late LIG, marine isotope
Figure 8. Map showing the location of LIG shoreline features of the
                                                                         stage (MIS) 5c, and MIS5a (Moseley et al., 2013). Never-
Mexican Yucatán Peninsula. The red strip is the location of the LIG
                                                                         theless, they suggest sea levels during the LIG dropped be-
calcarenite beach ridge as mapped by Ward and Brady (1979), the
green stars are the locations of the U-series ages collected by Szabo    low −4.9 m by 117.7 ± 1.4 ka, assuming a subsidence rate
et al. (1978), and the yellow triangle is the location of the Blanchon   of 0.001 m ka−1 (Emery and Uchupi, 1972; Moseley et al.,
et al. (2009) study. Also shown as a blue box is the general location    2013) (note that the subsidence correction only accounts for
of the speleothems studied by Mosey et al. (2013).                       0.1 m over the 117.7 ka).

                                                                         3.2.2   Belize
of the LIG reef at Xcaret (Jordán-Dahlgren, 1997; Blan-
chon et al., 2009; Blanchon, 2010) (Fig. 10). The LIG reef               Within Belize, LIG corals have been found onshore at Am-
crest currently lies at an elevation up to +5.8 m (the highest           bergris Cay as well as within drill core beneath the Turneffe
dated in situ colonies were obtained from +4.9 m, Blanchon,              islands, Lighthouse Reef, and Glover’s Reef (Gischler and
2010) for the upper reef tract and +3 m for the lower reef               Hudson, 1998; Gischler and Lomando, 1999; Gischler et al.,
tract (Blanchon et al., 2009) (Fig. 10). Both reef crest de-             2000) (Fig. 11). These corals have been dated using U-series
posits contain in place A. palmata colonies (Blanchon, 2010).            ages by Gischler et al. (2000) and Mazzullo (2006). In ad-
Stated uncertainties for the elevations from Blanchon et al.             dition, Mazzullo (2006) obtained two additional amino acid
(2009) are ±0.15 m, one-half the tidal range of 0.3 m. Based             racemization ages from the corals.
on their stratigraphic relationships and differences in age,                U-series ages obtained from Reef Point at Ambergris Cay
Blanchon et al. (2009) interpret the upper reef tract to rep-            dated to 128.28 ± 1.33 (WALIS U-series ID no. 1693) by
resent a later highstand within the LIG and the lower reef               Gischler et al. (2000) and 135.8 ± 0.9 ka (WALIS RSL ID
tract to represent an earlier and lower phase of sea level dur-          no. 448) by Mazzullo (2006) (Fig. 11). These ages were ob-
ing the LIG. They interpret the two different elevations of              tained from A. palmata and M. annularis at elevations of 0.3
sea levels at the LIG as a result of a rapid sea-level rise at           and 0.5 m, respectively. Mazzullo (2006) obtained a second
the LIG. Based on a comparison with modern equivalents,                  U-series age from another M. annularis coral dredged from
Blanchon (2010) argues that the reef crests were deposited               2.3 m depth that dated to 165.5 ± 1.1 ka but was deemed un-
in intertidal conditions and thus represent a LIG RSL high-              reliable given its high Th content. Mazzullo (2006) describes
stand of +6 m. A study by Cubit et al. (1986) that included              the facies found at Reef Point on Ambergris Cay as a reef
a detailed water-level survey across a Caribbean reef flat in            flat. With a tidal range of 0.3 m (Gischler and Lomando,
nearby Panama found that the reef flat within a similar tidal            1999) and treating the reef flat as forming at mean lower low
range developed 6 cm below mean lower low water. Thus,                   water (Cubit et al., 1986) places LIG RSLs at +0.45 ± 1.0
based on half the tidal range of 30 cm and an elevation of               (WALIS U-series ID no. 1693) and +0.65±1.0 (WALIS RSL
+5.5 m for the fossilized LIG reef flat, we assign a LIG RSL             ID no. 448). The error was derived from the root sum of the
of +5.7±0.2 m. That assignment places the coeval reef crest              squares of half the indicative meaning (0.15 m) and 1.0 m to
10 cm above mean sea level. As it appears that the reef flat             account for uncertainties in the elevation measurement da-
of the lower reef tract reaches an elevation of +2.5 m, the              tum and modern analogues. Two specimens of the gastro-
same approach applied to the lower reef tract suggests an                pod Strombus gigas gave AAR ages equivalent to the LIG
early LIG RSL of +2.7 ± 0.2 m. The error terms of ±0.2 are               from an elevation of +1.2 m approximately 7 km southwest

https://doi.org/10.5194/essd-13-1419-2021                                                 Earth Syst. Sci. Data, 13, 1419–1439, 2021
1432 A. R. Simms: Last interglacial sea levels within the Gulf of Mexico and northwestern Caribbean Sea Figure 9. Schematic cross section through the LIG coastline of the Yucatán Peninsula of Mexico (redrawn from Szabo et al., 1978). See Fig. 8 for a general location. Figure 10. Schematic cross section through the LIG reef tracts located at Xcaret, Mexico, as composed by Blanchon et al. (2009). LRT is lower reef tract, URT is upper reef tract, and A.p. is Acropora palmata. Redrawn with permission from Blanchon et al. (2009). of Reef Point (WALIS AAR ID nos. 129 and 130; Mazzullo, were obtained from also includes specimens of the coral A. 2006). The gastropod inhabits very shallow waters but can palmata, which would suggest lower sea levels on the order be found in water depths as great as 60 m (Randall, 1964) of −7.5 + 1.2/−7.9 m (WALIS U-series ID no. 1695) and and thus only confirms the RSL elevation limits placed by −6.5 + 1.2/−7.9 m (WALIS U-series ID no. 1694), respec- the corals but does support the age assignment of the reefs. tively. The two samples from Lighthouse reef were both con- The other 6 U-series ages of Gischler et al. (2000) were ob- sidered reliable by Gischler et al. (2000) based on their ages tained from cores taken on Glover’s, Lighthouse, and Turn- of 125.0 ± 0.4 ka (reported as 124.99 ± 0.355 ka; WALIS U- effe reefs (Fig. 11). Neither of the two samples obtained from series ID no. 1696) and 129.9 ± 0.5 ka (WALIS U-series ID cores on Glover’s Reef was considered reliable by Gischler no. 1697). The ages were obtained from specimens of A. cer- et al. (2000) as they both appeared too old. One dates to vicornis and A. palmata, respectively, which using the zona- 280.3 ± 3.0 (WALIS U-series ID no. 1695), while the other tions of Hibbert et al. (2016) suggests LIG RSLs of −4.9 + dates to 138.0 ± 0.8 ka (WALIS U-series ID no. 1694). Al- 4.1/−11.8 m (WALIS U-series ID no. 1696) and −6.5 + though the facies of these limestones are conclusively bar- 1.2/−7.9 m (WALIS U-series ID no. 1697), respectively. If rier reef in origin, they are not as well described as those we use the depth limits of the accompanying A. palmata for from Ambergris Cay, and the indicative meaning of the de- the former of these two samples, it might suggest RSLs as posits is not clear. Therefore, I initially turned to the general deep as −8.0 + 1.2/−7.9 m (WALIS U-series ID no. 1996). habitat zones of the coral species dated. Both ages were ob- The last two ages obtained from the same section of the core tained from specimens of the coral M. annularis that when from Turneffe reef returned ages of 142.0 ± 0.5 ka (WALIS using the depth ranges of Hibbert et al. (2016) would result U-series ID no. 1698) and 145.3 ± 0.5 ka (WALIS U-series in a RSL of 0.7 + 8.6/−7.3 m (WALIS U-series ID no. 1695) ID no. 1699). Gischler et al. (2000) also interpreted these and 1.7 + 8.6/−7.3 m (WALIS U-series ID no. 1694). How- to represent erroneously old ages. These two samples were ever, Gischler et al. (2000) mentions that the facies the coral obtained from specimens of A. palmata and M. annularis, Earth Syst. Sci. Data, 13, 1419–1439, 2021 https://doi.org/10.5194/essd-13-1419-2021
A. R. Simms: Last interglacial sea levels within the Gulf of Mexico and northwestern Caribbean Sea                                 1433

Figure 11. Map of the Belize and Honduras coastline showing the locations of U–Th (stars), amino acid racemization (shown as triangles),
and electron spin resonance (shown as hexagons) ages discussed in the text. Ages in green denote the work of Gischler et al. (2000). Ages
shown in yellow denote the work of Mazzullo (2006), and ages shown in red denote the work of Cox et al. (2008).

respectively, and would suggest RSLs of −2.5 + 1.2/−7.9                elevations to the south and east along the Belize margin a
(WALIS U-series ID no. 1698) and 5.7+8.6/−7.3 m (WALIS                 reflection of neotectonic activity.
U-series ID no. 1699), respectively. Concerning the latter of
these two ages, similar to the samples from Glover’s Reef, M.          3.3    Honduras
annularis likely represents an environment on the shallower
end of the spectrum considering its association with speci-            Only a handful of possible LIG deposits have been located
mens of A. palmata and thus may represent a RSL as shallow             in Honduras. Cox et al. (2008) obtained an ESR age (WALIS
as −2.5 + 1.2/−7.9 m (WALIS U-series ID no. 1699).                     ESR ID no. 102) on an uplifted fossil reef on the western
   The elevation of the top of the Pleistocene section beneath         tip of Roatán island (WALIS RSL ID no. 450; Fig. 11). The
the reefs is much lower in Belize than those farther north             poor preservation of the reef made it difficult to ascertain the
along the Yucatán Peninsula near Cancún, Mexico (Gischler              elevation of RSL at the time of deposition, and the corals
et al., 2000). In addition, the top of the Pleistocene appears         are of unknown species. Late Pleistocene limestones with in
to deepen to the south and east (Gischler et al., 2000). Gis-          situ specimens of Montastrea sp. and Acropora cervicornis
chler et al. (2000) attribute this to tectonic subsidence as the       have also been reported from the Swan Islands (Ivey et al.,
margin trails off into the adjacent Cayman Trough. This in-            1980; Fig. 11) but have yet to be dated. They reach eleva-
terpretation is supported by evidence of neotectonic activ-            tions up to 14 m above modern sea level. Both regions are
ity found within Holocene coastal successions (McClowsky               likely heavily influenced by tectonic activity due to their de-
and Liu, 2013) and deeper (Lara, 1993), but the accuracy of            velopment and growth across uplifted tectonic blocks along
the ages of the corals from Gischler et al. (2000) is still a          the Montagu/Swan Islands fault system (Cox et al., 2008).
matter of discussion (MacIntyre and Toscano, 2004). MacIn-             The mainland coast of Honduras is a well-developed silici-
tyre and Toscano (2004) suggest the possibility that the ages          clastic coastline with prevalent presumably Holocene beach
are erroneously too old given their relatively low aragonite           ridges, but no LIG shorelines have been mapped across it to
percentages and elevated 234 U/238 U ratios, and the lower             date.
elevations actually reflect deposition during later substages
of MIS5 (e.g., MIS5a, MIS5c, etc.). Additionally, the strati-          4     Elevation details
graphic section described by Mazzullo (2006) with a U-series
age consistent with the LIG as well as two amino acid racem-           4.1    Datums
ization ages at a similar elevation is capped by an unconfor-
                                                                       With the exception of the new work in this study and the
mity. It remains to be determined if the LIG reefs grew higher
                                                                       works of Burdette et al. (2012) and Simms et al. (2013),
and were subsequently eroded during the Last Glacial Max-
                                                                       little detail is given as to the datums of the LIG shoreline
imum (LGM), if these reefs represent transgressive or later
                                                                       elevations. This study, Burdette et al. (2012), and Simms
regressive reefs formed before or after the LIG highstand, or
                                                                       et al. (2013) utilize the North American Vertical Datum of
whether the elevation of the corals at Ambergris Cay repre-
                                                                       1988 (NAVD88; https://www.ngs.noaa.gov/datums/vertical/
sents the LIG highstand in Belize with the subsequent lower
                                                                       north-american-vertical-datum-1988.shtml, last access: 22
                                                                       June 2020), which locally can vary from mean sea level

https://doi.org/10.5194/essd-13-1419-2021                                              Earth Syst. Sci. Data, 13, 1419–1439, 2021
1434 A. R. Simms: Last interglacial sea levels within the Gulf of Mexico and northwestern Caribbean Sea
by a meter or more (Kinsman and Youngman, 2018). How- 5.2 LIG sea-level fluctuations
ever, in this study and that of Simms et al. (2013) both
With the exception of the study by Blanchon et al. (2009)
the LIG and the modern equivalent barrier islands were
most of the studies of the LIG shoreline across the Gulf
measured with respect to NAVD88 “0”, and thus the dif-
of Mexico and western Caribbean have been too coarse to
ferences between MSL and NAVD88 are canceled out.
test for fluctuations in LIG sea levels. Most ages have only
Within the region of Burdette et al. (2012), the closest Na-
been precise enough to establish a LIG age and not necessar-
tional Oceanic and Atmospheric Administration (NOAA)
ily when during the LIG the feature was deposited. Neither
tide gauge station (8728690; https://tidesandcurrents.noaa.
have the deposits lent themselves to reconstructing fine-scale
gov/datums.html?id=8728690, last access: 22 June 2020)
fluctuations in sea levels during the LIG, particularly within
suggests a difference between MSL and NAVD88 of 0.15 m.
the siliciclastic shorelines of the northern Gulf of Mexico.
The carbonate systems of the Yucatán Peninsula may pro-
4.2 Elevation measurements vide more opportunities for testing for sea-level fluctuations
The rest of the studies defined mean sea level according to the during the LIG. The exception is the work of Blanchon et
generic definition and provided little detail as to how the ele- al. (2009). They found two distinct reef tracts that they ar-
vations were physically measured. Moseley et al. (2013) used gue represent an earlier, lower phase of LIG sea levels at +3
a depth gauge, while Burdette et al. (2012) and Simms et al. and a later higher phase of LIG sea levels at +6 m, separated
(2013) used high-resolution lidar with accuracies of 0.25 cm. by a rapid increase in LIG sea levels (Blanchon et al., 2009)
However, within the entire region, the tidal range is less than (Fig. 10).
1 m, with some areas (e.g., the Yucatán) experiencing a tidal
range of less than 0.15 m (Blanchon et al., 2009), and thus 5.3 Earlier highstands
any errors associated with estimating the mean tide level are
Shorelines and other coastal features from highstands in sea
likely minimal and less than 1 m.
levels prior to the LIG have been reported from the northern
Gulf of Mexico but have yet to be dated (Winker and Howard,
5 Related sea-level topics 1977; Donoghue and Tanner, 1992). The most studied and
best preserved are those within the panhandle of Florida near
5.1 Subsidence the Apalachicola delta, where Winker and Howard (1977)
With the exception of the Honduran coast and possibly the and Donoghue and Tanner (1992) describe two older terrace
eastern Gulf of Mexico (Otvos, 1981), the currently-dated and shoreline sets – the Gadsden and Wakulla sequences,
LIG sites across the northwestern Gulf of Mexico and north- the former of which may correspond to multiple highstands
western Caribbean are all subject to subsidence rather than (Winker and Howard, 1977). However, some discussion has
tectonic uplift. Within the northwestern Gulf of Mexico sub- arisen as to their origin, with some studies attributing these
sidence appears to increase basinward (Simms et al., 2013), features to non-marine sources (Otvos, 1995) as very little
and along the Belize coast it appears to increase to the south detailed sedimentology has been conducted on the features
and east (Gischler et al., 2000). However, constraining the to show their marine origins. In addition to the purported
magnitude of subsidence independent of the LIG elevations marine shorelines, the mapping of alluvial terraces suggests
has remained problematic as most studies use the elevation a progradational nature to much of the coastline, with ear-
of the LIG shoreline to determine subsidence (e.g., Paine, lier phases of transgression and regression leading to the de-
1993; Gischler et al., 2000; Simms et al., 2013). Studies in- velopment of multiple periods of coastal plain aggradation
dependent of the LIG shoreline elevation are needed to de- (Otvos, 2005). However, the alluvial terraces have only been
termine subsidence rates and hence correct LIG sea levels preliminarily dated (e.g., Otvos, 2005), and more work is re-
from its influence. GPS surveys provide some hope, but is- quired to nail down their ages and relationship to former sea
sues related to anthropogenic groundwater and hydrocarbon levels.
extraction are not always easy to correct for and likely dom- Older Pleistocene reefal units are present across the Yu-
inate the subsidence signal at GPS timescales. Groundwater catán Peninsula (e.g., Ward and Brady, 1979; Ferro et al.,
and hydrocarbon extraction are particularly relevant across 1999; Gischler et al., 2010) but have not been well dated or
the northern Gulf of Mexico (Paine, 1993; White and Mor- been used to constrain the elevations of pre-LIG highstands.
ton, 1997; Morton et al., 2006; Chan and Zoback, 2007; Qu Speleothems that may help constrain older sea levels dating
et al., 2015). as far back as MIS11 have been identified within Quintana
Roo (Steidle et al., 2020). Those results have yet to be pub-
lished outside of meeting abstracts but are likely forthcom-
ing.
Earth Syst. Sci. Data, 13, 1419–1439, 2021 https://doi.org/10.5194/essd-13-1419-2021You can also read