LATEST RELEASE OF ANNUAL SAPS CRIME STATS - SAPS Crime statistics 1 April 2017 to 31 March 2018 A High Level overview
←
→
Page content transcription
If your browser does not render page correctly, please read the page content below
SAPS Crime statistics 1 April 2017 to 31 March 2018

                           A High Level overview

                                                                    Screenshot
                                                                   source: SABC

                 LATEST RELEASE OF ANNUAL SAPS CRIME STATS
                              11 September 2018
2018-09-11                                                                1
High Level Trends

   “TOP 30” POLICE STATIONS ITO ALL CRIME TYPES
                                                      Gauteng leads the number of
                                                   police stations under the “Top 30”
                                         Gauteng   with highest no of reported crimes
                                 WCape
                                                            (All crime types)

                           KZN

             FS/Mpuma/NC

2018-09-11                                                                         2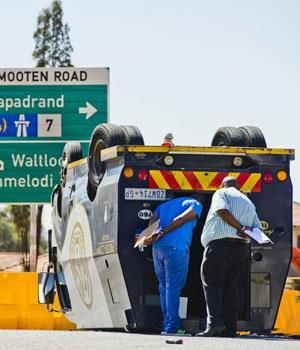
High Level Trends PROVINCIAL TRENDS ITO VIOLENT CRIME Western Cape: Province with the highest no of murders in SA; Nyanga Police station in particular has the biggest crime problem with 308 murder cases or a 9,6 % increase in murders. Other WCape stations under the “Top 30” include Gugulethu, Phillippi, Khayalitsha and Delft. KZN: Umlazi police station had the 2nd highest no of murders in SA (223 cases), after that of Nyanga. Six SAPS precincts in KZN is under the “Top 30” police stations with highest no of crimes. Gauteng: Jeppe (125 murder cases), Ivory Park, Kagiso and Hillbrow counts under the “Top 30” police stations with highest no of crimes. Overall, Gauteng had 9 SAPS precincts under the “Top 30” police stations with highest no of crimes. ECape had 5 SAPS precincts under the “Top 30” police stations with highest no of crimes. 2018-09-11 3

High Level Trends
VIOLENT CRIMES
Murders increased by 6,9 % since the previous year.
20 336 murder cases were opened.
57 people killed per day in SA
or a 6,9 % increase in murder
2930 women and 985 children killed. rate
1320 more people were murdered in SA compared to
the previous year.
WESTERN CAPE HAS
HIGHEST NO OF MURDERS
R3,5 Billion for SAPS to fight crime per year.
“South Africa is close to a war zone” / “The SAPS have
dropped the ball” “never again” should such a high
crime rate be recorded and noted the fear and stress
that South Africans live under” (Police Minister, Bheki
Cele at the release of the crime stats, 11 Sept 2018)
2018-09-11 4
High Level Trends The murder rate decreased in Mpumalanga and Northern Cape while it increased in all the other Provinces. The murder rate increased in SA for the sixth consecutive year. 85 Police officials killed. 57 people killed per day in SA A correlation between the use of alcohol and 6,9 % increase in murder rate murder/attempted murder was found. (It was found that the number of liquor licence applications 35,2 murders per 100 000 increased in similar fashion than the number of people murders in the same area). Firearms are the ‘most preferred” weapon used in violent crimes, followed by knives. 2018-09-11 5
High Level Trends CIT heists was at its highest in 2008/2009 and at its 86 more heists in the lowest in 2014/2015. Unfortunately, from 2016, it country than the previous increased again. year CIT heists increased by 142,4 % in Gauteng. Most CIT heists occurred on the road or at business areas. Explosives and heavy firearms are being used by the perpetrators. The CIT security officers’ firearms are always taken by the perpetrators. The reason for the sudden spike in CIT heists early in 2018 has been ascribed by analysts to the fact that the CIT companies decreased the number of cash on CIT vans in order to minimise the risk of cash lost. 2018-09-11 6

High Level Trends
                                                   Note. A crime type which
Crime types which Increased Overall Nationally:    increased (or decreased)
                                                     Nationally, may show
                                                   totally the opposite trend
                                                      when compared to a
                                                        regional or local
                       Murder & Attempted murder
                                                      Municipal/Precinct.

                            Truck hijackings

                               CIT heists

                            Sexual offences

                             Bank robberies

                              Stock theft

   2018-09-11                                                               7
High Level Trends
Crime types which decreased Overall Nationally:
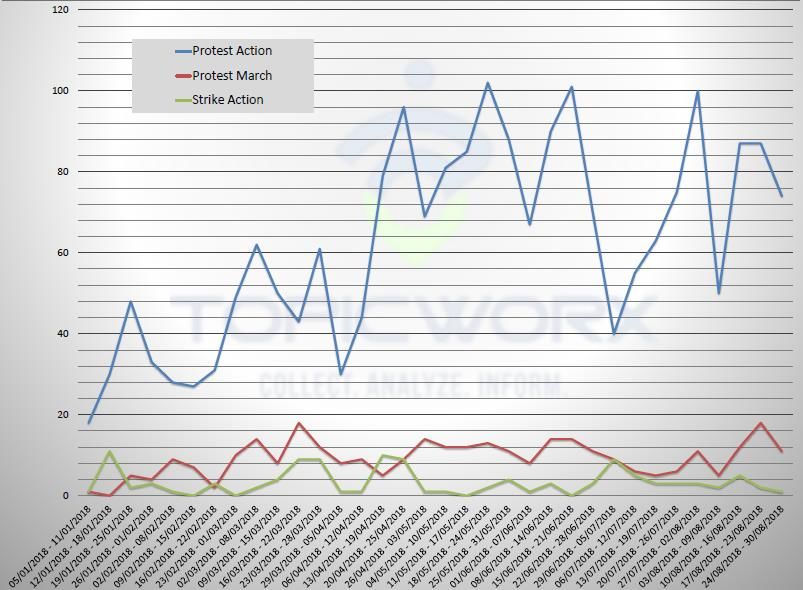
Note. Important to note that the released SAPS annual crime stats include the period 1 Apr 2017
to 31 March 2018 and does not include the period from April 2018 to present.
* According to protest-related statistics from the company, TOPICWORX, it can be seen from the
below graph that there was a spike in protest actions as from around March 2018. The newly
released SAPS stats would therefore not have taken into consideration the effects of this spike in
Burglaries violent and disruptive protests actions.
Arson & Malicious
damage to property
Assault (both common &
GBH)
Robbery with aggravating
circumstances
Note. A crime type which
decreased (or increased)
Nationally, may show totally the Source: TOPICWORX
opposite trend when compared to a
regional or local
Municipal/Precinct.
2018-09-11 8Increase in Violent Crime 2018-09-11 9
General Remarks
The same trend from the previous year is continuing, namely
an increasing problem with violent & organised crime.
(conclusion drawn by writer)
Cases exists of collusion and or corruption by security and or
As soon as the actual detail
police officials and this issue should be tackled to ensure that a
stats has been released, a
positive impact is made in the fight against CIT heists. (writer
more in-depth analysis will
conclusion)
be done per region and or
per local precinct
SAPS Remarks: (Minister Bheki Cele said SAPS will respond to
crime in the following way)
Greater focus on “crimes of fear”.
Greater collaboration with civil society, including
community neighbourhood watches, Tribal chiefs, SABRIC,
BAC, etc
Creation of safer cities by means of community
partnerships and technology.
Increase in “blue light patrols” in neighbourhoods between
Sunset and sunrise.
Basic training of SAPS officers to increase focus on Tactical
training.
Crimes against women & children to be beefed up.
A community policing strategy to be launched between
1 and 15 September.
2018-09-11 10You can also read