Leading the Transformation - Andreas Buchta, Senior IR Manager Monika Kowalski, IR Officer Volkswagen AG Group Investor Relations - Volkswagen Group

Page created by Tony Obrien
 
CONTINUE READING
Leading the Transformation - Andreas Buchta, Senior IR Manager Monika Kowalski, IR Officer Volkswagen AG Group Investor Relations - Volkswagen Group
Leading the
     Transformation.
   Andreas Buchta, Senior IR Manager
       Monika Kowalski, IR Officer
 Volkswagen AG Group Investor Relations

Goldman Sachs Conference, London, 5 December 2019
Leading the Transformation - Andreas Buchta, Senior IR Manager Monika Kowalski, IR Officer Volkswagen AG Group Investor Relations - Volkswagen Group
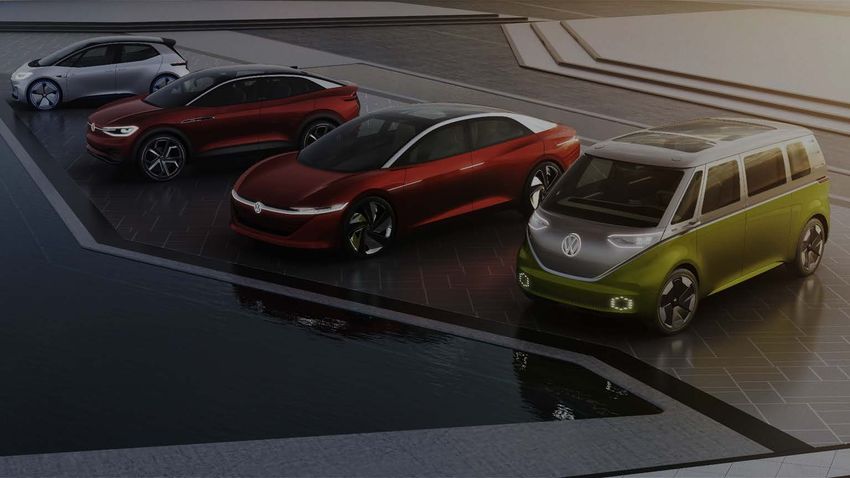
Disclaimer
The following presentations contain forward-looking statements and information on the business development of the Volkswagen Group. These statements may
be spoken or written and can be recognized by terms such as “expects”, “anticipates”, “intends”, “plans”, “believes”, “seeks”, “estimates”, “will” or words with
similar meaning. These statements are based on assumptions, which we have made on the basis of the information available to us and which we consider to be
realistic at the time of going to press. These assumptions relate in particular to the development of the economies of individual countries and markets, the
regulatory framework and the development of the automotive industry. Therefore the estimates given involve a degree of risk, and the actual developments may
differ from those forecast. The Volkswagen Group currently faces additional risks and uncertainty related to pending claims and investigations of Volkswagen
Group members in a number of jurisdictions in connection with findings of irregularities relating to exhaust emissions from diesel engines in certain Volkswagen
Group vehicles. The degree to which the Volkswagen Group may be negatively affected by these ongoing claims and investigations remains uncertain.

Consequently, a negative impact relating to ongoing claims or investigations, any unexpected fall in demand or economic stagnation in our key sales markets, such
as in Western Europe (and especially Germany) or in the USA, Brazil or China, and trade disputes among major trading partners will have a corresponding impact
on the development of our business. The same applies in the event of a significant shift in current exchange rates in particular relative to the US dollar, sterling,
yen, Brazilian real, Chinese renminbi and Czech koruna.

If any of these or other risks occur, or if the assumptions underlying any of these statements prove incorrect, the actual results may significantly differ from those
expressed or implied by such statements.

We do not update forward-looking statements retrospectively. Such statements are valid on the date of publication and can be superseded.
This information does not constitute an offer to exchange or sell or an offer to exchange or buy any securities.
Leading the Transformation - Andreas Buchta, Senior IR Manager Monika Kowalski, IR Officer Volkswagen AG Group Investor Relations - Volkswagen Group
Development World Car Market vs. Volkswagen Group Car Deliveries to Customers1)
(Growth y-o-y in deliveries to customers, January to October 2019 vs. 2018)

                   Car Market                VW Group                                                Car Market             VW Group    Car Market        VW Group
                                                                                                                                3.2%        1.5%

                                                   -1.2%                                                                                                          0.0%
                           -1.8%                                                                            -1.2%

                       North America (incl. LCV)                                                              Western Europe             Central & Eastern Europe

                   Car Market                VW Group                                                Car Market             VW Group    Car Market        VW Group
                                                    0.1%

                                                                                                                                -0.5%

                                                                                                                                                              -2.8%
                           -5.6%                                                                            -4.8%                           -6.5%

                       South America (incl. LCV)                                                                     World 2)                      Asia Pacific

  1) Volkswagen   Group Passenger Cars excl. Volkswagen Commercial Vehicles 2) incl. LCV in North America & South America

                                                                                                                                                                         3
Leading the Transformation - Andreas Buchta, Senior IR Manager Monika Kowalski, IR Officer Volkswagen AG Group Investor Relations - Volkswagen Group
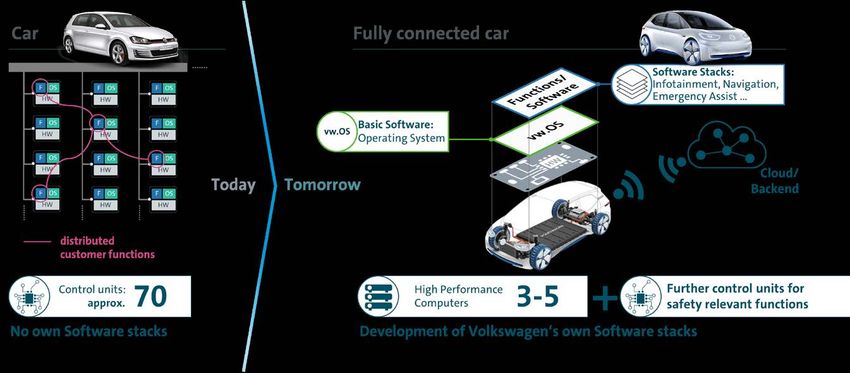
Volkswagen Group – Deliveries to Customers by Brands1)
(January to October 2019 vs. 2018)
                    -0.2%
 [thsd. units]
                                                                                                                                   January - October 2018
                 8,977 8,955                                                                                                       January - October 2019
  9,000

  8,000                                                    Volume                           Premium           Sport & Luxury      Truck & Bus
  7,000
                                                            -0.5 %                            -1.1 %              +6.1 %             +7.2 %
                                         -1.2%
  6,000
                                       5,140 5,077
  5,000

  4,000

  3,000                                                                                  -1.2%
                                                       -1.9%
  2,000                                                            +11.1%     0.0%     1,525 1,506             +6.3%             +6.1%         +8.8%
                                                     1,038 1,019                                     +69.4%             +1.1%
  1,000
                                                                   449 499   410 410
                                                                                                              214 228           111 117       77    84
                                                                                                     4   7              8   8
       0

  1) Volkswagen   Group excl. Ducati                                                                                                                        4
Leading the Transformation - Andreas Buchta, Senior IR Manager Monika Kowalski, IR Officer Volkswagen AG Group Investor Relations - Volkswagen Group
Volkswagen Group – Analysis by Business Line 1)
(January to September 2019 vs. 2018)
                                                                                                                                           Vehicle sales                                                    Sales revenue                                                  Operating profit                                             Operating margin
  thousand vehicles / € million                                                                                                            2019                         2018                                 2019                         2018                                 2019                         2018                              2019                     2018
  Volkswagen Passenger Cars                                                                                                                2,754                        2,753                            65,447                       62,508                                 3,152                        2,330                               4,8%                     3,7%
  Audi                                                                                                                                       900                        1,107                            41,332                       44,257                                 3,239                        3,671                               7,8%                     8,3%
  ŠKODA                                                                                                                                      805                          698                            14,811                       12,598                                 1,175                        1,083                               7,9%                     8,6%
  SEAT                                                                                                                                       517                          462                             8,828                        7,744                                   248                          237                               2,8%                     3,1%
  Bentley                                                                                                                                      7                            7                             1,306                        1,092                                    65                         -137                               5,0%                   -12,5%
  Porsche Automotive 2)                                                                                                                      205                          190                            18,666                       17,507                                 3,200                        3,197                              17,1%                    18,3%
  Volkswagen Commercial Vehicles                                                                                                             344                          337                             8,756                        8,572                                   497                          628                               5,7%                     7,3%
  Scania 3)                                                                                                                                   76                           69                            10,427                        9,337                                 1,209                          888                              11,6%                     9,5%
  MAN Commercial Vehicles                                                                                                                    104                           98                             9,175                        8,599                                   297                          222                               3,2%                     2,6%
  Power Engineering                                                                                                                            -                            -                             2,873                        2,489                                    91                          142                               3,2%                     5,7%
  VW China 4)                                                                                                                              2,815                        3,021                                 -                            -                                     -                            -
  Other 5)                                                                                                                                  -543                         -619                           -22,949                      -24,762                                  -411                         -872
  Volkswagen Financial Services                                                                                                                -                            -                            27,946                       24,635                                 2,035                        1,915                                 7,3%                     7,8%
  Volkswagen Group before Special Items                                                                                                        -                            -                                 -                            -                                14,795                       13,306
  Special Items                                                                                                                                -                            -                                 -                            -                                -1,257                       -2,435
  Volkswagen Group                                                                                                                         7,983                        8,123                           186,617                      174,577                                13,539                       10,871                                 7,3%                     6,2%
    Automotive Division 6)                                                                                                                 7,983                        8,123                           157,031                      148,424                                11,313                        8,832
       of which: Passenger Cars 7)                                                                                                         7,803                        7,956                           134,666                      128,218                                10,103                        8,021
       of which: Commercial Vehicles 7)                                                                                                      180                          167                            19,491                       17,717                                 1,307                          857
       of which: Power Engineering                                                                                                             -                            -                             2,873                        2,489                                   -98                          -46
    Financial Services Division                                                                                                                -                            -                            29,587                       26,153                                 2,226                        2,039

 1) All figures shown are rounded, minor discrepancies may arise from addition of these amounts. 2) Porsche (Automotive and Financial Services): sales revenue € 20,490 (19,117) million, operating profit € 3,346 (3,329) million. 3) Scania (Automotive and Financial Services): sales revenue € 10,762 (9,634) million, operating profit € 1,314 (991) million. 4) The sales

 revenue and operating profits of the joint venture companies in China are not included in the figures for the Group. These Chinese companies are accounted for using the equity method and recorded a proportionate operating profit of € 3,187 (3,330) million. 5) In operating profit mainly intragroup items recognized in profit or loss, in particular from the elimination of
 intercompany profits; the figure includes depreciation and amortization of identifiable assets as part of purchase price allocation for Scania, Porsche Holding Salzburg, MAN and Porsche. 6) Including allocation of consolidation adjustments between the Automotive and Financial Services divisions. 7) Since 1st January 2019 Volkswagen Commercial Vehicles is reported in
 the Automotive division, prior year figures have been adjusted.
                                                                                                                                                                                                                                                                                                                                                                                       5
Leading the Transformation - Andreas Buchta, Senior IR Manager Monika Kowalski, IR Officer Volkswagen AG Group Investor Relations - Volkswagen Group
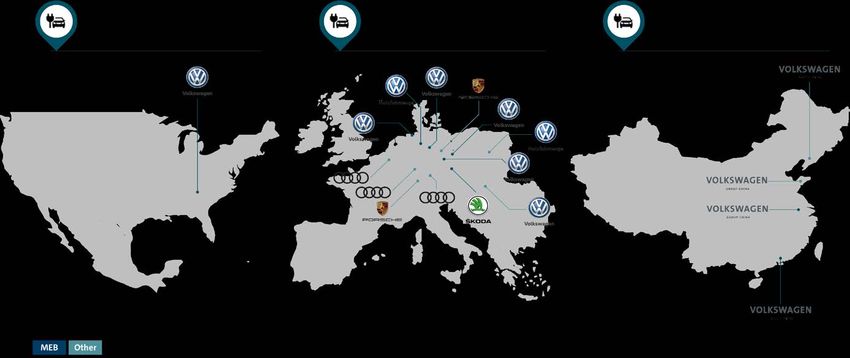
Volkswagen Group – Analysis of Operating Profit 1)
 (January to September 2019 vs. 2018)

[€ billion]
   18
   16                                                                                          0.0               0.5
                                                                                                                                         -2.3
                                                                            2.7                                                                    0.4          -0.1          0.2
   14                                                                                                                                                                                                   -1.3
   12                                  2.4
   10
     8
                                                                                                                                                                                          14.8
                                                         13.3                                                                                                                                                        13.5
     6
                 10.9
     4
     2
     0
               Jan – Sept Special Items Jan – Sept     Volume/                             Exchange Product Costs Fixed Costs                   Commercial     Power        Financial    Jan – Sept Special Items Jan – Sept
                  2018                     2018       Mix/ Prices                           Rates /                                              Vehicles** Engineering**   Services     2019 excl.                2019 incl.
              incl. Special             excl. Special                                     Derivatives                                                                       Division    Spec. Items               Spec. Items
                 Items                     Items

                                                                                           Passenger Cars*/**
       1) All figures shown   are rounded, minor discrepancies may arise from addition of these amounts. *) without FS   ** )   including PPA
                                                                                                                                                                                                                                6
Leading the Transformation - Andreas Buchta, Senior IR Manager Monika Kowalski, IR Officer Volkswagen AG Group Investor Relations - Volkswagen Group
Automotive Division – Net Cash Flow Development 1) 2)
(January to September 2019)

             [€ billion]
                 22
                 20
                 18
                 16                                                 -8.2
                 14
                 12
                 10                   20.9                                                           -3.7
                                                                                                                                      0.2                                                        -0.6
                  8
                  6
                  4                                                                                                                                                 9.2                                                 8.6
                  2
                  0
               2018                     14.9                          -7.9                           -3.5                              0.1                           3.7                         -0.2                   3.5
                                Cash flow from                        Capex                     Capitalized                          Other                Net cash flow before                 Acquisition         Net Cash flow 4)
                              operating activities                                             development                                                       equity                       and disposal
                                                                                                   costs                                                      investments                       of equity
                                                                                                                                                                                              investments

 1) All figures shown   are rounded, minor discrepancies may arise from addition of these amounts.   2)   Including allocation of consolidation adjustments between Automotive and Financial Services divisions.
                                                                                                                                                                                                                                      7
Leading the Transformation - Andreas Buchta, Senior IR Manager Monika Kowalski, IR Officer Volkswagen AG Group Investor Relations - Volkswagen Group
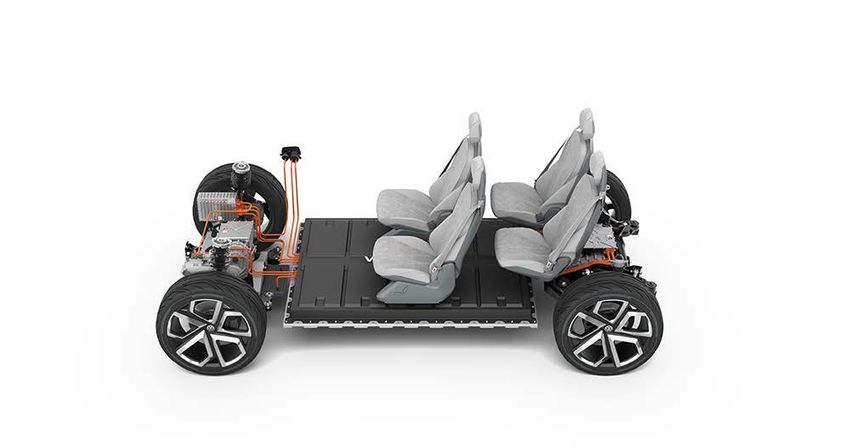
Automotive Division – Net Cash Flow 1)
(January to September 2019)
[€ billion]

                        12

                        10                                                                                                  0.6
                                                                                                              1.2
                          8

                          6
                                                                                                                                                 10.4
                          4                            8.6

                          2

                          0

             2018                                     3.5                                                     3.3          0.2                    7.0
                                            Net Cash flow                                           Diesel outflow    Aquisition and        Net Cash flow
                                           including Diesel                                                          disposal of equity   underlying business
                                         payments and M&A                                                               investments

1)   Including allocation of consolidation adjustments between Automotive and Financial Services divisions.
                                                                                                                                                                8
Leading the Transformation - Andreas Buchta, Senior IR Manager Monika Kowalski, IR Officer Volkswagen AG Group Investor Relations - Volkswagen Group
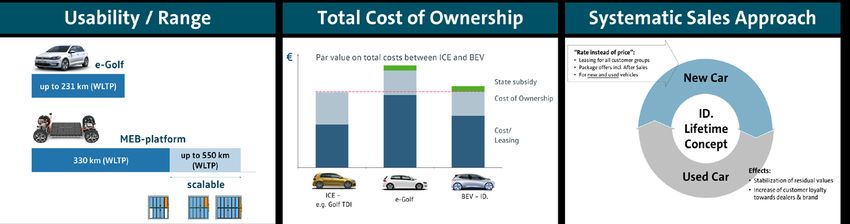
Automotive Division – Analysis of Net Liquidity 1)
(January to September 2019)
 [€ billion]

30

25                                                                                                              -5.3
                                                                                                      9.0
                                                                                                                            -1.1
20                                                                                                                                       -2.4           1.4       -0.7
                                       -1.2                -0.6                  1.4
15

10                                          Net Cash flow (€ 8.6 bn)                                                                                                        19.8
               19.4

  5

  0
            31.12.2018           Diesel Outflow             M&A           China Dividend            Operating   IFRS 16     MAN        Dividend to   TRATON IPO   Other   30.09.2019
                                                                                                    Business              minorities     VW AG
                                                                                                                                       Shareholder

1) All figures shown   are rounded, minor discrepancies may arise from addition of these amounts.

                                                                                                                                                                                       9
Leading the Transformation - Andreas Buchta, Senior IR Manager Monika Kowalski, IR Officer Volkswagen AG Group Investor Relations - Volkswagen Group
Volkswagen Group – Outlook for 2019

                                                           +0.9%
                               Deliveries to       10.7            10.8
                                customers                                              on the level of prior-year
                                 (‘000 vehicles)
                                                   2017            2018                         2019

                                                           +2.7%

                              Sales revenue        229.6           235.8
                                   (€ billion)                                         grow by as much as 5%
                                                   2017            2018                         2019

                                                      1)                  1)
                                 Operating          7.4             7.3
                              return on sales                                  Range of 6.5 – 7.5% (before Special Items)
                                      (%)
                                                   2017            2018                         2019

 1)   before Special Items.
                                                                                                                            10
The transformation of our portfolio has started

    Broad product portfolio    Transformation     CO2 neutral cars

                   ICE

                BEV

            2020                                         2050

                                                                     11
Our worldwide SUV mix is expected to increase strongly

  Volkswagen Group - SUV share
  (in % of regional Group Deliveries to Customers)                           Europe   China    NAR

                                                                                              > 50%

                                                                                               49%

                                                                                               56%

Worldwide
 ≈ 13%
     12%                                                                                       69%
     14%
     17%
    2014    2015   2016   2017    2018    2019       2020*   2021*   2022*   2023*    2024*   2025*
 * Target

                                                                                                      12
The significant increase in BEV deliveries will support CO2 compliance

Volkswagen Group – BEV volume by regions
(BEV share of total Group Deliveries in %)                                                     Europe    China   NAR       RoW

                                                                                                                    > 20%
                                                                                                                 ≈ 3 mn units
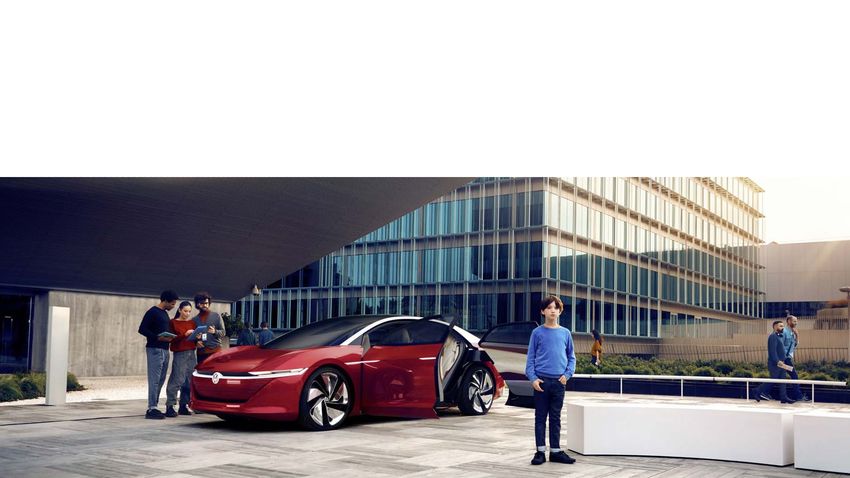
       e-tron       e-Bora                 ID.3         e-Mii
       Taycan       e-Lavida               el-Born      e-Citigo
       Q2L e-tron   Moia Shuttle           e-tron SB    Taycan Sport Turismo
       eTGE                                e-Tharu      Vision iV
                                           ID.Crozz

                                   ≈ 4%
           ≈ 1%

           2019                    2020*               2021*                   2022*   2023*            2024*          2025*
* Target

                                                                                                                                 13
Development Global passenger car markets

 Markets by regions (2020-2025)
                                                                                                                      >20%

                                                                                                        > 20%

                                                                                        > 20%
                                       ~ 5%                    ~ 2%

              2020                    Europe             North America            South America      China incl. HK   RoW    2025

North America and South America incl. Light Commercial Vehicle; Source: IHS Markit I November 2019                                  14
Group KPI’s confirmed
   Key financial targets                                           2016                     2017              2018         2019          2020           2025
                                                                   Actual                   Actual            Actual      Outlook      Strategic      Strategic
                                                                                                                                        Targets        Targets
   Operating return on sales                                        6.7%                      7.4%            7.3%        6.5-7.5%      6.5-7.5%        7-8%
   Before Special Items

   Return on investment
   Automotive Division before Special                              13.9%                    14.4%             13.1%       12-14%       12-14%2)        >14%2)
   Items

   Capex ratio                                                      6.9%                      6.4%            6.6%        6.5-7%          6%             6%
   Automotive Division

   R&D cost ratio                                                   7.3%                      6.7%            6.8%        6.5-7%          6%             6%
   Automotive Divison

   Cash                     a) Net Cashflow1)                    € 4.9 bn                € 10.3 bn           €5.6 bn      ≥ €9 bn      ≥ € 10 bn      > € 10 bn
   Automotive Division
                                                                                                                         > € 15 bn2)   > € 20 bn2)   ~10% of Group
                           b) Net Liquidity                     € 27.2bn                 € 22.4 bn           € 19.4 bn                                 turnover
1) Ex                                                                                                                                                                15
        Diesel payments and M&A 2) Including the negative IFRS 16 impact, effective from 1st January 2019.
CY 2020 - Updated
                       Basis: Result 2016                               2020 Updated
                                            CMD March 2017      PR 66          PR 67      PR 68

Sales revenue (€ bn)         217.3           + > 20 %        + > 25 %        + > 25 %   + ≥ 20 %

Operating profit (€ bn)
before special items          14.6             + 25 %        + ≥ 25 %        + > 30 %   + ≥ 25 %

Profit before tax (€ bn)      14.8           + ≥ 25 %        + ≥ 30 %        + ≥ 40 %   + ≥ 30 %

Earnings per Pref. Share 10.3 €                 ≥ 25 €         > 25 €          ≥ 30 €   27-28 €
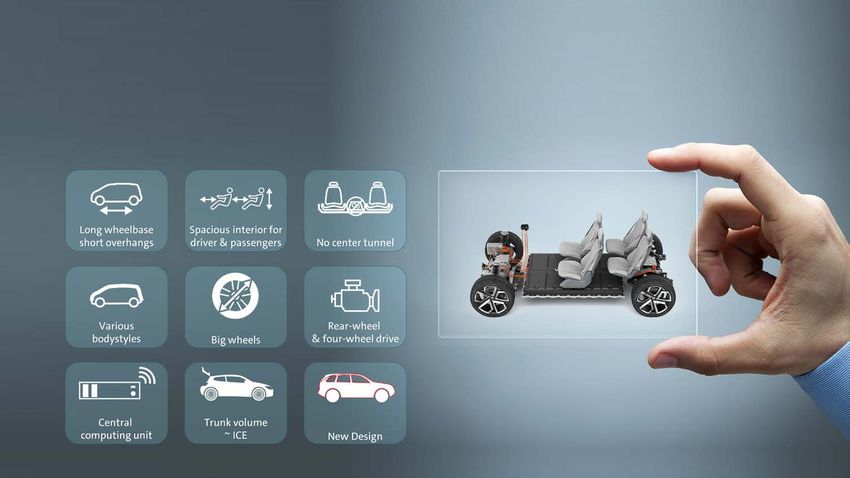
                                                                                                   16
Scalable Technology: The dedicated platforms (MEB/PPE) guarantee
superior customer experience, scale and versatility

                                                                   17
The ID. DNA | What makes our ID. Family special

          Visionary      New sense of        Smart           Intuitive       Sustainable
           design           space          connected         usability        platform

            Affordable | High Ranges | Fast Charging Technology | Good residual values

                                                                                           18
To maximize the climate impact of MEB we are open to share it to other
car manufactures as well

           Large range                                                                                  designed for
       1                                                                                            8   fast charging

                                                                                               high
                                                                                          7    performance
               2   attractive costs

                                                                                         long
                                                                                     6   lifespan
                         3   maximum security

                                                    robustness and       worldwide
                                                4   availability     5   use

                                                                                                                        19
The car becomes the most complex internet device

                                                   20
Expanding production of electric vehicles worldwide on a massive scale by
the end of 2022

                                                                            21
BEV challenges addressed by three key elements

                                                 22
Driving forward Strategy: New collaborative approach

                                                       23
Ford and Volkswagen extend global alliance, Volkswagen simultaneously
   invests in Argo AI
                                                      EQUAL SHAREHOLDER WITH FORD;
                              VOLKSWAGEN TO SUPPLY       TRANSACTION REPRESENTS
             ANNOUNCED 2019
                              MEB PLATFORM TO FORD          $7.25B VALUATION*
                                                           NEW COLLABORATION

                                                        VOLKSWAGEN
                                                            MAKES
             COMMERCIAL VAN      FULLY ELECTRIC
                                                        AUTONOMOUS
               AND PICKUP          VEHICLES
                                                           DRIVING
                                                         INVESTMENT

*Estimated                                                                           24
Key Messages

 1.                  2.                3.                  4.
    Leading the       Cost effective         First in      Increased focus
 transformation to   transformation    transforming into          on
     e-mobility           path           software OEM       value creation

                                                                             25
TRATON Group – New Era for TRATON with IPO
• TRATON shares began trading on the regulated market of the Frankfurt Stock Exchange (Prime Standard) and the
  regulated market of Nasdaq Stockholm (Large Cap Segment) in June 2019.
• Significant step to create additional value for all stakeholders and drive the Global Champion strategy.

      Global Champion                       Growth                     Profitability                   Execution

 • Scale and global reach        •   Customer value focused     • Focus on earnings growth
   through leading brands            product and service          and cash generation
   and strategic alliance            offering                                                 • Strong team with
                                                                • Stand alone brand             industry-leading track
   partners                      •   New product generations      performance and synergies     record
 • Strong platform enabling      •   Further expansion in key   • Concrete path to
   growth and positioning for        geographies through          profitability improvement
   best-in-class profitability       smart partnerships
                                                                                                                         26
Volkswagen Financial Services 1): global, well diversified and successful
                                        Strong global presence                                                                                   Continuous portfolio expansion

                                                                                                                      in ‘000 contracts
                                                                                                                                                                                                                  10,102
                                                                                                                                                                       7,641                 7,717
                                                                                                                                                7,218                                                                                Total
                                                                                                                               6,322
                                                                                                                                                                                                                   4,564           portfolio
                                                                                                                                                2,760                  3,921                 4,149                                  21,223
                                                                                                                               2,518

                                                                                                                               5,833            6,155                  5,672                 5,935                 6,557

                                                                                                                               2015           2016                  2017 *                2018          Q3 2019 **
                                                                                                                                           Financing             Leasing           Insurance / Services
                                                                                                                                                    *)   Reclassification Finance / Lease contracts **) contracts from international JVs included

                             Rising penetration rates (without China)                                                                              Diversified funding structure

                                                                                                                       Equity, liabilities to                                                    Asset backed securitization
                                                                    49.4%            49.3%                             affiliated companies,                                   18%
                                48.7%                                                                                  other                                 31%
                                                  47.8%
               46.9%

                                                                                                                                                              16%                35%                                   Bonds,
                                                                                                                                                                                                         Commercial Paper,
                                                                                                                       Customer deposits                                                              liabilities to financial
                                                                                                                                                                                                                 institutions
                                                                                                                                                                30.09.2019: € 219.3 bn
1)   Excl. activities of Scania and Porsche Holding Salzburg; incl. Financial Services of Porsche AG and MAN Financial Services.
                                                                                                                                                                                                                                           27
Volkswagen Brand – Pushing the Turnaround in the US with new products
                                                                           SUV offensive #1     Sedans    SUV offensive #2
 Deliveries to US customers, ‘000’ units
                                                                                 2017           2018-19        2019-21
  500

                                                                 306               Atlas          Jetta      Atlas Cross Sport

  250

                                                                                  Tiguan         Passat       Compact SUV

     0    2012   2013    2014     2015     2016    2017   2018 1-10/2019       Refreshed Golf    Arteon         ID Crozz

Market
          3.0      2.6      2.2          2.0      1.8     2.0     -
Share %

                                                                                                                                 28
Volkswagen Group China performance
(January to October 2019 vs. 2018)                                                                                                                             January – October 2018
 [thsd. units]                                                          Proportionate operating profit, January to September
                                                                                                                                                               January – October 2019
                                                                                                                               [units]

4,000
                                                                                               -4.3%                                                               -32.6%
                      -1.8%                                                                                                                                                      5,000
                                                                                  € 3.3 bn                € 3.2 bn                                               4,603
                 3,405                                                                                                                                                           4,500
3,500                     3,344
                                            -0.1%                                                                                                                                4,000
3,000
                                        2,515                                                                                                                                    3,500
                                                 2,492                                                                                                                   3,101
2,500
                                                                              Q1-Q3 2018            Q1-Q3 2019                                                                   3,000
2,000                                                                                                                                                                            2,500
                                                                                                                                                -30.1%
                                                                                                                                                                                 2,000
1,500                                                                                                                                          1,703
                                                                                                                                                                                 1,500
                                                                  +2.1%                                                           >400%                1,191
1,000
                                                                                        -20.0%                                                                                   1,000
                                                               540     551                                                               703
                                                                                                               +13.7%
     500                                                                              276     221                                                                                500
                                                                                                              63     72          123
         0                                                                                                                                                                       0
                                   1)

1)   Incl. Hong Kong, excl. Ducati. Group numbers incl. Volkswagen Commercial Vehicles, Scania and MAN.                                                                                29
Together4Integrity: Group-wide integrity and compliance program in full
swing                     STRATEGY
                                                       Ethics and compliance is
                                                       central to business strategy

  RISK MANAGEMENT                                                           ~50%1)    CULTURE OF INTEGRITY
  Ethics and compliance risks                                         1               Leaders at all levels across the
  are identified, owned,                                          2        3          organization build and sustain
  managed and mitigated                                       4                5      a culture of integrity

  SPEAK-UP ENVIRONMENT                                                                RESOLUTE ACCOUNTABILITY
  The organization encourages,                                                        The organization takes action
  protects and values the                                                             and holds itself accountable
  reporting of concerns and                                                           when wrongdoing occurs
  suspected wrongdoing
1) Group   entities covered; as of 12th March, 2019.
                                                                                                                         30
Group Compliance action plan for 2019

                1   Whistleblower Group Guideline
Standards,
Organization    2   Staffing of Group Compliance

                3   Strengthening the group-wide Compliance Organization

  Processes     4   Consistent Compliance Risk Assessment
   & Tools          Worldwide Anti-Money Laundering System
                5

                6   Risk-based revision of group guidelines

  Business      7   New Business partner approval process for suppliers and sales organization
  partner           Compliance in M&A transactions and post merger integration for non-controlled shareholdings
                8

Certification   9   Support Monitorship + implementation of Monitor Recommendations

                                                                                                                  31
Investor Relations Team
We are pleased to answer your inquiries regarding Volkswagen shares and other capital market related
questions.

                Helen Beckermann (Wolfsburg office)
                Interim Head of Group Investor Relations
                E-Mail: Helen.Beckermann@volkswagen.de
                Telephone: +49 5361 9 49015

                Alexander Hunger (Wolfsburg office)                           Andreas Buchta (Wolfsburg office)             Ulrich Hauswaldt (Wolfsburg office)
                Senior Investor Relations Officer                             Senior Investor Relations Manager             Senior Investor Relations Officer

                E-Mail: Alexander.Hunger@volkswagen.de                        E-Mail: Andreas.Buchta@volkswagen.de          E-Mail: Ulrich.Hauswaldt@volkswagen.de
                Telephone: +49 5361 9 47420                                   Telephone: + 49 5361 9 40765                  Telephone: +49 5361 9 42224

                Andreas Kowalczyk (Wolfsburg office)                          Monika Kowalski (Wolfsburg office)
                Senior Investor Relations Officer                             Investor Relations
                E-Mail: Andreas.Kowalczyk@volkswagen.de                       E-Mail: Monika.Kowalski@volkswagen.de
                Telephone: +49 5361 9 23183                                   Telephone: +49 5361 9 31106

 The official website of Volkswagen Group Investor Relations. Company topics, brandchannels, innovation and informations.                                            32
Appendix
The Shareholder Structure, Supervisory and Management Board
      Shareholder Structure of Volkswagen AG                         Supervisory Board of Volkswagen AG                        Board of Management of Volkswagen AG1)

Number of Outstanding Shares            Preferred shares       Chairman          Hans Dieter Pötsch                          Chairman of VW AG       Dr. Herbert Diess
                                        206,205,445                                                                          and VW Passenger
                                                               Members           Dr. Hussain Ali Al Abdulla                  Cars brand
                                                                                 Dr. Hessa Sultan Al Jaber
                                                                                 Dr. Bernd Althusmann
                                     41,1%                                                                                   Porsche AG               Dr. Oliver Blume
                                                                                 Dr. Hans-Peter Fischer
                  58,9%                                                          Marianne Heiß
                                                                                 Jörg Hofmann                                Human Resources         Gunnar Kilian
                                                                                 Johan Järvklo
Ordinary shares                                                                  Ulrike Jakob
   295,089,818                                                                                                               TRATON Group            Andreas Renschler
                                                                                 Dr. Louise Kiesling
Current Voting Rights Distribution                                               Peter Mosch
                Others                                                           Bertina Murkovic                            Audi AG                 Abraham Schot
                                                                                 Bernd Osterloh
                        10,8%                                                    Dr. jur. Hans Michel Piëch                  Integrity and Legal     Hiltrud Dorothea Werner
Qatar Holding                                                                    Dr. jur. Ferdinand Oliver Porsche           Affairs
                  17,0%                                                          Dr. rer. comm. Wolfgang Porsche
                                     52,2% Porsche SE,                           Conny Schönhardt
                                           Stuttgart2)                           Athanasios Stimoniaris                      Finance and IT          Frank Witter
                     20,0%                                                       Stephan Weil
                                                                                 Werner Weresch                              Components and          Dr. Stefan Sommer
  State of Lower
                                                                                                                             Procurement
 Saxony, Hanover                 (as at December 31, 2018)
1)   Each Board Member is responsible for one or more functions within the Volkswagen Group. The work of the Board of Management of Volkswagen AG is supported by the boards   34
     of the brands and regions as well as by the other group business units and holdings. 2) On March 13 2019, Porsche SE announced increase in voting rights to 53.1%.
Automotive Division – Research and Development Costs
 (January to September 2019 vs. 2018)
  [€ million]

                                       2019                                                           2018
12,000                                                                 12,000
                              33.2%
                                                                                            36.9%
                              3,667
                                              2,807
 8,000                         34.3%                                    8,000                 3,505          2,812
                                                                                             35.6%

                 10,697                                                           9,850
                                                           9,837                                                           9,157
 4,000                                                                  4,000

       0
                  Total      of which     amortization Recognized in              Total      of which     amortization Recognized in
                R&D costs   capitalized                 the income              R&D costs   capitalized                 the income
                                                        statement                                                       statement

                                                                                                                                       35
Diesel issue: Special Items & payments
            € (bn)    Diesel special items                                 Payments
                                           Legal    7.0

                                    Other items     9.2
    2015
                                                                                          -
                                                   16.2

    2016
                              Mainly legal risks    6.4                                ~3.0

                       Buyback/retrofit program     2.2
    2017                                  Legal     1.0
                                                    3.2                               ~16.1

    2018                      Mainly legal risks    3.2                                ~5.3

     2019                     Mainly legal risks    1.3                  Expected      ~2.0

    Total                                          30.0   Payments made until 2018    ~24.6

                                                                                          36
We are speeding up the transformation and becoming the leading
provider of sustainable mobility.
You can also read