Lessons from the Marshmallow Test - Stephanie M. Carlson, Ph.D. Institute of Child Development University of Minnesota Reflection Sciences ...
←
→
Page content transcription
If your browser does not render page correctly, please read the page content below
Lessons from the Marshmallow Test

        Stephanie M. Carlson, Ph.D.
       Institute of Child Development
          University of Minnesota
             Reflection Sciences

    Federal Reserve Bank of Minneapolis 2018
                                               1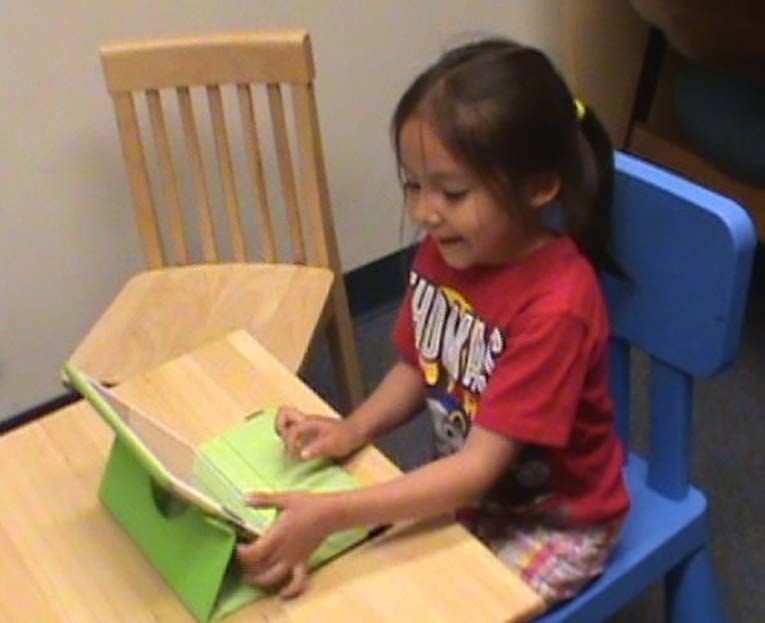
• Disclaimer: Stephanie Carlson and Philip Zelazo are entitled to royalties from the
  sale of the Minnesota Executive Function Scale by Reflection Sciences, LLC

• The University of Minnesota has a right to receive royalties from the sale of the
  Minnesota Executive Function Scale
Mischel and Ebbeson (1970) ©Tom McQuaid, Character Lab
Walter Mischel, PhD
     1930-2018
“Marshmallow Test” is a
Measure of Executive Function
             • Working memory
             I can remember the goal of this activity

             • Inhibitory control
             I can wait to respond and control my
             impulses

             • Flexibility/shifting
             I can think about this in a new way or
             distract myself

                                       Mischel and colleagues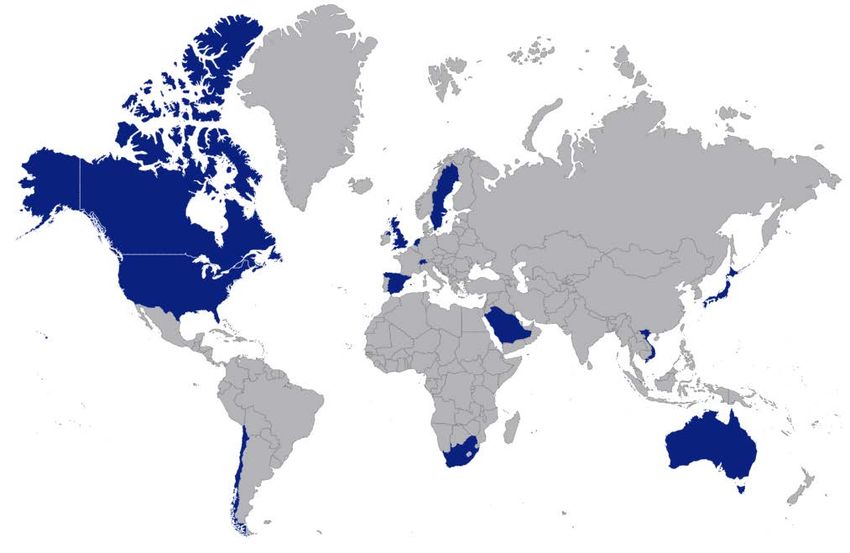
Proportion of Time Delayed as a Function of
                                                   Age Group
                               1

Proportion of Time Delayed
                             0.9
                             0.8
                             0.7
                             0.6
                             0.5
                             0.4
                             0.3
                             0.2
                             0.1
                               0

                                                    Age Group
                                                                F(6, 680) = 8.46, p < .001; Carlson (2011)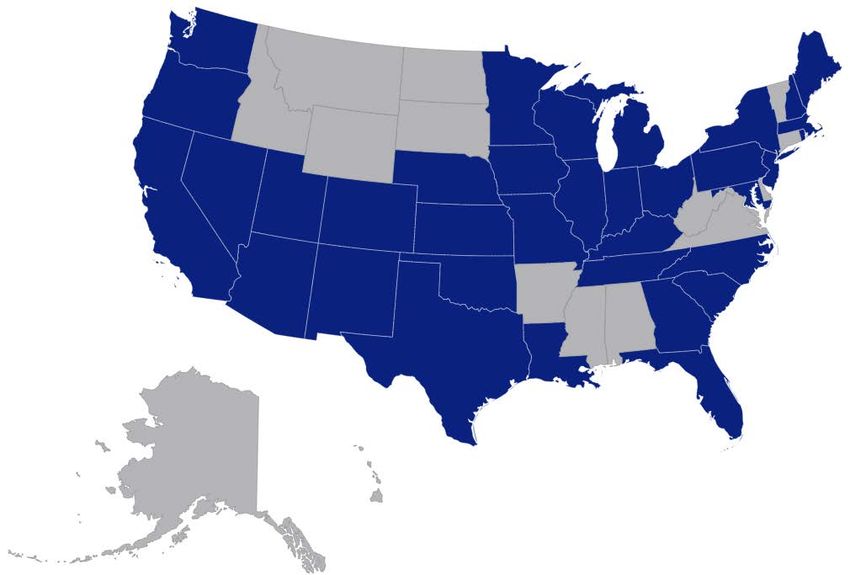
Reflection Self-talk
How did Jane do?
Long-term Outcomes Associated with
       Delay of Gratification at Age 4

4      Adolescence           20s             30s               40s
      EF (Go-NoGo)         Fewer             Goal setting      Better regulated with
      Academic             interpersonal     Self-regulation   reward stimuli,
      Social               and drug          Lower BMI         behaviorally and in
      Coping with stress   problems                            the brain
      SAT scores           Higher ed level
                           Better coping
Has Children’s Ability to Delay
     Gratification Changed Over Time?

“The children now love luxury; they have bad manners,
contempt for authority; they show disrespect for elders and
love chatter in place of exercise. Children are now tyrants,
not the servants of their households. They no longer rise
when elders enter the room. They contradict their parents,
chatter before company, gobble up dainties at the table,
cross their legs, and tyrannize their teachers.”
U.S. National Survey Study • Delivered via Amazon’s Mechanical Turk (MTurk) • 354 Adults (49% female) • Age 20-69 years (M = 36) • White (83%); African American (6.8%); Asian 6.8%); Hispanic (5.6%) • 41 different states • Household income $25k-200k (Median = $25k-50k) • 54% were parents
When compared with children 50 years
ago, do you think children today would
wait…
       300

       250

       200

       150
               257

       100

        50              90

                                7
         0
             Shorter   Same   Longer
Cohort Study
• 1960s: N = 165 (Stanford)
• 1980s: N = 135 (Barnard)
• 2000s: N = 540 (UWA and UMN)
• Ages 3-5 years; ~50% female
• Similar race/ethnicity and SES
• Followed the standard procedure w/ both rewards
visible and a bellWhat did the data show?
600
500
400
300
200
100
0
1960s 1980s 2000s
Linear trend (R = .21, R2 = .043), F(1, 839) = 38.11, p < .0001;
Carlson, Shoda,… Mischel (2018, Dev Psych)Why did adults get it wrong? • Persistent complaints about “kids today” – Socrates • Lack of perspective taking – Children do have less self-control than you • Concerns about technology • Rising standards
“As we care about more of humanity, we’re
apt to mistake the harms around us for signs
of how low the world has sunk rather than
how high our standards have risen.”

--Steven Pinker (2017) Enlightenment Now
Why has delay of gratification improved?
• The basics: GDP, nutrition, etc.

• Abstract thought -- a benefit of technology?

• Parenting -- more autonomy-supportive

• Preschool education
Preschool Enrollment

                       Karch (2013)
Our work is far from over…
Delay Time (Minutes)
7
6
5
4
3
2
1
0
Non-college College
Watts et al. (2018)Proportion of Time Waited by Population Adjusting
for Age and IQ
1
0.9
0.8
0.7
0.6
0.5
0.4
0.3
0.2
0.1
0
ost
P Homeless Overweight/ Preschool Typical
Institutionalized Shelter (n=23) Obese (n=27) (n=95) (n=464)
(n=51)
Population
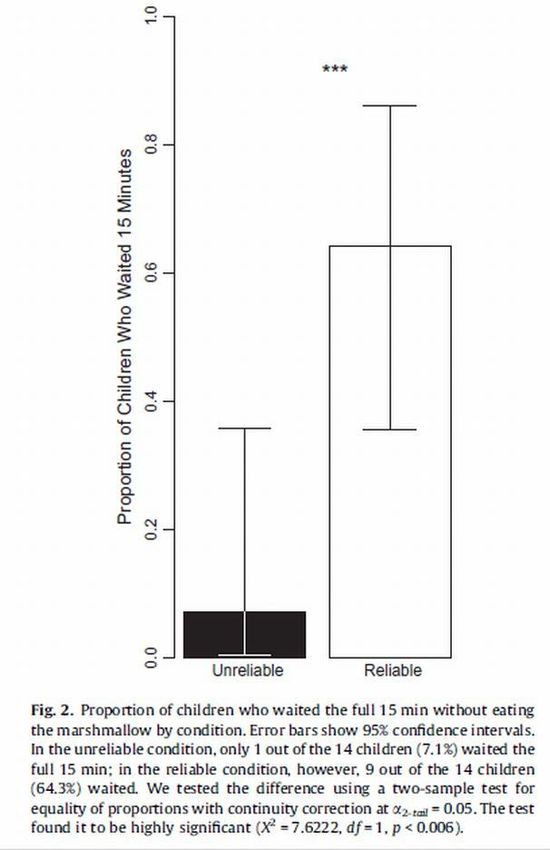
F(6, 576) =7.08, p < .001; Carlson (2011)Adaptation in Low-Trust, Low Resource Environments?
Kidd et al., 2012Limitations of the Marshmallow Test • Food rewards • Trust • Not below age 3 • Not above age ~10 • Has a bimodal distribution (“fail” or “pass”) • Not good for repeated assessment • Not practical for school settings • Not age-normed
Minnesota Executive Function Scale
(MEFS™) App
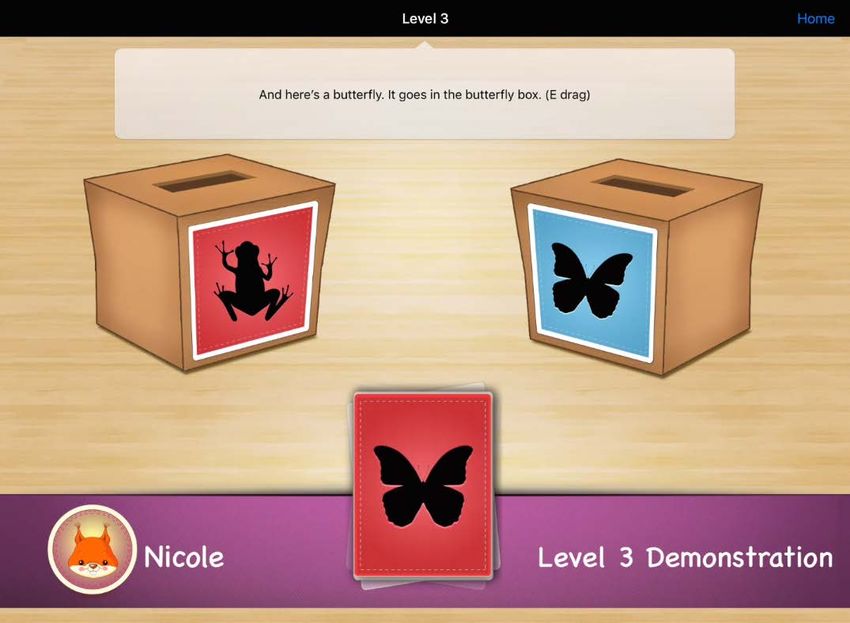
Carlson & Zelazo, 2014The 3 Facets of EF
Cognitive
Being able to switch between rules
Flexibility
Working Remembering the rule and applying it in the
Memory correct way on a given trial
Resisting reflexive response of sorting by
Inhibitory
the initial rule in order to sort by the correct
Control
but conflicting rule…170+ locations across 35 US States…
…and 13 Countries using 10 Languages
Executive Function from 2 to 70
             9
             8
  EF Skill   7
             6
             5
             4
             3
             2
             1
             0
                 2 3 4 5 6 7 8 9 10 15 20 30 40 50 60 70
                             Age (years)
                                                  Zelazo et al., 2013; Carlson & Zelazo, 2015
MEFS Performance by Population Controlling for Age and IQ
Highest Level Passed
3.3
3.2
3.1
3
2.9
The EF Gap
2.8
2.7
2.6
2.5
2.4
2.3
Lab (576) Preschool (85) At-Risk (151)
N = 812. F(2, 811) = 9.80, p < .001, ηp2 = .024, R2 = .65. At-risk preschoolers
scored significantly lower than lab and community preschool samples. Bars show
SE.Lower SES is Associated with Lower EF # of 12-month periods (after 15 months old) when family income was at or below U.S. poverty line Adapted from Raver et al. (2013)
Trauma and EF

    Risk for Negative Outcomes

                                      # of ACES
                                                                      33

(ACEs Study Results – cdc.gov; Felitti, 2002; Felitti et al., 1998)
EF and School-Readiness • Indirect role in creating optimal conditions: – Pay attention to teacher’s directions – Sit still, keep hands to yourself – Persist when frustrated – Maintain positive peer relations • Direct role in learning itself: – Hold new information in mind to work with it – Inhibit old information or biases that interfere – Think about problems in a new way
Opportunity
         Achievement Gap
         Gap
EF Gap
MEFS is Responsive to Interventions
Casey, 2016 dissertationClosing the gap? Low-income Preschool Sites
Varying in Quality
55
50
MEFS National Percentile
45
Site B
40
Site C
Site D
35 Site E
Site F
30
25
Time 1 Time 2Take-home Messages • Marshmallow Test is a classic measure of Executive Functioning • Individual differences in delay are highly stable and predict later outcomes • Despite adult predictions to the contrary, preschoolers’ delay performance has increased since the 1960s • Preschool education might be one reason why • We do not know about lower SES children, who tend to perform less well • Newer measures suggest an EF Gap, beyond the Marshmallow Test • Minnesota Executive Function Scale (MEFS) is a standardized tool for measuring EF across the full spectrum, capturing growth sensitively, making data-informed decisions for ECE, comparing geographical regions, and tracking future trends
Thank you!

I am grateful to many colleagues, students, collaborators, as well as to those who provided
funding for our research.
Questions?
Contact:
Stephanie M. Carlson
smc@umn.edu
You can also read