Sustainable Fisheries Education Programme: Introduction to Sustainable Fishing (#ISF2020) - Fishing Into The Future
←
→
Page content transcription
If your browser does not render page correctly, please read the page content below
Sustainable Fisheries Education Programme:
     Introduction to Sustainable Fishing (#ISF2020)

                   Stock assessment masterclass

                         29th January 2020
               London Hilton and Billingsgate Market

Dr Carl O’Brien CBE
Defra Chief Fisheries Science Adviser
UK Delegate to ICES/ICES Vice-president
Modelling stocks:
• What is a fish stock?
SFEP YouTube video
• How are they assessed?
SFEP YouTube video
• Modelling straddling stocks
• Modelling shellfish – issues and problems
ICES’ sheets and reference points:
• MSY, Flim, SSB Blim etcetera – demystifying acronyms
• ICES’ sheets – finding what you need, reading what
you find
• Shared stocks, mixed fisheries and ecosystem
approach to management
Outline of presentation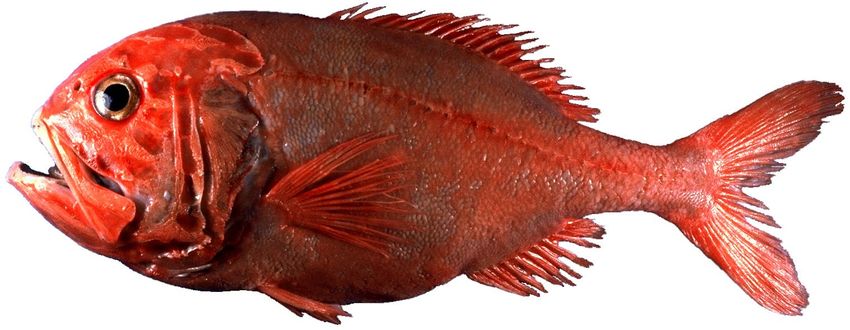
Diverse – over 300 shelf species

                                   ~ 20 species give over 85% value

   Fish (and shellfish)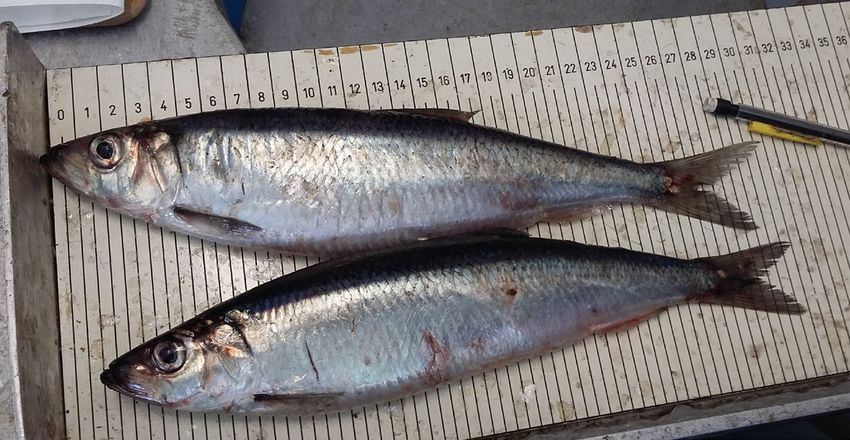
Context of fisheries
assessments and management
      advisory process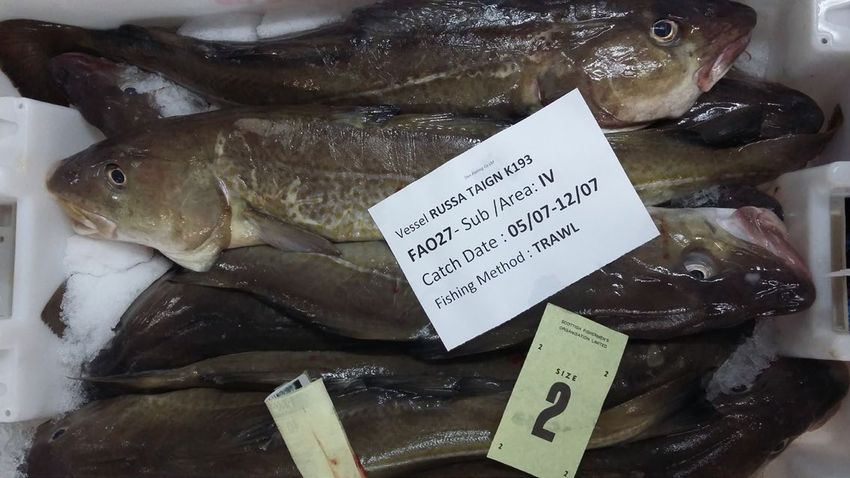
What is a fish stock?

A short animation describing why fisheries
scientists need to define stocks in the process of
stock assessments.

• Link: https://youtu.be/YWNe951bucY

Time: 4:43

      SFEP YouTube video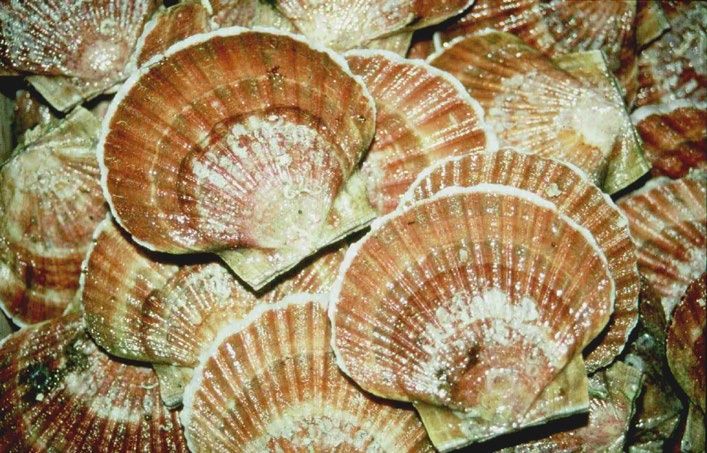
• Species

• Populations = stocks

• TACs ~~ stocks

• Sometimes not even
species; e.g. rays

• TACs by ICES’ areas

 Fish stocks

Different models for assessment
           and advice:
 –Availability and quality of
   data
 –Uncertainty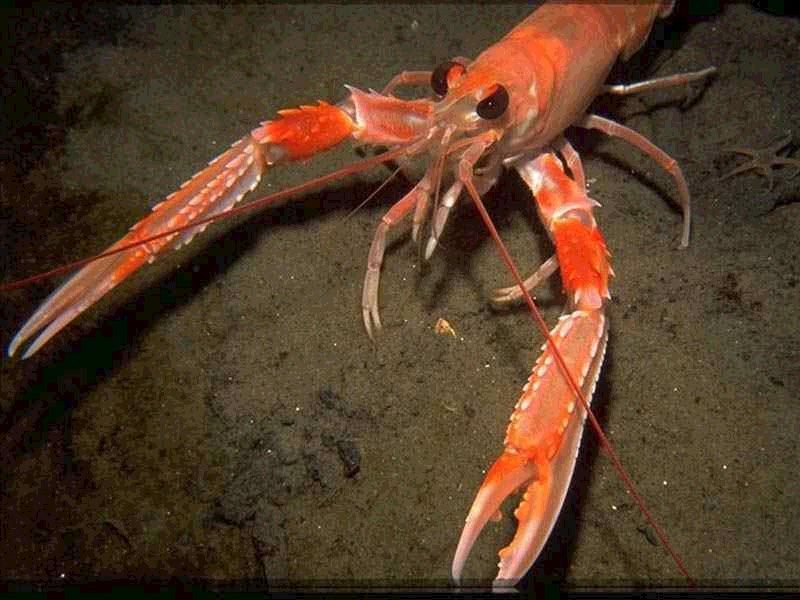
Stock assessment levels:

      Purpose of                                     Assessment type             Advice type

     assessment:                                 1: Quantitative: analytical
                                                                                  Maximum
    estimation of …                                                            Sustainable Yield
  • Stock status                                 2: Qualitative: analytical

                             Data availability
       (Spawning stock
       biomass)
                                                 3: Survey trends
  • Exploitation rate                                                            Data-limited
       (Fishing mortality)                                                        MSY proxy
                                                 4: Catch only
  • Reference points
                                                 5: Landings only
                                                                                Precautionary
  • Less                                         6: By-catch fishery
                                                                                  approach
    information=
    more uncertainty

Common Fisheries Policy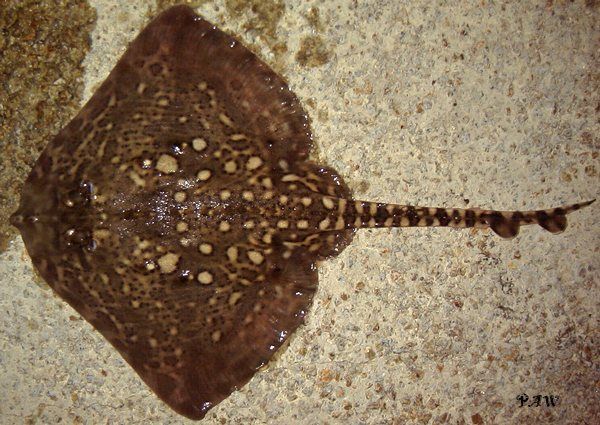
SCIENTIFIC ADVICE
                                                         ACOM/STECF

                                                                             MANAGERS
                               STOCK ASSESSMENTS
                               ICES EXPERT GROUPS
                                                    Annual cycle            COMMISSION
                                                                           MEMBER STATES

                                                  From surveys and
                                                sampling/models/stock
Start here: then   DATA COLLECTION
                   MARKET SAMPLING,
                                                 assessment/advice/                         COUNCIL OF

                                                      negotiated
                                                                                             MINISTERS

move clockwise
                    OBSERVERS, RV
                                                                                             SET TACS
                       SURVEYS

                                                     international
                                                 management/TACs &
                                                     quotas/local
                                      FISH STOCKS
                                                    management             ALLOCATION KEY
                                                                           WHO GETS WHAT

                                                        FISHING FLEETS

               Process overview: from
               science to management
But we are getting ahead of
       ourselves …
Why do we need to assess fish stocks?
A short animation explaining how and why fisheries
scientists measure fish stocks, and the role played
by the fishing industry to ensure these assessments
are accurate.
• Link: https://youtu.be/In72Jj6dGNA
Time: 4:39
SFEP YouTube videoWhy assess fish stocks? • To assess whether the exploitation rate is too high or too low in relation to management objectives for the fisheries exploiting them and whether the rate is sustainable in the long term. • To assess whether there are sufficient mature fish in the sea to allow the stock to replace itself over time. • To examine trends over time. • To forecast future catches. • Overall - to (try to) manage the exploitation rate.
Stock assessment is easy?

Data rich stock with an accepted analytical
assessment and forecast for MSY

  – Cohort analysis
Biological data on catch:

    Routine - Length,
    weight, sex ratio,
    maturity stage.

                                  Then age
                         determination from
                        ear bones (otoliths).

The End Game
How many fish of each age group were caught - for use in stock assessment
Numbers-at-age-matrix
Catch numbers in millions (North Sea
herring)
Year/rings 0 1 2 3 4 5 6 7 8 9+ Total
2003 369 617 1204 517 820 243 106 120 37 8 4042
2004 716 207 439 1326 520 726 171 101 71 22 4298
2005 1016 716 355 486 1318 480 576 115 108 39 5209
2006 879 222 401 311 465 999 253 249 63 44 3885
2007 621 236 219 412 283 308 628 147 132 23 3009
2008 798 235 332 185 199 137 118 215 74 43 2336
2009 650 176 259 107 93 86 38 53 110 33 1606
2010 575 281 287 233 123 83 63 34 59 55 1794
2011 779 160 368 274 218 130 63 52 60 65 2168
2012 773 285 455 673 404 306 150 104 88 102 3341
2013 462 413 325 484 571 422 327 145 152 160 3461
2014 1389 371 383 386 617 488 285 192 92 123 4323
2015 538 395 552 248 283 461 432 271 168 170 3517
2016 1584 109 625 819 293 280 368 307 186 173 4745
2017 462 209 109 1080 838 223 146 176 107 115 3463
2018 1337 73 206 201 1179 849 224 145 144 188 4546Numbers-at-age matrix
Catch at age (numbers in millions) of the total NSAS stock 2003–2018.
Year/rings 0 1 2 3 4 5 6 7 8 9+ Total
2003 369 617 1204 517 820 243 106 120 37 8 4042
2004 716 207 439 1326 520 726 171 101 71 22 4298
2005 1016 716 355 486 1318 480 576 115 108 39 5209
2006 879 222 401 311 465 999 253 249 63 44 3885
2007 621 236 219 412 283 308 628 147 132 23 3009
2008 798 235 332 185 199 137 118 215 74 43 2336
2009 650 176 259 107 93 86 38 53 110 33 1606
2010 575 281 287 233 123 83 63 34 59 55 1794
2011 779 160 368 274 218 130 63 52 60 65 2168
2012 773 285 455 673 404 306 150 104 88 102 3341
2013 462 413 325 484 571 422 327 145 152 160 3461
2014 1389 371 383 386 617 488 285 192 92 123 4323
2015
2016
538
1584
395
109
552
625
248
819
30 times!
283
293
461
280
432
368
271
307
168
186
170
173
3517
4745
2017 462 209 109 1080 838 223 146 176 107 115 3463
2018 1337 73 206 201 1179 849 224 145 144 188 4546
Catch-at-age (numbers in millions) North SeaNumbers-at-age matrix: catch
2013 year-class:
recruits in 2014
AgeRussell proposed the following equation for the biomass of a
population:
S2 = S1 + (A + G) – (C + M)
where
St – biomass of the population at time t
A – mass of new fish growing into the fishable component of the
population (recruits)
G – increase in mass of the new recruits plus other fish already of a
fishable size
C – mass caught
M – mass of fish that died naturallyThis year
Last year Next year
Timing of Assessments and Advice
2019 2020 2021
Fisheries Data
Assessment
Catch Predictions
Advice
Assessment Working Group in 2020,
assesses state of stock at end of 2019 &
predicts stock and catch in 2020 and 2021
From assessments to
adviceBrief consideration of shellfish:
generally, data-limitedShellfish fishery management
UK legislation since at
CFP regards them as a least 1877
National competence Most recent 2018 (England
only)
• EU MLS • MLS
• Western Waters • Technical
Effort Conservation
• >15m scallop dredge & crab
potters MeasuresUK management boundaries
DAs
Measures apply to all UK
vessels
MLS & Tech Con
IFCAs
Evolved from Sea Fishery
Committees
Jurisdiction to 6nm
Local Authority funded
• MLS
• Gear specification
• Effort restriction
• Time & space restrictionStock boundaries
• International assessments
• boundary definitions (& adjustments)
• Nephrops only
• biology
• hydrography
• fisheries
• existing management
• data availability
Cefas (6) & Marine Scotland (12) = 18 Crab assessment
unitsScallop assessment
• Scotland 7 areas
• Sedentary
• Age based
• Specific habitats
• Long-term monitoring
• Local growth rates
• Large scale recruit
• England 9 areas (6 assessed)
distribution
• Direct biomass estimate
• International fisheries
• 2 years monitoring
• Joint assessment programme Industry/Defra/Cefas
• Started 2016
• 1st Assessment 2018
• Biomass & harvest rate estimates
• MSY proxies to be developed
• Dredge survey (vessel paid by industry)
• Biological sampling – part industryNext challenges
• Highly migratory
• Live 1-2 years
• Very fast growth
• Die after spawning
• Management objectives?
• Low discard survival
• International fisheries
• Some targeting
• Previous ICES’ interest
• Sedentary
• No larval dispersal
• Very local growth rates
• Domestic fisheries (over
6nm)
• IFCA interest
• Age determination possibleNew solutions
Better assessments = more data!
Industry often the best platform
Use of technology
• Minimise time impact
• Maximise utility to fisher & scienceICES’ sheets
and
reference points• Measure of the proportion of fish taken from a stock each year by fishing activity − Fishing mortality (F) • Total weight of a species population capable of reproducing − Spawning stock biomass (SSB) • Number of fish becoming available to a fishery stock in a year − Recruitment (R) − Number of any one annual spawning (Year-class) Terminology
Fishing, long-
                       term yield
                       and profit

Prosperous fishing
industry
Maximum Sustainable Yield (MSY)
• 2013 adoption of MSY
within reformed CFP
• By 2015 (2020 latest)
• MSY=Trade-off between
population growth and
mortality
• Management controls F
not SSB
• Target therefore FMSYAffects bio-economic performancef Affects sustainability of stock Lowestoft: 1950s 1970s
ICES gives advice in relation to:

 - existing management plans (MP)
 - high long-term yield (MSY)
 - precautionary limits (PA)
 - mixed fisheries & the ecosystem

 Safe biological limits
Selected example
      of the
 state of stocks
   and advice
Cod in North Sea, eastern English Channel and Skagerrak
Biomass indices by sub region
• Large downward revision in final 2 years in all
areas
• No recovery in the southern area in the mid 2000s.Cod in North Sea, eastern English Channel and Skagerrak
• Large reduction in fishing pressure
• State of the ecosystem affecting the stock
• Low recruitment last ~15 years
• Increasing water temperatures making parts of
the North Sea less suitable for cod in recent years
An EU multiannual management plan (MAP) has been agreed by the
EU for this stock (EU, 2018). This plan is not adopted by Norway, thus
not used as the basis of the advice for this shared stock. ICES was
requested by the EC to provide advice based on the MSY approach and
to include catch scenarios for the MAP. EU–Norway have requested an
evaluation of multiple management strategies (ICES 2019b), which are
currently under consideration.Published 28 June 2019
Published 8 November 2019
December 2019: Council of
the European Union (Fisheries)
Food webs and more
Landings
 bigger
than TAC

Landings
below TAC

            Mixed fisheries approach
You can also read