PLANNING FOR THE RECOVERY - Adam Sacks President Tourism Economics January 2021 - South Dakota Tourism ...

Page created by Marion Jennings
 
CONTINUE READING
PLANNING FOR THE RECOVERY - Adam Sacks President Tourism Economics January 2021 - South Dakota Tourism ...
PLANNING FOR THE RECOVERY

Adam Sacks
President
Tourism Economics
adam@tourismeconomics.com

                            January 2021
PLANNING FOR THE RECOVERY - Adam Sacks President Tourism Economics January 2021 - South Dakota Tourism ...
“It is said that the darkest hour of the
night comes just before the dawn.”

Thomas Fuller, 1608-1661
English churchman and historian

Penned within a travelogue of the Holy Land

Died at age 53 of epidemic infectious disease
PLANNING FOR THE RECOVERY - Adam Sacks President Tourism Economics January 2021 - South Dakota Tourism ...
The worst of times

 US COVID Deaths and Hospitalizations
 Deaths                                                               Hospitalized
 4,000                                                                      140,000

 3,500                                                                      120,000
                                        Deaths (7-day MA)
 3,000
                                        Hospitalized (right)                100,000
 2,500
                                                                            80,000
 2,000
                                                                            60,000
 1,500
                                                                            40,000
 1,000

  500                                                                       20,000

    -                                                                       -
         3/1   4/1   5/1   6/1   7/1   8/1   9/1   10/1   11/1 12/1   1/1
PLANNING FOR THE RECOVERY - Adam Sacks President Tourism Economics January 2021 - South Dakota Tourism ...
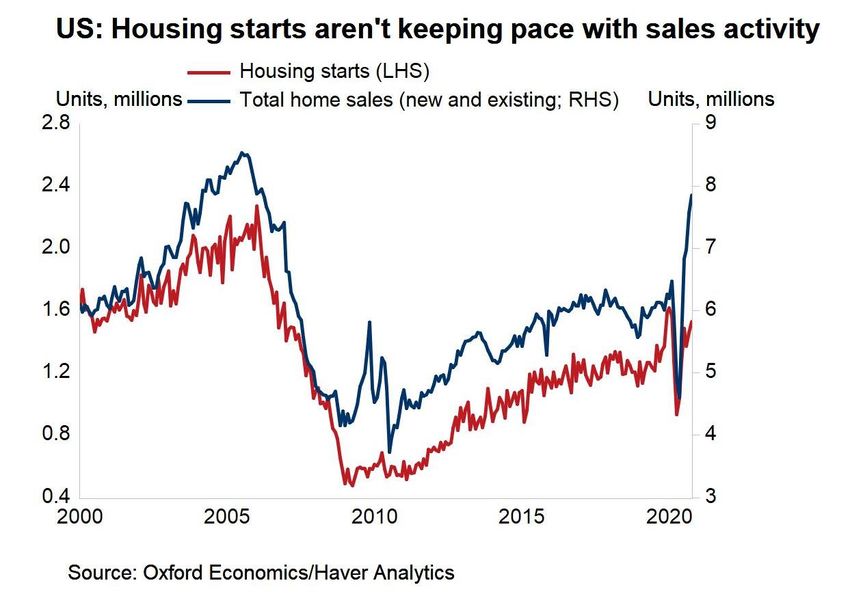
…but the best of times may be in sight

US: Estimated vaccine distribution
Millions of doses                         % of population vaccinated
200                                                                    100
                Vaccinations (doses)
                Optimistic case (%)
                                                                       80
150             Base case (%)
                Pessimistic case (%)
                                                                       60
100
                                                                       40

 50
                                                                       20

  0                                                                    0
      January     February   March     April     May       June

Source: Oxford Economics/CDC
PLANNING FOR THE RECOVERY - Adam Sacks President Tourism Economics January 2021 - South Dakota Tourism ...
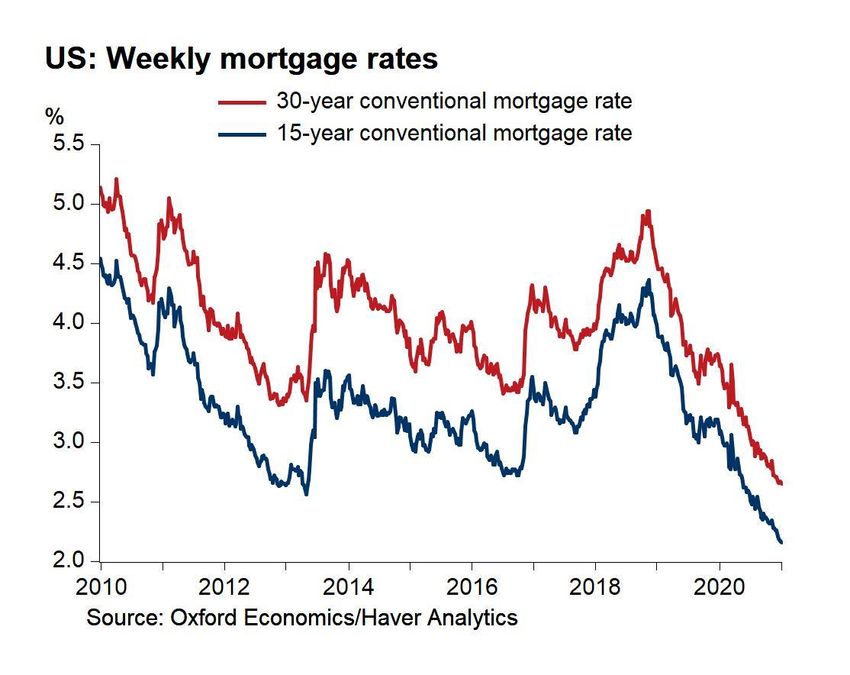
Vaccine diffusion will be gradual in 2021

 US: Covid-19 vaccination doses administered
  Daily doses                                                          %
700,000                                                                    3
                     Daily doses administered
600,000              Percentage of population                              2.5

500,000
                                                                           2
400,000
                                                                           1.5
300,000
                                                                           1
200,000

100,000                                                                    0.5

      0                                                                    0
          12/2112/2312/2512/2712/2912/31 1/2    1/4   1/6   1/8 1/10
 Source: Oxford Economics/Our World in Data
PLANNING FOR THE RECOVERY - Adam Sacks President Tourism Economics January 2021 - South Dakota Tourism ...
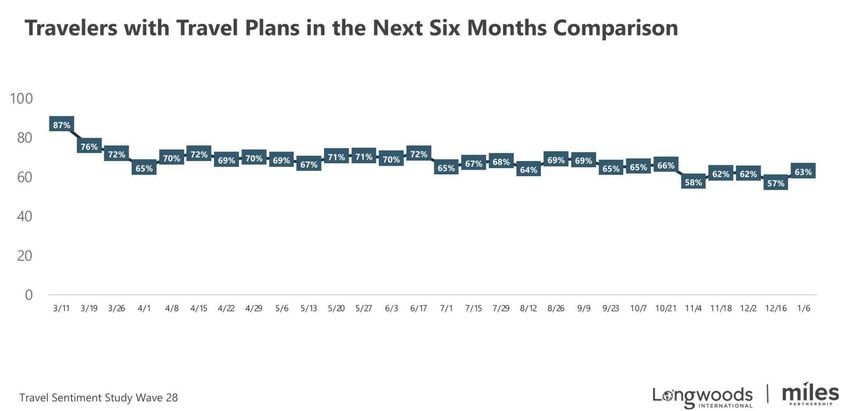
Three snapshots of the travel landscape

Travel performance
Year-over-year % change
  40%

  20%

                                                                                 Hotel room demand (+3%)
   0%
                                                                                 Auto trips (-2%)

 -20%

 -40%
                                                                                 Air pax (-54%)
 -60%

 -80%

-100%
        Jan   Feb    Mar Apr May   Jun   Jul   Aug   Sep   Oct   Nov Dec   Jan

Source: TSA, Arrivalist, STR
PLANNING FOR THE RECOVERY - Adam Sacks President Tourism Economics January 2021 - South Dakota Tourism ...
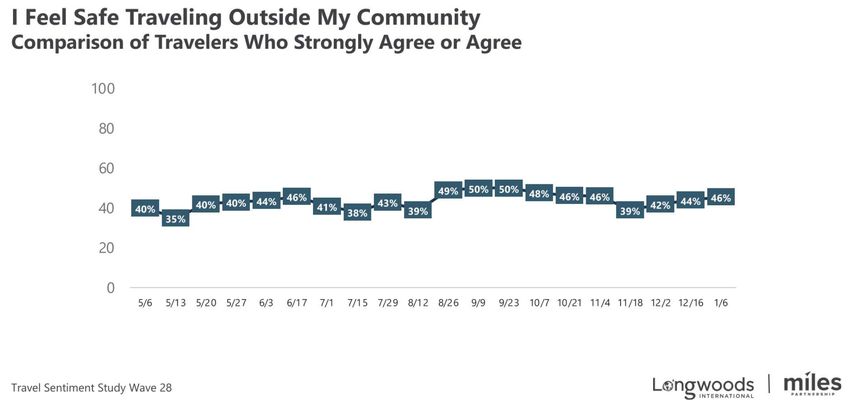
After a steep drop, SD travel has begun its ascent

 South Dakota monthly sales tax collections
 Y-o-y growth, by month, 2020

20.0%

10.0%                                                                     South Dakota visitor spending ($ billions)
 0.0%
         Jan   Feb   Mar   Apr   May   Jun   Jul   Aug    Sep       Oct
-10.0%

-20.0%

-30.0%                                                                                                                       +3%
-40.0%
                                                    Accommodat ions
-50.0%                                              Rest aurant s
-60.0%                                              Recreation

-70.0%

-80.0%                                                                                                                       $4.1
                                                                                                                      $4.0          -18%
                                                                                 $3.8               $3.9
Source: Tourism Economics, South Dakota Department of Revenue

                                                                                                                                    $3.4

                                                                                  2016              2017              2018   2019   2020

                                                                          Source: D. K. Shifflet, Tourism Economics
PLANNING FOR THE RECOVERY - Adam Sacks President Tourism Economics January 2021 - South Dakota Tourism ...
…placing SD among the best performing markets in the country

 Annual travel spending losses by state
 Year-over-year % change
  0%

 -20%

 -40%
                     Best 10 markets

 -60%
                                                             Worst 10 markets

 -80%

        Source: U.S. Travel Association, Tourism Economics
PLANNING FOR THE RECOVERY - Adam Sacks President Tourism Economics January 2021 - South Dakota Tourism ...
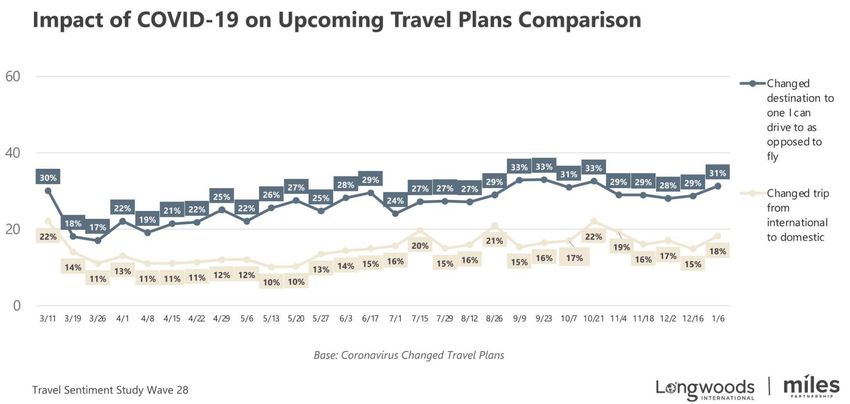
Travel confidence remains low but is trending… up!
And intentions to travel remain steady
How will the economy influence the travel recovery?
After recovering about half of losses, jobs fall

US: Nonfarm payroll employment
Millions
155

150

145
                                                                  Dec: -140k
                                           Feb-Apr:               Nov: +336k
140                                        -22.1mn             Oct: +654k
                                                            Sep: +711k
                                                          Aug: +1.5mn
                                                         July: +1.8mn
135
                                                        June: +4.8mn
                                                       May: +2.7mn
130

125
  Jan-18     Jul-18   Jan-19    Jul-19       Jan-20   Jul-20
Source: Oxford Economics/Haver Analytics
Unemployment rate still near recession peaks
US: U3 unemployment rate
%
16                                                             Apr:
                                                               14.7%
14

12                          10.8%
                                                       10.0%
10                 9.0%
                                      7.8%
8    7.1%
              6.1%                              6.3%                     Dec:
                                                                         6.7%
6

4

2                                                             Average of 7
                                                              prior recessions
0
 1960       1970          1980      1990     2000      2010         2020

Source: Oxford Economics/Haver Analytics
Participation rate at its lowest since the 1970s

 US: Labor force participation rate
  %
 69

 67

 65

 63                                     Lowest since 1977

 61

 59

 57
   1949     1959      1969     1979     1989    1999   2009   2019
 Source: Oxford Economics/Haver Analytics
Fed policy acting as wind in the sails
Housing activity remains very buoyant
Large and rapid fiscal stimulus without precedent
Policy upside risk shouldn’t be discounted

                                             ▪ Congress will likely pass, on a
                                               bipartisan basis, additional
                                               stimulus checks totaling $1,400/
                                               person on top of the $600
                                               checks passed at the end last
                                               year.
                                             ▪ President Biden will attempt to
                                               pass some of his spending and
                                               tax proposals via the budget
                                               reconciliation process requiring
                                               only a simple majority.
                                             ❑ 3rd round of stimulus checks
                                               should lift GDP by 0.7%.
When will travel recover?
Assumptions: Baseline

• 2021 Q1
  • Difficult start to year. Concerted efforts to get disease under control
  • Vaccine distribution accelerates in earnest
• 2021 Q2-Q3
  • Vaccination programs make a meaningful impact
  • Through ramp-up of vaccination programs, compliance with public health guidance, and improved testing,
    disease prevalence declines, immunity rises, and cases decline
  • Assume by the end of 2021 Q2, Covid-19 infection rates are low
  • Leisure travel picks up headed into summer
• 2021 Q4
  • Post-Labor Day, context for business travel and group events has normalized substantially. Corporate travel
    restrictions are eased. Group events are permitted in most areas, though certain restrictions continue.
  • With US perceived as substantially “safe from COVID”, group and business travel returns strongly (group
    demand recovering to about 20%-30% below 2019 levels in 2021Q4)
Will higher income households support recovery?

Share of leisure lodging spending by
income
  40%
                                                                                          39%

                                                                                                Households earning $100k+
                                                                                                account for 24% of
                                                                                                households… but 59% of
                                                                                                leisure spending on lodging
                      21%
                                                                     20%
                                                                                                Unemployment rate (October):
                                         14%      15%
           13%                 14%
                                                            13%                                 • High school grad: 8.1%
                                                                                11%
                                                                                                • Bachelor’s or higher: 4.2%

 Less than $40k $40k to $70k            $70k to $100k $100k to $150k             $150k and
                                                                                   more
                       Share of households            Share of spending

  Note: Lodging spending is based on recent three-year average (2015 to 2018). Consumer
  spending represents leisure trips. Pre-tax annual income, in thousands.
  Source: BLS; Tourism Economics
High income earners least impacted by the crisis

US: Share of workers who can telework by wage
level, in %

   Earnings greater than the 75th
                                                             61.5
             percentile

       Earnings from 50th to 75th
                                                      37.3
              percentiles

       Earnings from 25th to 50th
                                               20.1
              percentiles

Earnings less than or equal to the
                                         9.2
         25th percentile

                                     0         25       50     75   100
Source: Bureau of Labor Statistics/Oxford Economics
Rebound in consumer spending driven by low-income families
With spending on goods outpacing services

US: The K-shaped consumer spending recovery
 Feb 2020 = 100               Durable goods       14% *
120                           Nondurable goods        23% *

                              Services    64% *

110

100

 90

 80                                                            * Pre-Covid share of total
                                                               consumer spending

 70
      1/1   2/1   3/1   4/1   5/1   6/1      7/1     8/1      9/1 10/1 11/1
Source : Oxford Economics/Haver Analytics
$1.4tn cash stash for households
Major reshuffling of the deck
Leisure travel will fuel the recovery

Business and leisure trips
Index (2019=100)

120

100
        100 100                                      101
                                                                105
                                                                      99
                                                                           108
                                                                                 Leisure back to 2019 levels
                                                           93
 80                                     90
                                                85                               in 2022
                            76
 60

 40                                49                                            Business nearly back in
                      40
                                                                                 2024
 20

  0
         2019          2020        2021         2022       2023       2024

                                  Business    Leisure

Note: Only domestic trips
Source: Tourism
Source:         Economics
        U.S. Travel Association, Tourism Economics
Approximately three years to recover room demand levels

Room demand: US
Quarters relative to trough, level relative to prior peak
  20%

                                                            8 quarters to
  10%                                                       recover prior peak
                           Prior peak level
    0%                                                                                                    Room revenue is
                                                                           12 quarters to
 -10%                                                                      recover prior peak
                                                                                                          expected to recover
                                                   Next year: 2021 Q4                                     to its prior peak level
 -20%
                                                                                                          in early 2024, about
 -30%                                                                                                     four years after prior
                                                                                                          peak.
 -40%                               Today: 2020 Q4

 -50%

 -60%                            2020 Q2

 -70%
           -4        -2    Trough     2       4        6       8      10         12   14        16   18
                           ◼ Global Financial Crisis       ◼ Global Coronavirus Recession

Source: STR; Tourism Economics
…but the second half of next year will look very different

Room demand
Quarterly, relative to 2019

   10%                                                                                          2023 Q2
            0%                                                                                         1% 0%
    0%
                                                                                               0% 0%
                                                                              -3% -3%
  -10%                                                                -5% -4%
                                                               -9%
                                                        -12%
                 -14%
  -20%

                                                 -23%
  -30%
                                  -32%-33%                Strong recovery in 2021H2 to
                              -34%
  -40%                                                    demand levels about 10%
                                                          below 2019
  -50%

  -60%                  -57%

  -70%
            Q4 Q1 Q2 Q3 Q4 Q1 Q2 Q3 Q4 Q1 Q2 Q3 Q4 Q1 Q2 Q3 Q4
                           2020                      2021                      2022                2023

Source: STR; Tourism Economics

* Total room inventory RevPAR is calculated without removing temporarily closed hotels. On a
standard RevPAR basis, growth is forecasted as -47.0% in 2020 and 25.0% in 2021.
Recovery after a pandemic: 14-17 months

2003 SARS outbreak in Hong Kong                                    2003 SARS outbreak in Singapore
International arrivals (thousands)                                International arrivals (thousands)
1,500                                                             800
           14 months from crisis to recovery   12 Month Average              17 months from crisis to recovery   12 Month Average
           1,362,000 lost arrivals             Lost Arrivals                 1,472,000 lost arrivals             Lost Arrivals

                                                                  700
1,000

                                                                  600

 500
                                                                  500

    0                                                              400
    Jan-02 Jul-02 Jan-03 Jul-03 Jan-04 Jul-04 Jan-05 Jul-05 Jan-06   Jan-02 Jul-02 Jan-03 Jul-03 Jan-04 Jul-04 Jan-05 Jul-05 Jan-06
Source: Tourism Economics                                          Source: Tourism Economics
80% of travellers indicate return within six months of virus containment
                                  How long to return to travel 'as usual' after the pandemic has subsided?
50%                                        47%
                                                                   February Survey     April Survey     June survey      September survey
45%

40%
                                                    34%
35%                                                                            32%

30%                                                                  28%

25%

20%
                            15%                                                                            15%
                 14%
15%

10%                                                                                             8%
                                                                                                                                    5%
                                                                                                                          4%
 5%

 0%
               Not wait at all          Wait 1-2mths               Wait ~6mths                 Wait ~1yr          Not travel in foreseeable
Source: IATA                                                                                                               future
How do we advocate for
the industry during this
        crisis?
Reminder: the travel sector was a leader of SD job growth

L&H employment in South Dakota                                               Employment in South Dakota, by major industry
Index (2010=100)
                                                                             Amounts in number of jobs

 112                                                                                Heal th and social assistance                                         72,790
                                                               SD L&H +10%                          Retail t rade                                        67,980
 110                                                                                             Manuf act uring                                47,350
                                                                                   Accommodat ion & food svcs                               46,420
                                                                                         Finance and insurance                          40,060
 108                                                             SD + 9%
                                                                                                   Construct ion                       36,970
                                                                                                        Tourism                    33,210
 106                                                                              Other svcs, exc. public admin.                  33,080
                                                                                               Wholesale trade                25,850
 104                                                                                Real estate & rent al/leasing             25,690
                                                                             Professional and t echnical services             24,540
 102                                                                                 Admin. and waste services           20,530
                                                                                 Transportation & warehousing           18,210
                                                                                            Arts and recreation      12,220
 100
       2010   2011   2012   2013   2014   2015   2016   2017   2018   2019                 Educat ional services    10,420

Source: BLS                                                                  Source: Tourism Economics, BEA
Industry in crisis: no sector has been hit as hard at travel

 South Dakota employment loss by industry
 % of industry lost since February

               Leisure & hospitality                                      16%

                        Information                          7%

                     Other services                     5%

       Education & health services

                     Manufacturing

                       Government

 Trade, transportation, and utilities

  Professional & business services

                 Financial activities

                 Mining & logging

                                        -5%   0%   5%         10%   15%         20%
 Source: BLS
Travel must be our focus for an economic recovery

Share of total SD employment loss by industry
% of all jobs lost since February

              Leisure & hospitality                                         50%
      Education & health services                           20%
                      Government                      13%
Trade, transportation, and utilities

                    Manufacturing

                    Other services

                       Information

 Professional & business services

                Financial activities

                Mining & logging

                                    -10%   0%   10%    20%    30%   40%   50%   60%

Source: BLS
This should not be controversial
Will there be an enduring
 legacy of this crisis?

       Gratitude.
THANK YOU!

Adam Sacks
President
Tourism Economics
adam@tourismeconomics.com

                            January 2021
You can also read