LESSONS LEARNED FROM ROUND 1: IMPROVING WIND RESOURCE ANALYSIS - DAVID PULLINGER WINDAC - NOVEMBER 2018 - WINDAC AFRICA 2021
←
→
Page content transcription
If your browser does not render page correctly, please read the page content below
Lessons learned
from Round 1:
Improving wind
resource analysis
David Pullinger

WindAc - November 2018

Who we are

      Who we are                     Social business         History          What sets us apart
      We are a leading global        Our profits fund the    Founded in       Social business
      provider of engineering        Lloyd’s Register        1760 as a        Technical expertise
      and technology-centric         Foundation, a charity   marine
      professional services that                                              Independence
                                     dedicated to research   classification
      improve the safety and         and education in        society.         Breadth of service
      performance of complex,        science and                              Global reach
      critical infrastructure for    engineering.
      our clients and for society.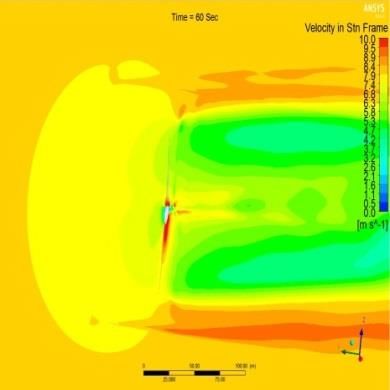
Agenda

-   Background

-   The big question(s)

-   Methodology

-   Results

-   Conclusions
Why do wind resource assessments matter?

             Revenue           Costs
Wind farms in South Africa
Number of Wind farm size
Wind Farm
Turbines (MW)
Cookhouse 66 138.6
Dassiesklip 9 27.0
Dorper 40 100.0
Hopefield 37 66.6
Jeffrey’s Bay 60 150.0
Kouga 32 80.0
Noblesfontein 41 73.8
Van Stadens 9 27.0The big question(s)… 1. Were those (2012) energy yield predictions accurate? 2. Are our new (2018) predictions any better? 3. How are South Africa wind farms performing compared to the rest of the world?
Wind resource vs operational yield assessment
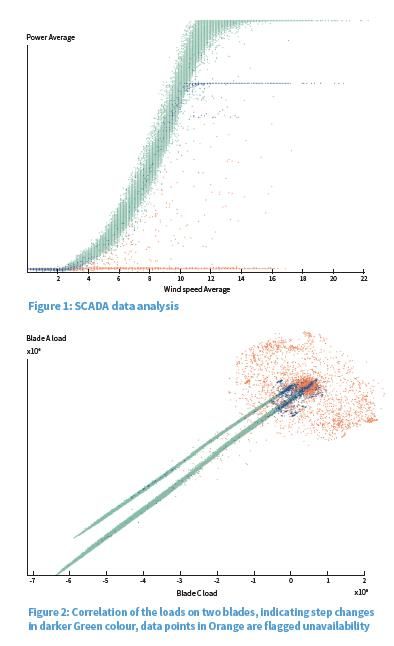
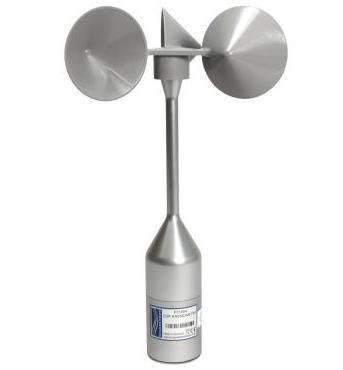
• On-site measurement • SCADA data processing
(short-term)
• Data tagging and cleaning
• Long-term assessment
• Production normalisation
• Wind-flow modelling
• Long-term assessment
• Energy yield + future loss
assumptions
• Future loss assumptions
• Long-term project yield • Long-term project yieldResults – how accurate are the yield predictions?
110%
Production relative to operational performance
1.2% 1.5%
105%
0.2% 0.5%
3.8%
1.2%
100%
104.9%
101.4%
95%
90%
Fall RiseExample – wake model accuracy
110%
Normalised production (%)
105%
100%
95%
90%
85%
80%
75%
70%
1 2 3 4 5 6 7 8
Turbine number
Measured production 2012 Wake Model "2018 Wake Model"Results – international comparison
Wind farm availability
South Africa average Global LT average
97.6 % 96.3 %Conclusions
1. Were those (2012) energy yield predictions accurate?
4.9% over-prediction
2. Are our new (2018) predictions any better?
Yes – mean over-prediction of 1.4% remaining
3. How are South Africa wind farms performing compared to the rest of the
world?
Wind resource assessments just as accurate as the rest of the world
Wind farm availability compares favourably to international
benchmarksAcknowledgements
● The authors would like to thank the wind farm owners who provided their data to the study:
– Kouga Wind Farm;
– Dorper Wind Farm RF (Pty) Ltd;
– Globeleq South Africa Management Services (Pty) Ltd;
– Africoast Energy (Pty) Ltd;
– Umoya Energy (Pty) Ltd;
– Cookhouse Wind (Pty) Ltd.
● Staffan Lindahl founder of Lindahl Ltd and producer of the SIFT operational SCADA analysis
software (https://www.lindahl.ltd/sift), for the invaluable software and also great customer
service.
● All MERRA-2, ERA-Interim and ground station datasets were downloaded using WindPRO
software v3.1.617 developed by EMD International A/S:http://www.emd.dk or
http://www.WindPRO.com.
● The ERA5 data has been Generatedusing Copernicus Climate Change Service Information
2018.
● Lastly, the authors would like to acknowledge the Global Modelling and Assimilation Office
(GMAO) and the GES DISC (Goddard Earth Sciences Data and Information Services Center), as
well as the European Center for Medium-Range Weather Forecasts for the dissemination of
MERRA and ERAInterim.[Your name]
David Pullinger
[Your job title]
Technical Lead – Energy Resource Services
ELloyd’s
[your.email]@lr.org
Register
david.pullinger@lr.org
[Your entity]
[Your business address]
Working together
for a safer world
Lloyd’s Register, LR and any variants are trading names of Lloyd’s Register Group Limited, its subsidiaries and affiliates.
Copyright © Lloyd’s Register Group Services Limited. 2017. A member of the Lloyd’s Register group.Methodology – wind resource assessment
• On-site measurement (short-term)
• Long-term correction
• Horizontal and vertical extrapolation
• Power production & wakes
• System losses
• Uncertainty assessmentMethodology – operational analysis
• Get hold of performance data
• Import and process operational SCADA
data
• Normalise for missing time periods
• Flag data for unavailability/power
performance issues
• Adjust for windiness
• Calculate ideal energy yieldYou can also read