Linkages Between Grade Point Average and Student Ratings
←
→
Page content transcription
If your browser does not render page correctly, please read the page content below
Journal of Educational Research & Practice
                                                                                         2021, Volume 11, Issue 1, Pages 16–33
                                                                                           DOI: 10.5590/JERAP.2020.11.1.02
                                                                                                              © The Author(s)

Original Research

Linkages Between Grade Point Average
and Student Ratings
Robert D. Richardson, PhD
University of Tennessee, Knoxville, Tennessee, United States
   https://orcid.org/0000-0002-1142-1658

Robert L. Williams, PhD
University of Tennessee, Knoxville, Tennessee, United States
   https://orcid.org/0000-0003-1405-9292

Contact: rricha35@utk.edu

Abstract
In order to better understand the potential influence of high school students’ grades on how they rate their
teachers and schools, we explored the relationship between student grade point average and student ratings of
teacher and school effectiveness in 370 classes taught by 230 instructors with over 6,000 students in grades
9–12 in an Intermountain West school district. Teachers were evaluated with an 18-item student survey.
Students also rated their schools with six additional items. The performance measure was the grade point
average (GPA) for the quarter in which students evaluated their teachers and schools. ANOVAs showed that
both year in school and GPA were positively linked with ratings of teacher effectiveness and ratings of school
experiences. Seniors were more positively disposed toward their teachers and school experiences than
students at lower grade levels. Most of the ratings of specific items on the teacher effectiveness and school-
experience scales were significantly, though not strongly, correlated with GPAs. We discuss implications and
suggestions for future research.

Keywords: student ratings, grade point average, GPA, teacher evaluation, teacher coaching
Date Submitted: April 19, 2020 | Date Published: February 23, 2021
Recommended Citation
Richardson, R. D., & Williams, R. L.. (2021). Linkages between grade point average and student ratings. Journal of
        Educational Research and Practice, 11, 16–33. https://doi.org/10.5590/JERAP.2021.11.1.02

Introduction
Formal use of student perception surveys to evaluate instructional effectiveness in elementary and secondary
education is a relatively new phenomenon (LaFee, 2014) that has grown rapidly since the passage of the Every
Student Succeeds Act (2015), which mandated states to implement teacher evaluation systems that detect and
remediate poor instruction. Student perception surveys have been found to both predict student learning
(Raudenbush et al., 2014; Wallace et al., 2016) and possibly improve teaching practices (Elstad et al., 2017;
Measures of Effective Teaching Project [MET], 2012). The MET (2013) found that student ratings of teachers
predict student academic growth in proficiency on state tests for students in elementary and middle school. In
fact, they found that student surveys were a better and more stable predictor of student academic growth than
Richardson & Williams 2021 teacher observation measures. As a result, student perception surveys have become mandated in teacher evaluation systems in many US school districts. While student perception surveys are a relative newcomer in K–12 education, they have been studied in the context of colleges and universities for a much longer time. The relationship between student performance and student surveys of teacher effectiveness is among the most highly targeted research topics in higher education. Surveys taken in the late 20th century revealed that approximately 90% of liberal arts colleges targeted students’ course ratings in administrative evaluation of teaching effectiveness (Seldin, 1999). In fact, Theall and Franklin (1990) claimed that students’ course evaluations represent the most researched topic in higher education. For example, a survey of 40,000 department heads by the US Department of Education revealed that 97% of these heads emphasized student evaluations in their assessment of teaching effectiveness (Berk, 2005). Despite the extensive research on student rating of instructional effectiveness at the college level, minimal research on this topic exists at the high-school level. Admittedly, a number of school systems are introducing course evaluations through workshops and conference presentations; however, professional journals that emphasize research on secondary instruction seldom publish peer-reviewed research on student evaluations of instructor effectiveness. A search of the ERIC and PsychINFO literature revealed not a single study on student evaluations of teacher effectiveness in American Secondary Education, Secondary School Journal, Secondary Education and Teaching, International Journal of Secondary Education, Teaching and Teacher Educator, and The Teacher Educator. Most of the applications of students’ course evaluations at the pre-college level are posted in the popular press, which cites little rigorous research regarding the benefits of students’ course evaluations at the high school or middle school level. One of the few articles published in professional journals on student ratings of teacher effectiveness at the secondary level was conducted in Norway (Elstad et al., 2017). That article concluded that student ratings can be useful to teachers in improving the nature and quality of their instruction; however, these ratings more often appeared to be used for administrative purposes in evaluating teacher instruction instead of by teachers in improving the quality of their instruction. LaFee (2014) has described the role of student evaluations in a variety of large school systems in the United States—Anchorage School District, Boston Public Schools, and Pittsburgh Public Schools. The widespread use of student surveys in evaluating teacher effectiveness appears to have begun in Boston in 2006. Students who took the course evaluation survey did so seriously and cooperatively. LaFee (2014) reported that the survey revealed how students think about engagement in the learning process. In the Anchorage experience with student evaluation of teacher effectiveness, student ratings supported much of what the Anchorage system was already doing to promote student learning. Pittsburgh public schools initially used a student rating system mandated by the Pennsylvania Legislature and subsequently revised that system. Their goal was to develop a rating system that teachers would want to use to improve their teaching rather than a system required by the state or local school administrators. Another extensive research project on effective teaching, the MET, was funded by the Bill and Melinda Gates Foundation in 2009. This research included surveys given to several thousand students who were asked to characterize their educational experiences, with their answers compared to their scores on conventional examinations such as state-mandated, value-added tests. The MET researchers found that elementary and middle school students were better able to judge teacher effectiveness than trained adult observers. The findings of these surveys identified teacher strengths and teacher practices needing improvement. The primary student survey used for this project (Tripod) explained 7.8% of the variation in learning gains on value-added measures, which was equivalent to a correlation between predicted and observed value-added scores of r = .29 (Raudenbush & Jean, 2014). Journal of Educational Research and Practice 17
Richardson & Williams 2021

Perhaps the most notable contributor to the literature on high school students’ evaluations of their teachers is
Ronald F. Ferguson, a professor in the Harvard Graduate School of Education (LaFee, 2014). He was the
major architect of the Tripod Project, which involved development of surveys high school students could use
to rate the instructional effectiveness of their teachers. Ferguson began his research on the assessment of
teaching ineffectiveness in a small school district characterized by inconsistent student achievement.
Conventional assessment tools had not explained the range of student achievement in different classrooms in
the school district. Consequently, Ferguson asked students through anonymous surveys what they perceived
as occurring in their classrooms.

The emphasis on student evaluation of teaching effectiveness at the high-school level is generally anchored in
the framework of value-added assessment of student performance. Typically, this notion relates to whether
students are progressing as well or better than expected academically from one year to the next. Changes in
students’ achievement test scores are used to determine whether academic progress has been acceptable or
superior from one year to the next. This aspect of value-added assessment is primarily longitudinal, with the
progress of the same students assessed across years; however, the progress of one group of students is
sometimes compared with that of a similar group of students taught by different teachers in a cross-sectional
fashion (Doran, 2005).

If students make substantial improvement from one year to the next or one group does considerably better
than another group, we can assume that teaching played a role in the value-added assessment process. To
assume that students should progress academically without effective teaching would put the total
responsibility for student learning on the students and/or their parents. Thus, in the complete equation for
value-added assessment, the sequence should be pre-test, teacher instruction, and post-test. Evaluating the
dimensions of teaching has become a major task in improving the outcome of value-added assessment. In
some cases, teachers are observed by other teachers or supervisors to determine what teaching skills need to
be strengthened. However, from a practical perspective, observation by other professionals can only span a
limited time frame (e.g., one or two diagnostic observations) to identify the teaching skills needing to be
upgraded, with one or two follow-up observations to see what improvement has been made in those skills.

Since students spend the most time observing teachers and being affected by teachers, perhaps they can best
answer the questions of what a teacher is doing to promote or impede student learning. In examining the role
of student responses to teaching-effectiveness surveys, Ferguson (2012) constructed a Tripod with 7-Cs that
could be used as a prognostic tool in evaluating and promoting teaching effectiveness. Thus, the 7-Cs in
Ferguson’s Tripod represented teachers Caring for students, Controlling student behavior in the classroom,
Clarifying information presented in class, Challenging student effort, Captivating students interest, Conferring
with students regarding their understanding of course content, and Consolidating student learning of
academic notions by reviewing and summarizing content previously taught (Ferguson, 2012).

Ferguson contended that his Tripod surveys were considerably more effective than classroom observations in
accounting for students’ academic improvement. Although all of Ferguson’s 7-Cs predict value-added
academic gains, Control and Challenge were the best predictors (Raudenbush & Jean, 2014). Students’ being
on-task and non-disruptive is foundational for their meeting academic challenges and flourishing
intellectually, and having high expectations of students has been consistently associated with better academic
outcomes (Hattie, 2009).

Purpose

There is good reason to believe that student evaluations of teachers can provide actionable information, which
can inform professional growth; however, when these student ratings are used for evaluation purposes to
compare and rank teacher effectiveness, it is important that the potential for construct irrelevant bias be well
understood. For student perception surveys, construct-irrelevant bias has not yet been studied. One potential

Journal of Educational Research and Practice                                                              18
Richardson & Williams 2021

confound to accurate comparison across teachers is the influence of the grades that students receive from
their teachers on the ratings they give to their teachers. Another potential confound is the maturational level
of the students doing the rating. Do students rate teachers differently across the developmental stages?

Because grade point average (GPA) is an aspect of school that may color student perceptions of teachers and
schools, we decided to quantify the relationship between student GPA and student evaluation of their teachers
and of their overall school experiences across years in high school. Understanding the relationships between
students’ rating of their teachers (and schools), their developmental level, and the grades they receive has
important implications as to how educators should interpret student ratings, particularly when comparisons
are being made between teachers. For example, if correlations between student grades and student ratings are
high, this might indicate that teachers receive inflated ratings from students by giving high marks and
deflated ratings from students by giving low marks. In such situations, teachers would not be rated purely on
quality of teaching but rather on grades given, thus confounding this approach to measuring teacher
excellence and, potentially, promoting an unintended consequence of grade inflation, or worse, low
expectations.

While the relationship between grades and ratings of teacher effectiveness has been extensively studied at the
college level, they have been minimally researched in elementary, middle, or high-school populations.
Nonetheless, most collegiate studies of this relationship have been done only on a group basis, without the
potential for tracking individual students’ teacher evaluation scores. However, the data-collection system used
in the current study paired individual students’ scores across independent (e.g., student grades) and
dependent variables (how they evaluate their teacher). In the current study, students were assured that their
teachers would not see individual student ratings of teachers, hence reducing fear of teacher reprisal for
submitting poor teacher ratings.

Thus, the primary question of this study involves exploring the extent to which student grades predict how
they rate their teachers and their schools. A secondary question is whether these relationships hold across
years in school. Consistent replication of the answer to the primary question across years in high school would
suggest a replicable relationship between GPA and teacher ratings among high school students in which the
developmental level of students plays little role in judgment. Understanding the connections between student
ratings of teachers and GPA will help inform how teachers and administrators interpret the data they receive
from student ratings of teacher effectiveness.

Materials and Methods
Participants

Data were collected through a school district’s data dashboard for students in grades 9–12, with 6,134
students across high-school grade levels. We drew student data from five high schools. These students from
371 different classes were surveyed as to their perspective of teacher effectiveness, with one to 71 students
responding per class. Surveys were administered in a single period of the day to avoid survey fatigue of
students. The period of the day in which surveys were administered was determined by the building
administration. Only teachers who were being evaluated in their first three years of employment or who were
on the 3rd year of their review cycle were required to survey their class. The number of students who
completed the survey was 1,872 Freshmen, 1,559 Sophomores, 1,586 Juniors, and 1,115 Seniors. Gender
classification revealed that 3,054 of the sample were females and 3,078 were males; 451 of the students were
receiving special education services, and 5,683 were not. The senior class had a lower proportion of students
receiving Fs as well as a lower proportion of English learners (see Table 1).

Journal of Educational Research and Practice                                                              19
Richardson & Williams 2021

Table 1: Sample Percentages of Column Totals

 Category            All Grades        Freshman            Sophomore             Junior            Senior
                    (N = 6,134)        (n = 1,872)         (n = 1,559)         (n = 1,586)       (n = 1,115)
 Female                49.8                48.4                51.8               48.7              50.9
 White                  74.2               73.0                74.1               74.1              75.7
 Hispanic               15.2               16.2                15.4               15.3              13.7
 FRL                    18.4               20.1                18.9               15.8              18.5
 EL                     4.3                4.3                 4.6                 4.3               3.8
 IEP                    7.3                 7.4                6.5                 7.9               7.5
 F=0                   86.9                85.3                85.7               86.6              91.7

Note. FRL = Free and Reduced Lunch. EL = English Learner. IEP = student with an Individualized Education Program
through Special Education. F = 0 = students with no Fs in first term of school.

GPAs for individual students were generally submitted on a quarterly basis for the high school students.
Grades were downloaded nightly into the school’s data-management system. Grading was based on the
standard A–F scale, with A being exemplary work, B meeting standards, C approaching standards, D falling
below standards, and F being significantly below standards. Teachers throughout the district were encouraged
to base grades on the extent to which students met course standards, rather than basing grades on classroom
behavior or extra-credit projects unrelated to meeting course standards.

Grading methods varied across levels and subject areas. Grades in physical education courses tended to be
more about participation than skill levels, whereas math grades tended to be more about proficiency than
participation. Tests, essays, projects, and class participation were standard contributors to grades. GPA was
for the term in which students rated their teachers, rather than a cumulative GPA.

Measures

Teacher evaluation measures
Students took a 24-item Secondary Student Survey (18 teacher-related and six school-related items) by
logging into their district accounts and then indicating their perception of teacher practice. Each rating item
had four response options ranging from strongly agree to strongly disagree. All items included specific
features of the teacher’s instructional actions; for example, students were asked to rate such claims as “My
teacher asks me to explain how I come up with my answers,” and “If someone does not understand something,
my teacher explains it in another way.” Students took the survey online for one of their teachers (in most cases
during the first period of the day) on the date specified for the survey.

The original instructional team developed its own student evaluation of instructor effectiveness measure by
first reviewing research on student evaluation of teachers. However, most of the survey items pertained to the
Tripod 7-Cs Survey developed at Harvard under the direction of Ronald Ferguson in 2001. The items selected
were based on the following 7-Cs, with phrasing of typical items in parentheses:

    •    Challenge: Teacher presses for rigor and persistence in student work (e.g., “My teacher asks me to
         explain my answers”).

    •    Control: Teacher minimizes misbehavior, promotes good behavior, and insists that students stay on-
         task (e.g., “My teacher knows how to get students to behave properly”).

Journal of Educational Research and Practice                                                                   20
Richardson & Williams 2021
• Confer: Teacher elicits ideas from students and welcomes their feedback (e.g., “My teacher helps us
learn from our mistakes”).
• Captivate: Teacher stimulates student interest in lessons (e.g., “My teacher makes learning
interesting”).
• Clarify: Teacher makes difficult concepts well understood (e.g., “My teacher is good at explaining
things”).
• Consolidate: Teacher makes learning coherent and relates new learning to old (e.g., My teacher ties
new lesson to things we have already learned”).
• Care: Teacher promotes supportive relationships with students (e.g., “My teacher treats all students
in this class with respect”).
In addition, there is one general summary item: “I would recommend this teacher to other students.”
In developing a framework for evaluating teacher effectiveness, the original team of specialists first obtained
feedback from teachers and administrators as to what they thought should be measured in an evaluation of
teaching effectiveness. This team subsequently took the following actions:
• Reviewed items from Tripod and other state surveys developed for the purpose of teacher evaluation.
Examined teacher evaluation surveys from Boston, Kentucky, Pennsylvania, and Utah, as well as
several surveys that teachers had already used to get instructional feedback from their classrooms.
• Created an item bank and simplified language based on readability formulae and comments from
teacher reviews.
• Piloted survey items in classrooms, collecting reliability and validity data, and getting input from
teachers regarding survey items.
• Removed items that had poor discrimination or did not add to internal consistency of the measure.
• Initially implemented items for a year.
• Revised items based on item analysis and item discrimination.
A principal component analysis was conducted on the 18 teacher-related items, using orthogonal rotation
(Varimax). An initial analysis was run to obtain eigenvalues for each component in the data. One component
(overall student satisfaction) had eigenvalues over Kaiser’s criterion of 1 and explained 64% of the variance in
item scores.
Internal consistency (reliability) of the student survey was measured with coefficient alpha. Coefficient alpha
for the 18 items in which students rated their teachers was .96, indicating excellent internal consistency of the
teacher-linked items.
School evaluation ratings
The original research team added six additional items to better understand student perceptions of their
school. These items were suggested by principals, district behavior specialists, and district academic
specialists. A district team of four individuals formulated and revised the school-directed items. Internal
consistency of the school survey was measured with coefficient alpha. Coefficient alpha for the six items in
which students rated their school was .85. Separating the teacher and school items permitted a determination
of the relationship between the two domains.
Journal of Educational Research and Practice 21Richardson & Williams 2021 Results Initial analysis indicated significant differences between average GPA and rating of teacher effectiveness by year in high school. Therefore, we used a two-way, 4 (year in school) x 5 (GPA) ANOVA, to evaluate differences in the relationship between student GPAs and their ratings of teacher effectiveness. Student GPAs were binned into 5 categories: 0.0 to 0.999 = F; 1.0 to 1.999 = D; 2.0 to 2.999 = C; 3.0 to 3.499 = B; and 3.5 to 4.0 = A. We failed to obtain any significant interaction effects between year-in-school and term-GPA, F(12, 6070) = 1.086, p = .367. We obtained a significant main effect for GPA on student ratings of their teachers, F(4, 6070) = 10.71, p < .001, Partial Eta squared = .007. Post hoc analysis, using Tukey’s HSD, indicated that students who obtained an A GPA for the term rated their teachers significantly higher (p < .001) than students who had B, C, D, or F GPAs; students who obtained B GPAs had significantly higher teacher ratings than students who had D or F GPAs (p < .001), but not higher than students with C-level GPAs; students who obtained C GPAs had significantly higher ratings than D or F GPAs (p < .01 & p
Richardson & Williams 2021
There was also a significant main effect for year-in-school on how students rated their teachers, F(3, 6070) =
14.11, p < .001, Partial Eta squared = .007. Pairwise post hoc analysis using Tukey’s HSD indicated that with
the exception of the freshman and sophomore years, which were not significantly different, each successive
year in school produced significantly higher ratings of teachers than the previous years. More advanced
students rated their teachers more favorably than students in the first 2 years of high school.
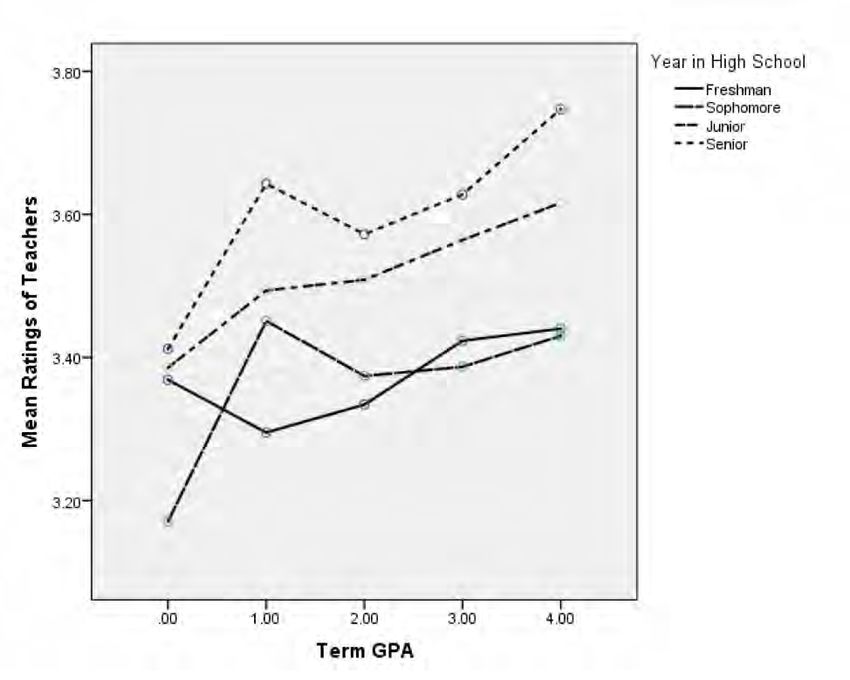
Figure 1 plots mean student ratings of their teachers across binned GPAs for the targeted term. Higher GPAs
corresponded to higher ratings of teachers and lower GPAs corresponded with lower ratings of teachers.
Upper-grade students generally rated the teachers higher irrespective of the students’ GPA. The two
exceptions to this pattern were that (a) freshmen with an F GPA rated teachers higher than sophomores with
an F GPA; whereas (b) sophomores with a D GPA rated teachers higher than freshmen with a D GPA.
Some items on the teacher-rating scale generated more robust relationships with student GPAs than did other
items (see Table 2). For example, the following teacher-rating items had the strongest correlations with term
GPA:
• My teacher ties new lessons to things we have already learned. (rxy = .12, p < .001, two tailed)
• My teacher knows when I do not understand. (rxy = .10 , p < .001, two tailed)
• My teacher gives me helpful comments on my work. (rxy = .09 , p < .001, two tailed)
• My teacher helps us learn from our mistakes. (rxy = .09, p < .001, two tailed)
• My teacher asks me to explain how I come up with my answers. (rxy = .09, p < .001, two tailed)
These items appear to be linked primarily to Ferguson’s “Conferring” notion (LaFee, 2014) involving teacher
feedback and targeted/personalized learning. Conferring refers to the dialogue between teacher and student
in which the teacher understands and responds directly to the nature and pace of student learning (identifying
and correcting errors and building on understanding). Students who rated their teachers high on Conferring
items had higher grades than those who rated their teachers lower on measures of Conferring.
Other teacher-rating items had weaker and/or statistically non-significant relationships with student GPA.
These items tended to be more behaviorally anchored, asking about very specific behaviors of the teacher
rather than targeting teacher “promotion of learning.” Examples of this category include the following items:
• My teacher walks around the room to check on students when we are doing work in class.
• My teacher tells us about the learning goals/objectives for the day.
This first item in this table was intended to measure Control (keeping students on-task and minimizing
misbehavior) and the second to Consolidate (making learning coherent and relating new learning to old).
These items require less judgment and inference by directly targeting observable behavior, but are also quite
narrow in scope.
Journal of Educational Research and Practice 23Richardson & Williams 2021
Table 2: Correlations of Term-GPAs With Student Item Ratings-of-Teachers
Item M SD rxy
Combined Teacher Ratings 3.50 (0.60) .097**
1. My teacher treats all students in this class with respect. 3.73 (0.60) .079**
2. My teacher walks around the room to check on students when we are
3.61 (0.60) .027*
doing work in class.
3. My teacher knows how to get students to behave appropriately. 3.54 (0.73) .070**
4. The teacher provides students with meaningful activities throughout the
3.57 (0.76) .052**
class period, so that no time is wasted.
5. My teacher tells us about the learning goals/objectives of the day. 3.58 (0.74) .022
6. My teacher ties new lessons to things we have already learned. 3.60 (0.68) .118**
7. My teacher is good at explaining things. 3.48 (0.82) .067**
8. My teacher knows when I do not understand. 3.20 (0.90) .102**
9. My teacher encourages all students to participate, not just those who
3.58 (0.73) .055**
raise their hand.
10. My teacher makes learning interesting. 3.38 (0.92) .092**
11. My teacher helps us learn from our mistakes. 3.48 (0.77) .088**
12. My teacher gives me helpful comments (or feedback) on my work. 3.46 (0.83) .087**
13. In this class, my teacher connects what we are learning to the real world. 3.49 (0.82) .077**
14. My teacher helps me understand why the things we’re learning in class
3.45 (0.85) .078**
are important.
15. My teacher asks me to explain how I come up with my answers. 3.40 (0.82) .093**
16. If someone does not understand something, my teacher explains it in
3.48 (0.79) .069**
another way.
17. My teacher provides helpful strategies for learning when students don’t
3.46 (0.83) .076**
understand.
18. I would recommend this teacher to other students. 3.53 (0.86) .079**
Note. Mean = average student rating of their teachers, where 4 = strongly agree, 3 = agree, 2 = disagree, and 1 = strongly
disagree. SD = Standard Deviation. rxy = correlation between student ratings of teacher and GPA.
* p < .05. ** p < .001.
Relationship Between Student GPA and Student Ratings of Their Schools
As in the previously described analysis, a two-way, 4 (year in school) x 5 (GPA) ANOVA was used to evaluate
differences in the relationship between these variables and bonding with their schools. Student GPAs were
binned into 5 categories: 0.0 to 0.999 = F; 1.0 to 1.999 = D; 2.0 to 2.999 = C; 3.0 to 3.499 = B; and 3.5 to 4.0
= A. Year in school was classified from the freshmen to the senior level. No significant interaction effects were
Journal of Educational Research and Practice 24Richardson & Williams 2021 obtained between these variables, but significant main effects were obtained for both GPA and year in school (see Table 3). Table 3: Year in School Averages Across GPA, Teacher Rating, and School Rating Year in School GPA (SD) Teacher (SD) School (SD) Freshman 3.20 (.82) 3.40 (.60) 3.33 (.64) Sophomore 3.25 (.83) 3.41 (.67) 3.30 (.67) Junior 3.23 (.83) 3.57 (.58) 3.35 (.65) Senior 3.43 (.72) 3.69 (.48) 3.50 (.62) Note. GPA = average GPA for the first term. Teacher = average overall teacher rating. School = overall average school rating. SD = Standard Deviation. The analysis of GPAs and student ratings of their schools yielded the following main effect: F(4, 6056) = 10.87, p < .001, Partial Eta squared = .017. Post hoc analysis using Tukey’s HSD indicated that students who obtained an A GPA for the term rated their schools significantly higher than students who had a B, C, D, or F GPA. Those who obtained an F GPA for the term had significantly lower ratings of their schools than students who had a D, C, B, or A GPA. The only non-significant GPA comparison was between those with B and C GPAs. A significant main effect was obtained for year-in-school and student rating of their schools, F(3, 6056) = 6.12, p < .001, Partial Eta squared = .003. Pairwise post hoc analysis using Tukey’s HSD indicated that seniors rated their schools more favorably than other grade levels, which did not differ significantly in their ratings of schools. Figure 2 plots mean student ratings of their schools binned for the term GPAs. Higher GPAs corresponded to higher ratings of schools and lower GPAs corresponded with lower ratings of schools. Across GPAs, seniors rated their school experience higher than students in other years. Also, the range of seniors’ school ratings was much less than for other grades, which minimally differed across years in school. Freshmen through juniors with lower GPAs rated their school experience quite low. Some descriptors of school experiences generated stronger relationships between GPA and ratings of school than did other descriptors (see Table 4). The item with the highest correlation with GPAs was the global item, “I like my school.” (rxy = .21, p < .001, two tailed). Perhaps it is not surprising that those with lower grade point averages were also less likely to enjoy school. GPAs were also significantly (p < .001) and positively correlated with student rating of other aspects of school experiences including perceptions of safety and feelings of being respected by adults. Journal of Educational Research and Practice 25
Richardson & Williams 2021

Figure 2: Mean School Ratings Across Term GPA

Note: As GPAs for the term increase, so do the mean ratings of schools. Older students rate their schools more favorably
than younger ones; however, the pattern of rating schools more favorably the better the GPA of students remains across
grades.

Table 4: Means and Correlations of Student Ratings of Schools Based on Term-GPA

 Item                                                                                        M        (SD)       rxy

 Combined School Ratings                                                                    3.35     (0.65)     .162**

     1.   I like my school.                                                                 3.35     (0.91)     .212**

     2. My school sets clear rules for behavior.                                            3.49     (0.77)     .098**

     3. Adults at my school treat me with respect.                                          3.46     (0.77)     .122**

     4. I know an adult at my school that I can talk with if I need help.                   3.44     (0.88)     .092**

     5.   At my school, students are recognized for following the school rules.             3.08     (0.96)     .064**

     6. My school is a place where I feel safe.                                             3.31     (0.87)     .146**

Note. Mean = average student rating of their teachers, where 4 = strongly agree, 3 = agree, 2 = disagree, and 1 =
strongly disagree. SD = Standard Deviation. rxy = correlation between student ratings of teacher and GPA.
* p < .05. ** p < .001.

Journal of Educational Research and Practice                                                                        26
Richardson & Williams 2021 Discussion Many high schools across the United States and Europe have used student surveys in evaluating teacher effectiveness. Some research has correlated student ratings of their teachers with student performance via value-added assessment (Wallace et al., 2015); however, little if any research has explored the connections between students’ GPAs and their ratings of teacher effectiveness at the high-school level. Most of what is known about the relationship between grades and ratings of teachers has come from research with college students. In this collegiate research, grades have been among the strongest predictors of student ratings of teacher effectiveness. (Author et al., 2016; Nilson, 2012). However, as noted in the introduction to this article, minimal research on this relationship has occurred at the high-school level. The current study appears to be the first to address the relationship between high school students’ grades and their ratings of teacher effectiveness. Other distinguishing features of the current study include the following characteristics: (a) sample size (more than 6,000 high school students), (b) use of GPA across teachers and courses as opposed to specific course grades only, (c) determination of the relationship between GPA and ratings of teacher effectiveness from freshman through senior levels, (d) correlations between GPA and ratings of specific aspects of teacher effectiveness, and (e) analysis of the relationship between GPA and ratings of the school experience as a whole. Overall, students rated their teachers and school experiences positively. Although students with low GPAs rated their teachers lower than those with high GPAs, the ratings at the lowest GPA levels were not abysmally low. Plus, the more students had advanced in their high-school experience, the higher they rated their teachers and the school as a whole. Ratings of Teachers The question raised in this study regarding grades and student ratings of teacher effectiveness at the high- school level suffers from the same limitation of similar research at the college level. Student ratings of teachers at the college level are most directly related to student grades rather than to an objective determination of teachers’ instructional skills. Thus, student satisfaction with their grades often functions as a surrogate for the quality of teacher instruction. However, in a wealth of studies on teacher evaluations at the college level, teacher effectiveness is practically never independently operationalized and assessed apart from student grades in courses. It is student grades rather than student learning that is strongly related to ratings of teacher instruction. Teachers who give high grades are likely to be rated high in teaching effectiveness irrespective of how much students learn (Nilson, 2012). This pattern may also be true at the high school level. The Paget et al. (2017) exploration of the relationships of college students’ assessment reports and ratings of their instructors found a significant satisfaction bias related to students’ receiving low assessments. Student ratings of their instructors were dramatically lower after just receiving low assessment results than prior to receiving those results. Paget et al. concluded that this pattern represented a strong grade bias. Likewise, Felton et al. (2004), also studying college students, found a .61 correlation between the easiness of a course and positive ratings of the course. This pattern is concerning because of the downward pressure it places on course rigor and student growth in an environment in which teachers depend on favorable reviews for job evaluations. Mental exertion in many cases is not enjoyable, but it is necessary for high-level academic achievement; schools should take care not to inadvertently incentivize classrooms with low levels of student effort. To the extent that grades drive how students rate their teachers, which appears to be the case at the college level, some amount of caution should be exhibited with respect to student ratings for teacher evaluation in high schools. No one wants the unintended consequence of creating an incentive for teachers to reduce course rigor and student performance expectations. While connections between student grades and student rating of teachers have been much less researched at the high school than the college level, our data suggest that there Journal of Educational Research and Practice 27
Richardson & Williams 2021

is a consistently significant relationship between these variables: students who have higher GPAs give
teachers and schools higher ratings. This pattern is perhaps intuitively plausible since “the system” is working
for students who are obtaining good marks, and not working for those who obtain poor marks; furthermore,
the students for whom their environment is not working are likely to perceive that environment more
negatively, be it classroom or school at large.

Indeed, there are a number of hypothetical models for grades and student ratings to be related:

    1.   Transactional Hypothesis: Higher grades bring goodwill and higher teacher ratings from
         students. Grades are viewed as tokens of appreciation from the teacher and are reciprocated in kind
         by students. The degree to which this hypothesis is true is the degree to which student ratings are
         subject to content-irrelevant bias and hence the degree to which they are inappropriate for comparing
         teachers in the context of teacher evaluation.

    2. Instructional Common-Cause Hypothesis: Better teaching produces higher levels of student
       learning, which in turn results in both better grades and better student evaluations of teachers. This
       hypothesis manifests a legitimate goal of student input.

    3. Climate Common-Cause Hypothesis: In this hypothesis, the classroom climate simultaneously
       affects both student ratings of teachers as well as student grades. Positive classroom climate, a safe
       and positively reinforcing environment, produces goodwill and subsequent improved student ratings
       and student GPAs; conversely, poor classroom climate results in lowered student ratings of teachers
       and GPAs. It stands to reason that when students interpret their classrooms positively, they will work
       harder, which results in getting better grades, and they will simultaneously be predisposed to rate
       their teachers more favorably.

The current study does not have data with which to definitively parse which of these interpretations are most
correct or the degree to which they might all be correct; however, our data may offer some clues as to the
differential supportability of these interpretations.

If the Climate Common-Cause interpretation were a particularly large contributor to the connection between
GPA and student ratings, one might expect items having to do more directly with classroom environment to
have higher correlations with GPA. However, this linkage is not the case (see items 1, 3, and 18 in Table 2). To
test this hypothesis more directly would require assessments of classroom climate and perhaps student
interviews for each of these classes, which we do not currently have. Nevertheless, the consistent statistically
significant connections between classroom-environment-related survey items and GPA suggest that this
hypothesis may have some credence.

If the Instructional Common-Cause hypothesis were the biggest contributor to the connection between GPA
and student ratings, one would expect items having to do with instruction to have the highest correlations
with grades. This possibility is clearly not the case either; for example see items 2, 4, 5, 7, 16, and 17, which all
have more modest connections with GPA (Table 2). However, certain other instructional items have higher
connections with GPA, particularly those having to do with the notion of conferring (i.e., feedback interactions
between student and teacher); for example see items 6, 8, and 15 in Table 2. In so far as grades measure
achievement, perhaps these correlations may in part be picking up on the connection between teacher
behaviors and student learning. If true, this would be a formative relationship.

The Transactional Hypothesis is the most concerning of explanations. It suggests a kind of content-irrelevant
bias, about which teacher evaluation systems should be wary. It is this explanation that could potentially lead
to a downward spiraling of expectations. If the Transactional Hypothesis explained the connection between
GPA and student ratings, one might expect robust correlations between ratings and GPA irrespective of item

Journal of Educational Research and Practice                                                                  28
Richardson & Williams 2021 content. Our data do not provide compelling evidence that the Transactional Hypothesis is the main driver of how students rate their teachers; however, this hypothesis has potential merit given the consistent statistically significant correlations between survey items and student GPA, irrespective of item content. In order to more fully understand the degree to which the Transactional Hypothesis is valid, we would need to be able to objectively measure how much students actually learn in their classrooms and perhaps also how easy or difficult each classroom proves to be. Alas, no such measure of within-year learning was available in the high schools sampled in the current study. To have even more confidence in the veracity of our findings, we would need to randomly assign students to low-expectation and high-expectation conditions, an approach that would raise ethical concerns. As things stand, we have reason to believe that each of the three listed hypotheses may play some role in the connection between student ratings and grades. Ratings of Schools In the current study, the relationship between student GPA and school ratings was similar to the relationship between student GPA and teacher ratings. However, in the ratings of schools, the relationship between GPA and student ratings was stronger than the relationship between GPA and teacher ratings, with overall correlations almost twice as large for GPA and student ratings (.162 as opposed to .097). Moreover, trends were even more consistent across grade levels for school perception ratings. This finding stands to reason since both the quarterly student GPA and the student school rating are global, cross-classroom measures. Furthermore, students who are more successful will be more positively disposed toward their schools. Clearly the causal arrow is likely to run the other direction as well: When students are more positively disposed toward their schools, they will be more likely to work hard to obtain good grades. Ratings Across Student Year in School Significant differences were also noted in student ratings across year in school in the current study. Older students rated both teachers and schools more favorably than younger students. Seniors had significantly higher ratings than any other grade level. Why is it that seniors would have more favorable ratings of teachers than freshman? There are several possibilities for this. One possibility is that teachers who instruct older students are better than teachers who instruct younger ones. This possibility seems unlikely since in many cases the same teachers teach both introductory and advanced classes, and a majority teaches classes with a mix of multiple-aged students. A second reason for variation in ratings across grade levels might be that upperclassmen are more likely to be enrolled in classes that they picked and, therefore, are more inherently interested in, whereas freshman and sophomores may be more likely to be taking required courses in which they have limited interest. Prima facie, the latter explanation seems more likely to be supportable than the first. To determine the veracity of this claim, we compared ratings of electives with ratings of required classes. Within our data set, teachers of elective classes do not systematically receive higher ratings than those teaching required courses; for example American Sign Language, drawing, culinary arts, photography, drivers education, computer programing, web development, biology, chemistry, geography for life, foreign language classes, and calligraphy have among the lowest average student ratings despite being elective classes. A third reason might be that as students become more advanced in their coursework, they tend to rate teachers more favorably. However, this pattern does not appear to be the case. For example, average teacher ratings for the 9th, 10th, 11th, and 12th grade language arts sequence were 3.51, 3.37, 3.66, and 3.17, respectively, in our research. For the standard math sequence of required courses, average teacher ratings were 3.06, 3.25, and 3.01. Consequently, more advanced courses do not seem to elicit higher teacher ratings. Journal of Educational Research and Practice 29
Richardson & Williams 2021

Perhaps the most likely explanation for the finding that older students rate their schools more highly is
attrition. The students with the poorest perceptions of their schools and teachers drop out of school over time,
with the fewest remaining students in the senior year having a positive perception of school. The school
district in this study had an 89% graduation rate for the senior class in this study, indicating that 11% of
students who started high school as freshmen did not graduate from high school. This 11% may be the group
who would have rated their schools less favorably than the 89% who continued through their senior year.
After all, seniors had the lowest percentage of failing grades (Table 1). Perhaps regardless of school success as
measured in grades, students who persevere through their senior year are more positively disposed toward
their schools and teachers than are the students who end up dropping out of high school.

Future Research

Future studies exploring the influence of student grades on teacher ratings should seek to measure and
control for course difficulty, classroom climate, and within-year student achievement growth, as well as
student grades. Until we have a better understanding of those variables, it will be difficult to make compelling
claims about causal influences of student grades on student ratings of teachers. To the extent that student
surveys are used for evaluation of teacher skills, these surveys need to be relatively free from the bias of soft
expectations. Otherwise, there are likely to be unintended consequences of lowered expectations for student
performance and subsequent lower levels of performance. Consequently, outstanding teachers skilled in
getting students to stretch toward high levels of accomplishment may be unfairly devalued on student
evaluations.

Limitations

While the large sample in the current study likely increased reliability and validity of the relationship between
GPAs and ratings of teacher effectiveness, the study is not without limitations. All the students came from a
single school district, whereas other districts may have had somewhat different grading and instructional
practices that could indirectly limit the external validity of the current study. Furthermore, using GPA as the
measure of student performance, rather than grades in a particular class, made the isolation of specific
teacher and course effects less definable. Nonetheless, because of the sizable sample and the numerous
academic dimensions tracked in the study, the results can make a sizable impact in the limited research
available on variables that affect GPAs and ratings of teacher effectiveness at the high-school level, as well as
the linkage between GPAs and evaluation of teacher effectiveness.

Recommendations for Practice

In light of our findings and review of the research, we recommend the following for using student ratings as
an indicator of teacher effectiveness. First, use student ratings of teachers for professional learning purposes.
The literature provides significant evidence that well-designed student ratings can inform teaching practices
in ways that improve instruction and may result in improved student outcomes (LaFee, 2014). Despite being
untrained observers, with various biases for or against a given teacher, students have a unique perspective
given the amount of time spent in the classroom observing and experiencing instruction. Their perceptions,
even if flawed, can be a valuable source of feedback to be considered by teachers, especially concerning areas
that are not directly observable by teachers, such as classroom climate, the degree to which students feel
supported, and the degree to which students feel challenged.

Second, be wary of using student ratings of teachers for evaluative purposes, especially when it involves
comparing one teacher with another. In the studies conducted on college campuses, evidence suggests that
student ratings of teachers have systematic bias favoring easier course content and inflated grades.
Furthermore, there is little empirical reason to suggest that ratings of high school students should be
significantly different from that of college students in this regard. In the current study, there is a robust

Journal of Educational Research and Practice                                                               30
Richardson & Williams 2021

relationship between student grades and student ratings of teachers. The current study does not indicate the
direction of causation between lower grades and lower student ratings of teachers or that poor teaching may
cause lower academic growth resulting in both lower ratings and lower grades. In fact, both of these causal
nexuses are likely operative. Moreover, older high school students rate their teachers more favorably than
younger ones. These phenomena are not well understood and may also suggest systematic bias. Consequently,
evaluators of teachers should be aware of the likelihood that student ratings are influenced by the grades
students receive, as well as other construct-irrelevant factors such as age of the respondent, irrespective of the
quality of instruction in the classroom. And this last possibility should raise concerns that when we evaluate
teachers using student ratings, we may bring about unintended consequences of easy grading policies and
lowered expectations.

Journal of Educational Research and Practice                                                               31
Richardson & Williams 2021

References
Berk, R. A. (2005). Survey of 12 strategies to measure teaching effectiveness. International Journal of
        Teaching and Learning in Higher Education, 17(1), 48–62.
Doran, H. C. (2005). Research matters/Challenges of value-added assessment. Educational Leadership,63(3),
       1–4.
Elstad, E., Lejoinbert, E., & Christophersen, K-A. (2017). Student evaluation of high-school teaching: Which
        factors are associated with teachers’ perception of the usefulness of being evaluated? Journal of
        Educational Research Online. 9(1), 99–117.
Every Student Succeeds Act, 20 USC § 6301 (2015). https://www.congress.gov/bill/114th-
        congress.gov/senate-bill/1177.
Felton, J., Mitchell, J., & Stinson, M. (2004). Web-based student evaluations of professors: The relations.
        Analysis and Evaluation in Higher Education, 29, 91–108.
Ferguson, R. F. (2012). Can student surveys measure teacher quality? Kappan, 94(3), 24–28.
Gates Foundation (2012). Measures of effective teaching. Retrieved from
        http://k12education.gatesfoundation.org/
Hattie, J. (2009). Visible Learning: A synthesis of over 800 meta-analyses relating to achievement.
         Routledge.
LaFee, S. (2014). Student evaluating teachers. School Administrator, 7(3), 2–7.
Measures of Effective Teaching (2012). Asking students about teaching. Bill and Melinda Gates Foundation.
       http://k12education.gatesfoundation.org/resource/asking-students-about-teaching-student-
       perception-surveys-and-their-implementation/
Measures of Effective Teaching (2013). Ensuring fair and reliable measures of effective teaching:
       Culminating findings from the MET project’s three-year study. Bill and Melinda Gates Foundation.
       https://www.metproject.org/downloads/MET_Ensuring_Fair_and_Reliable_Measures_Practitioner
       _Brief.pdf
Nilson, L. B. (2012). Time to raise questions about student ratings. In J. E. Groccia & L. Cruz (Eds.) To
        improve the academia (pp. 213–217). Jossey-Bass. https://doi.org/10.1002/j.2334-
        4822.2012.tb00683.x
Paget, M., Brar, G., Veale, P., Busche, K., Coderre, S., Woloschuk, W., & McLaughlin, K. (2017). The grades
        that clinical teachers give students modifies the grades they receive. Advances in Health Science
        Education. 23, 241–247. https://doi.org/10.1007/s10459-017-9783-0
Raudenbush, S. W., & Jean, M. (2014). To what extent do student perceptions of classroom quality predict
      teacher value added? In T. J. Kane, K. A. Kerr, & R. C. Pianta (Eds.), Designing Teacher Evaluation
      Systems, 170–202. Josey-Bass Press.
Seldin, P. (1999). Current practices—good and bad—nationally. In P. Seldin & P. Hutchings (Eds.), Changing
         practices in evaluating teaching. A practical guide to improved faculty performance and
         promotion/tenure decisions (pp. 1–24). Anker.
Theall, M., & Franklin, J. L. (1990). Student ratings in the context of complex evaluation systems. In M. Theall
        & J. L. Franklin (Eds.) Student ratings of instruction: Issues for improving practice (Directions for
        Teaching and Learning, No. 43). Jossey-Bass.

Journal of Educational Research and Practice                                                                32
Richardson & Williams 2021
Wallace, T., Kelcey, B., & Ruzek, E. (2016). What can student perception surveys tell us about teaching?
Empirically testing the underlying structure of the Tripod Student Perception Survey. American
Educational Research Journal, 53(6), 1834–1868. https://doi.org/10.3102/0002831216671864
The Journal of Educational Research and Practice is a peer-
reviewed journal that provides a forum for studies and dialogue
about developments and change in the field of education and
learning. The journal includes research and related content that
examine current relevant educational issues and processes. The aim is to provide readers with knowledge and
with strategies to use that knowledge in educational or learning environments. JERAP focuses on education at
all levels and in any setting, and includes peer-reviewed research reports, commentaries, book reviews,
interviews of prominent individuals, and reports about educational practice. The journal is sponsored by the
Richard W. Riley College of Education and Leadership at Walden University, and publication in JERAP is
always free to authors and readers.
Journal of Educational Research and Practice 33You can also read


