Long-Term Effect of COVID-19 Outbreak on Consumer Behavior and Online Retail in the United Kingdom - Bachelor Thesis for Obtaining the Degree ...
←
→
Page content transcription
If your browser does not render page correctly, please read the page content below

Long-Term Effect of COVID-19
Outbreak on Consumer Behavior
 and Online Retail in the United
           Kingdom

    Bachelor Thesis for Obtaining the Degree

              Bachelor of Science

          International Management

             Submitted to Dr.Daniel Dan

                Fedor Volchkov

                     1821059

               Vienna, 19th May 2021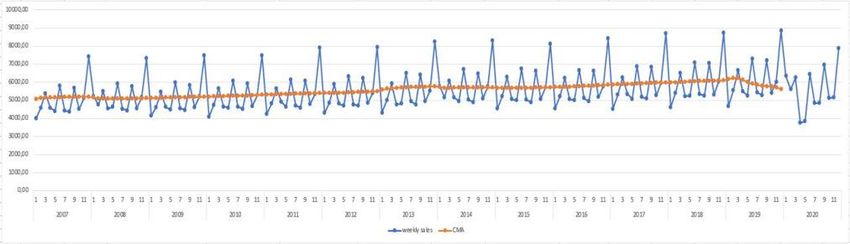
Affidavit

I hereby affirm that this Bachelor’s Thesis represents my own written work and that I
have used no sources and aids other than those indicated. All passages quoted from
publications or paraphrased from these sources are properly cited and attributed.

The thesis was not submitted in the same or in a substantially similar version, not
even partially, to another examination board and was not published elsewhere.

19.05.2021

Date                                        Signature

                                           2
Abstract
The year 2020 has shown to be very different for the world due to the outbreak of
COVID-19 virus that has affected the everyday lives of nearly everyone. The change of
pace and restrictions have also affected the retail industry in the United Kingdom. It
is a current issue at the time of writing, making the topic highly relevant for the future

This study has used Time Series analysis to determine whether the shifts in retail
industry towards online purchases can be attributed directly to the virus outbreak as
well as investigate the reliability of historical data-based forecast methods in the time
of uncertainty such as the ongoing pandemic. The study discusses the state and role
of retail in the United Kingdom prior and during the COVID-19 outbreak as well as the
holistic dynamic of online retail practices worldwide.

By using data smoothing against seasonality it was made possible to relate retail sales
data with the infection rate data, facilitating their correspondence and the effect of
one on the other. By comparing the created forecast for the year 2020 to the real-life
data It was concluded that sole reliance on historical-data forecasts can work well in
predictable market conditions, however greatly deviates from the uncertainty created
by said outbreak. All things considered, the study successfully created a future outlook
for the upcoming trends in retail methodology and with that in mind advocates for
the shift towards a more internet-based commercial activity.

                                            3
Table of Contents

Affidavit .....................................................................................................2

Abstract .....................................................................................................3

Table of Contents........................................................................................4

List of Tables ..............................................................................................6

List of Figures .............................................................................................6

List of Abbreviations ...................................................................................7

1 Introduction .............................................................................................8

    1.1        Background ........................................................................................... 8

    1.2        Relevance of Topic ................................................................................ 8

    1.3        Aim of Study ......................................................................................... 9

    1.4        Research outline ................................................................................. 10

2      Literature Review...............................................................................11

    2.1        Definitions .......................................................................................... 11
       2.1.1      COVID-19............................................................................................................. 11
       2.1.2      Retail ................................................................................................................... 12
       2.1.3      Case Study ........................................................................................................... 12
       2.1.4      United Kingdom .................................................................................................. 12

    2.2        COVID-19 ............................................................................................ 13

    2.3        Online Retail ....................................................................................... 14

    ...................................................................................................................... 16

    2.4        Retail Before COVID ............................................................................ 19

    2.5        Retail During COVID ............................................................................ 21

                                                                    4
2.6       Forecasting ......................................................................................... 24

    2.7       Summary ............................................................................................ 26

3     Methodology .....................................................................................27

    3.1       Research Design .................................................................................. 27
      3.1.1      Quantitative Analysis .......................................................................................... 27
      3.1.2      Time Series Analysis ............................................................................................ 28
      3.1.3      Seasonality .......................................................................................................... 28
      3.1.4      Moving Average and Centered Moving Average ................................................ 29
      3.1.5      Regression........................................................................................................... 30
      3.1.6      Root Mean Square Error ..................................................................................... 30

    3.2       Sampling and Data .............................................................................. 30

4     Findings .............................................................................................32

5     Conclusion .........................................................................................41

Bibliography .............................................................................................45

                                                                  5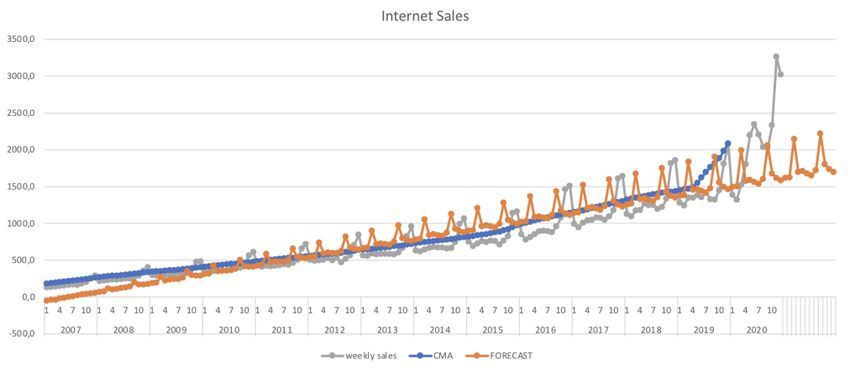
List of Tables
Table 1. Visualization of Time Component
Table 2. Average COVID-19 infection rate per week
Table 3. Seasonal components of retail sales in the UK
Table 4. Regression and ANOVA of all retail sales
Table 5. Regression and ANOVA of online retail sales
Table 6. Regression and ANOVA of offline retail sales
Table 7. RMSE values of retail sales forecasts.

List of Figures
Figure 1. Online retail sales in billions of US dollars
Figure 2. E-commerce sales growth rate expressed in %
Figure 3. Number of digital buyers in billions
Figure 4. Source of product inspiration for buyers.
Figure 5. Value of sales in online retail in the UK in billions of British Pounds
Figure 6. Share of digital vs physical sales of entertainment industry in the UK
Figure 7. Average monthly searches of key words “buy online” per 1,000
Figure 8. Average weekly sales of retail in the UK
Figure 9. Average weekly online retail sales in the UK
Figure 10. Average weekly offline retail sales in the UK
Figure 11. CMA of all retail sales in the UK
Figure 12. CMA of online retail sales in the UK
Figure 13. CMA of offline retail sales in the UK
Figure 14. Forecast of all retail sales
Figure 15. Forecast of online sales
Figure 16. Forecast of offline sales
Figure 17. COVID-19 Infection rate in the UK
Figure 18. The comparison between the COVID-19 Infection rate and online retail
sales in the UK for year 2020

                                               6
List of Abbreviations
UK – United Kingdom
ONS – Office for National Statistics
COVID-19 – Coronary Viral Disease 19
B2C – Business to Consumer
B2B – Business to Business
71 Introduction
1.1 Background
On 31st of December 2019 a cluster of pneumonia cases was reported in Wuhan,
Hubei Province of China that after on gas been identified as a novel virus named
COVID-19, on January 12th 2020 China has publicly shared the genetic sequence of
said virus. Later that month on the 22nd evidence of human-to-human transmission
arose, and on the 30th it was given a high risk label at the global level (WHO, 2020).
At the time of writing (14th of April 2021) there are 136,739,552 confirmed COVID-19
cases along with 2,947,244 deaths (WHO, “WHO Coronavirus (COVID-19)
Dashboard”).
The statistic shows that the virus could impose serious danger and thus many of the
countries affected imposed lockdown measures, that will be covered in greater detail
in the Literature Review section of the paper. The lockdown measures worldwide
primarily involved restrictions on movement outside of one’s home and
restrictions on keeping brick-and-mortar retail outlets open, forcing the
businesses to change or minimize their activity.
1.2 Relevance of Topic
The fact of said lockdown however implies a shift in the everyday life of an average
human in the given population, which inevitably includes the process of consumption
of goods and services, many of which have become unavailable as a direct result of
the outbreak. That ultimately brings it to the relevance of research directed at the
ways how can a consumer still remain consuming in the new reality that the pandemic
has brought, the willingness of the consumer to carry on consuming and what
selection of goods and service will be relevant for that consumer in the new norm of
living, now that the outbreak has been affecting people’s lives for slightly over 12
months time.
8The COVID-19 is an ongoing global event, with a fairly recent point of start and a quite
unpredictable nature due to absence of past experiences of such scale and coverage
in human history. It is therefore crucial to study the intricacies of it’s potential
influence on other dynamics of everyday life, firstly to be able to adapt to the new
possibly long-lasting changes that the spread of illness has imposed on the public.
Given the topics origin date, the recency factor is strong in this study, as it may be one
of the first research projects to address the issue of online retail shift in the United
Kingdom and what could be derived from it for the future. In the next section I’d like
to express the exact aims of research further.
1.3 Aim of Study
The study is aimed at determining the effect the presence of COVID-19 and
corresponding restrictions imposed on the public, have on the purchasing behavior
the customers in the domestic market of United Kingdom showcase, the buying
tendencies that experience shifts induced by lack of mobility, the product demand
change due to the newly readjusted priorities if such are present. Ultimately these
variables are expected to converge in the study to determine how they affect online
retail sales, what attributes to it and what could this mean for retail businesses long-
term in the future.
After the effect is measured the study is aimed at creating a forecast of the future
values of retail merchandise and services sold online, understanding the market
trends of the United Kingdom and providing help of understanding which direction
the retail business and it’s customers are likely to be diverging to post-COVID.
The research is also aimed at evaluating the accuracy of the forecast that is based on
historic data, the goal is to determine whether reliance on such forecasting method is
still possible in less predictable macroeconomic conditions without significant
deviations from the real-life data.
9The study is also meant to encompass the current available information on COVID-19
and showcase whether the techniques and logical approaches that are taken at this
time for tackling the said topic will prove themselves to hold true in the medium and
long-run future.
1.4 Research outline
After the ‘big picture’ aim of this research has been defined it is important to narrow
down the objectives of the study further in order to outline what precisely needs to
be determined by this research as well as what needs to be empirically measured to
obtain the desired results.
To begin, the research question of the paper needs to be voiced out, so do the
variables that go into the technical part of the data analysis necessary to progress the
work. To keep the main framework simple and easy to understand the aspects are
phrases as following:
• Research Question - “Does the COVID-19 outbreak have an effect on the
online retail sales in the UK?”
• Independent Variable of the study - “COVID-19 infection rate”, this is taken as
the independent variable due to the reasons of it being nearly impossible to
influence by anything coming from humans, but more importantly, because
the effect of this variable needs to be measured to get results, making it the
“ground zero” of this research.
• Dependent Variable of the study - “Online retail sales in UK”, the dependency
of this variable is explained by the need to evaluate the effect the earlier
mentioned variable has on this variable, therefore suggesting sales
fluctuations’ volatile and dependent nature.
With this in mind, the research concentrates on empirically determining the numerical
value changes between these two main variables, as that could serve as the ultimate
indicator of the effect presence. However, other things need to be taken into account
10In order to be able to understand and predict the long-term effects of the pandemic,
and evaluate the purchasing behavior of an average retail customer in the United
Kingdom. These extra variables that go into the long-term prognosis of retail domestic
market are covered in the next section.
2 Literature Review
To be able to fully interpret the materials of this study, it is vital to define some of the
concepts used in it. Without proper definitions it could be challenging to research and
filter out the information relevant to the research topic. The concept of “COVID-19”
has only been created recently and gained traction partially due to the topics covered
in this study, showing it’s novelty and relevancy to the current world events and the
study. It is also crucial to gain in-depth knowledge on the background information of
the location of case study and it’s recent history with the COVID-19 virus to be able to
use the information in own research and create further forecasts.
2.1 Definitions
2.1.1 COVID-19
The COVID-19 is a newly named mild to severe respiratory illness with typical
symptoms including cough, fever and loss of smell that could also progress to
pneumonia and respiratory failure. The virus was first discovered in Wuhan, China in
2019 from where it has later on spread out into other countries eventually causing
the pandemic (Merriam-Webster, “Covid-19”). The virus is believed to spread mostly
through close contact and is generally considered highly contagious thus the
lockdown measures were chosen as the prevention method, limiting gatherings and
therefore respiratory droplets exchange (“Coronavirus (COVID-19) frequently asked
questions”, 2021). The term itself is derived from “CO” for “Corona”, “VI” for “Virus”
and “D” for “disease” with 2019 being the year of discovery (“Coronavirus (COVID-19)
frequently asked questions”, 2021)
112.1.2 Retail The Merriam-Webster dictionary defines retail as “to sell in small quantities directly to the ultimate consumer” (Merriam-Webster, “Retail”), in this case meaning almost any B2C (Business-to-Consumer) industry such as Clothing, Food, Electronics and many more with the exception of Automotive Fuel. Though fuel is a consumer good and is sold to the final consumer by businesses, it is exempt from the statistic as to even out the numbers of traditional vs online retail in volume, value and market share comparisons, this is further covered in the Methodology section of the paper with relation to the sample and types of data used in analysis. 2.1.3 Case Study A case study allows to examine a concept or an issue in-depth in a real-life scenario with little to no variable manipulation (Crowe, et al., 2011). This approach fits well with the aim of this study as it allows to analyze information that was obtained naturally and therefore is high in validity. As what this paper is aimed at measuring and correlating the relationship of two real-life occurrences or events that is COVID-19 outbreak and raw data showing changes in the way how people shop, rather than some abstract concepts, a case study is fitting as real life results allow real life interpretations and real life progress with the current shifting situation, more on this will be touched upon further in the Methodology section where the Research Design is described in greater detail. 2.1.4 United Kingdom United Kingdom or United Kingdom of Great Britain and Northern Ireland is a country in Europe comprised of England, Scotland, Wales and Northern Ireland with a population of roughly 65 million people (Merriam-Webster, “United Kingdom”). The UK ranks high in the Human Development Index positioning itself on the 13th overall place with the HDI value of 0.932, life expectancy above 80 years and over 46,000 USD Gross National Income (GNI) per capita (“Human Development Reports”, 2020), therefore it is often included in the lists of More Developed Countries and is generally 12
considered part of the developed world. Another aspect of why the United Kingdom
was chosen as the location of case study research is because prior to the pandemic it
was ranked 2nd in countries most prepared for a pandemic list (Cameroon, Nuzzo, &
Bell, 2019), regardless of whether or not that statistic has proved itself accurate, the
United Kingdom is a country that other countries are likely to look up to for expertise
and well executed decisions due to its status in global politics, it was therefore decided
that it is best to showcase the better case scenario as an example for other countries
to later expand on and follow rather than take an average scenario that will be
challenging to use for paving future paths for commerce and purchase behavior
analytics and forecasts.

2.2 COVID-19

On January 29th 2020 the first two COVID-19 patients tested positive in the UK
(Aspinall, 2019) and later on January 30th 2020 the first COVID-19 death in the UK has
been registered (McMullan, Duncan, Blight, Gutierrez, & Hurley-Jones, 2021). This
broke ground for the still ongoing at the time of writing pandemic-induced crisis that
will result in over 2.65 million deaths worldwide and over 125,000 deaths in the UK
alone (WHO, “WHO Coronavirus (COVID-19) Dashboard”), as well as a significant
decrease and shift in commercial activity, which I will touch on later in the chapter.

As the official information shows, retrospectively the outbreak in the UK followed a
pattern similar to the pandemic worldwide, with two waves in spring and fall of 2020
going into the winter of 2021 (“Official UK Coronavirus Dashboard”, 2020), though the
first wave is seemingly much smaller and therefore less significant than the second
one, it still has had it’s influence on the commercial practices in the United Kingdom
and led to the involuntary restructuring of fundamental processes and methods of
conducting business.

On March 23rd 2020 the United Kingdom government announces the first lockdown
measures, limiting people’s options to go outside and granting police authority to
enforce the newly introduced rules (McMullan, Duncan, Blight, Gutierrez, & Hurley-

                                           13
Jones, 2021). As it was believed that the lockdown is essential to save lives of people
as concerns about the strength of the National Health Service (NHS) were expressed
(Iacobucci, 2020). The imposed limitations implied new rules for the businesses as well
as other places opened to the public, Prime Minister Boris Johnson covered the
closure of all non-essential stores in his open letter to the public, urging people to be
responsible and avoid gatherings of more than 2 people (Johnson, 2020).
The lockdown lasted until so called ‘Super Saturday’ on July 4th 2020 when retail
businesses and foot outlets such as pubs and restaurant were allowed to open (Hill,
Campbell, & Walker, 2020), however despite the stagnation of daily infection rate
increase and government’s efforts to tackle the disease and avoid the second
lockdown measures, businesses only had roughly 4 months to reopen and operate
until the second lockdown was commenced on November 1st 2020 urging the non-
essential market segment to close down for an initial period of 4 weeks (Savage,
Inman, & McKie, 2020).
Mid-December of 2020 a new variant of COVID-19 has been found in the south of
England (Sample, 2020), believed to be 30% more lethal than the previous strain
(McMullan, Duncan, Blight, Gutierrez, & Hurley-Jones, 2021), delaying the
opportunity to reopen by an indefinite time period, forcing businesses to adapt even
further to the new reality of conducting commercial operations and functioning under
rapidly changing conditions.
2.3 Online Retail
Online retail can be defined as the process of selling a product or a service online,
through a sales distribution channel such as website replacing a physical store, and
distribution/fulfillment centers serving for storage and shipment of product for the
final consumer, same as traditional retail, online retail refers primarily to B2C business
model (Hargrave & Anderson, 2021). Online retail has been gaining traction in recent
years as suggested by the E-commerce worldwide report, the values recorded since
142014 have shown stable growth in volume of purchases made online over the
years and the projections only estimate further growth into the mid-20s (Fig.1 & 2)
7,000 6,388
5,908
5,424
Sales in billion U.S.
6,000 4,891
5,000 4,280
2,982 3,354
dollars
4,000
3,000 2,382
1,845
2,000 1,336 1,548
1,000
0
Figure 1. Online retail sales in billions of US dollars. Source: Statista
30% 28%
25% 22.9%
E-commerce sales
20.7%
19%
growth rate
20% 17.1% 15.6% 14.9%
15%
10%
5%
0%
2017 2018 2019 2020* 2021* 2022* 2023*
Figure 2. E-commerce sales growth rate expressed in %. Source: Statista
The numbers of buyers worldwide have also shown growth (see Fig.3), which can
only suggest that customers are becoming more and more aware of the
possibility of shopping online, thus a snowball effect could be expected, as it is often
that a launch of a new product or service can have a difficult start but as more
people decide to try it and have a pleasant experience, each additional customer is
easier to gain, the service in this case being the global possibility to order a
product online and expect it to be delivered to you whether it is physical or digital.
152.5 2.14
2.05
Digital buyers in billions
1.92
2.0 1.79
1.66
1.46 1.52
1.5 1.32
1.0
0.5
0.0
2014 2015 2016 2017 2018* 2019* 2020* 2021*
Figure 3. Number of digital buyers in billions. Source: Statista
For online retail to become the new norm, not only the purchasing process needs to
be convenient, reliable and easy to orient in - the people need to fundamentally shift
their thinking in terms of where they seek new products to purchase and what
channels of information work best for them to be inspired and convince to make the
purchase. As the report further suggests the top 6 channels for am online customer
to become familiar with the product are also online, with physical store landing on
the 7th most popular position (see Fig. 4), this suggests that Online Retail is largely
an online-only ecosystem where marketing and education of customer about new
possible ways to buy are best to be done also online. Thus the more this field is
explored, the more likely online retail is to prevail, with currently ‘offline customer’
eventually switching to the new ways of consumption.
60% 52% 51%
50%
Percentage of
respondents
40%
30% 20% 19% 19% 18%
15%
20% 6% 4% 4% 3% 3%
10% 1%
0%
Figure 4. Source of product inspiration for buyers. Source: Statista
The projected popularity of online retail in Western Europe is on the third place by
region worldwide at roughly half a trillion US dollars, which includes the United
16Kingdom in the geographical category, though the placement is not
leading worldwide it could mean more room for expansion in the region in the
future, and that is why it is vital to look at the United Kingdom separately to be
able to form further predictions.
The report on the internet industry in the United Kingdom suggests that
the country’s domestic market follows a similar trend as does the
worldwide dynamic of implementation of online sales into the retail industry. As
recorded and shown on the graph below, the B2C market segment is showing
stable growth in volume expressed in British Pounds from year to year, despite
a dip in 2015, the dynamic is still evident (see Fig. 5) . The trend can also be seen
in the graph showing the shares of revenue that can be attributed to digital
channels with a five year difference in measurements as well as the statistic
showing the comparison between digital and physical sales (see Fig.6).
vs physical entertainment products sold domestically.
Sales to private customers (B2C)
Sales to businesses or public authorities (B2B)
300
Sales in billion GBP
188.3166.1 197.1
200 159.4137.2 159.3
119.3108.1 118.5118.2 134.1113.8
100
0
2014 2015 2016 2017 2018 2019
Figure 5. Value of sales in online retail in the UK in billions of British Pounds. Source:
Statista
17Digital Physical
9,000
8,000
7,000 1,421.3
1,801.1
Sales in million GBP
6,000 2,034.4
2,193.4
5,000 2,578.4
2,836.9
4,000 3,145.9
3,000 3,859 3,175.5 6,373.5
5,807.4
2,000 4,464.8 4,857.9
3,558
2,960.7
1,000 2,393.8
1,366.6 1,916
0
2011 2012 2013 2014 2015 2016 2017 2018 2019
Figure 6. Share of digital vs physical sales of entertainment industry in the UK. Source:
Statista
Based on the market dynamics discussed, the general trend can be labeled as bullish
and therefore a steady expansion of the online industry can be expected under normal
conditions. However, could already at the stage of Literature Review this be somehow
tied to the COVID-19 pandemic, with it impacting the industry to the point that in
deviates from the already existent projections? Going back to the Worldwide Report, it
could be suggested that certain discrepancies and less expected observations were
found when discussing the topic on the global scale. For instance the worldwide
interest for search engine keywords “buy online” has nearly doubled within the
month of March when COVID-19 reached multiple Western countries including the
UK (see Fig. 7).
A different e-commerce report for 2020 suggests that all online commercial activity
can be expected to grow 10% on average as a direct result of the pandemic with the
biggest winner of the situation being Food & Personal care at 21% projected growth
and the smallest growth of 7% is expected from the Electronics & Media sector
(Statista, 2020). With this in mind it is already fairly clear which direction the shift
can be expected in the United Kingdom as well, however it is necessary to look at
the domestic market and retail trends there in greater detail to be able to state more
on the matter. 1830 27.1 27.1 27.1
searches in 1,000s
Average monthly
25 22.2
20 18.1 18.1
14.8 14.8 14.8
15
10
Figure 7. Average monthly searches of key words “buy online” per 1,000. Source:
Statista.
2.4 Retail Before COVID
Based on historic data provided by the Office of National Statistics of the United
Kingdom, all retailing in the UK has been following a fairly predictable upwards
pattern with seasonal peaks and troughs based on the time of year (see Fig. 8), as for
example annually the highest value of retail sales was in December around
Christmas time with three notable peaks between the said season (Dalgleish, 2021).
Figure 8. Average weekly sales of retail in the UK. Source: ONS
As this data also suggests, if values of traditional retail are separated from the values
of retail done online, it is likely that the increase over the years can be largely
attributed to the latter, as the traditional retail timeline appears flat with a slight dip
present in the year 2020 (see Fig. 10), whereas online retail is going up in value and
market share (See Fig. 9)
19(Dalgleish, 2021). Important to note, in this context the dip does not represent the
nominal change in values, as it illustrates the general trend of each segment.
Figure 9. Average weekly online retail sales in the UK. Source: ONS
Figure 10. Average weekly offline retail sales in the UK. Source: ONS
With the research topic in mind, it isn’t crucial to understand the dynamics of
traditional retail thoroughly, as it is the most established form of retail by value and
market share (Dalgleish, 2021) and therefore shown to not be significantly volatile
even with such major events such as pandemic-induced lockdown.
Online retail however, has been gaining traction in the recent years prior to the
COVID-19 outbreak, showing growth numbers such as 15.9% in 2017, comparatively
to only 2.3% for the traditional retail stores. Online spending has been also growing,
hitting 18.2% of all money spent on retail goods being spent online in 2018. In 2008
the proportion of online sales to traditional brick-and-mortar sales was 4.9%, so it can
be perceived as a significant leap in just a decade time, increasing more than threefold
(Humphries, 2019).
20However, certain industries had it easier growing online presence, with clothing and
department stores selling nearly 20% of their merchandise online, food sector has
been floating at 5% of sales done online (Murphy, 2018). The pandemic could be
viewed as an opportunity to help the lagging market segments catch up with the rest
thus driving the overall online sales upwards in value, as well as already present
industries being largely non-essential (such as clothing) and so being forced into
restructuring.
The online market segment entered lockdown on a 4 month decline of share of total
retail sales, falling from 21.6% in November 2019 to 19.1% in February 2020
(Dalgleish, 2021), a normal occurrence due to seasonality judging by the historical
data, the market however was disrupted by an atypical event not seen previously in
modern history so the market reaction was unpredictable. With that said, looking at
the performance of retail businesses under new rules could give enough insight to be
able to predict next market trends, improve efficiency of current business models and
develop new models from scratch that would be tailored to the new reality that this
global outbreak has brought, bringing us to the overview of the retail segment once
the outbreak has started.
2.5 Retail During COVID
As previously mentioned, COVID-19 outbreak resulted in lockdown and closure of all
non-essential businesses due to health concerns and in order to contain the spread of
disease (McMullan, Duncan, Blight, Gutierrez, & Hurley-Jones, 2021), it is safe to say
that changes in how retail markets function were inevitable as not only the traditional
forms of retail became extremely limited by default, but also it is unclear when the
pandemic will be tackled and whether it’ll be possible or even necessary to revert back
to the pre-COVID system once restrictions can be lifted.
In hindsight, it can be seen that the overall Sales in retail sector has experienced a
major downfall of 0.3% in comparison to 2019 numbers, making it the biggest fall since
211995 (Partington, 2021). This statistic could be attributed to the imposed limits as well
as growing unemployment rate of 5.1% making it the highest figure in 5 years,
implying lesser purchasing ability and available disposable income to the general
public (King, 2021).
It’s no secret that if one channel of commerce is limited or shut off, the activity in
others is likely to increase as people still need to purchase goods, perhaps a different
selection and in smaller quantities, yet it is hard to imagine that a society stops
consuming non-essential goods altogether even amidst pandemic and unclear
socioeconomic situation. So that is exactly what happened with online segment of
retail goods, as it was observed that online sales have shown 36% annual growth
making it the highest performance since 2007, with the predicted growth being only
7.8% prior to the pandemic (Partington, 2021). The growth numbers bring the
overall share of goods sold online up significantly, as according to the UK’s
Office for National Statistics market share grew from 19.1% in February 2020 all
the way to 32.8% in May 2020 (Dalgleish, 2021), an increase never seen before in
the recorded statistics that suggests possible correlation of COVID-19 events to
the unexpected growth of online retail. This brings up a question - what did people
buy and for how long those newly acquired consumer traits will define the market
and shape future businesses? Will this shift be temporary or is this the brink of the
completely new age of consumer behavior and spendings?
A survey suggests that people have actively increased their online consumption of not
only goods but also services with online banking and streaming services, 22% and 34%
respectively have reported using said services more with share of people with access
to any subscription growing from 55% to 65% in one year, however only online
banking is likely to continue rapid development as 62% of respondents claim that they
plan on using this service on similar basis post lockdown, in comparison to 45% in
streaming services’ case making it the minority (Jahshan, 2021).
Not every industry has experienced drastic changes in the way how their retail outlets
function, even when discussing solely non-grocery and non-essential goods. Based on
22Google’s search insights for Consumer Electronics segment the proportions of offline
and online sales did shift from 55/45 in 2019 to 73/27 in 2020 (expressed in
percents with maximum value 100), fundamentally the change is not that significant
as the hierarchy has remained the same with offline brick-and-mortar outlets still
being the main channel of sales for the said industry and companies within it, however
when drawing a comparison to the Fashion industry for instance, the same insights
show that the proportions changed from 41/59 in 2019, showing primary reliance on
offline purchases whereas in 2020 the ratio was already 86/14 showcasing complete
flip of how fashion oriented companies make sales and push their products. This could
be attributed to a different survey that suggests that people no longer wish to ‘shop’,
they wish to ‘buy’ meaning that purchases made in 2020 were likely to be more
direct and to the point with less time being spent on browsing different options. The
same survey suggests that new product discovery is likely to be primarily digital
implying the inevitable shift to an all-digital consumer environment where company
stores play a small role and could be used as marketing displays and shopping outlets
for the shrinking minority of people who prefer in-store shopping.
As mentioned, to go forward it is not only crucial to understand the sales channels
that people will grow to prefer using over the lockdown time period to be able to run a
retail business successfully in the upcoming years, but also to be able to estimate
what products are in high demand at the time, as demand is key to a well-selling
product. Going back to information collected by Google through analyzing the
information searched by people in the United Kingdom, it can be observed that such
topics as Home Decor and Gardening shown interest growth of up to 250% when
comparing to the previous year, the trend is believed to stay on the rise and
potentially find a new equilibrium as more and more people shift their priorities
towards increased spendings on their homes as they start spending more time in
them, similar logic can be applied to gardening as it is a leisure activity that one can do
without leaving their home which is quite relevant for the year of 2020 (L’Estrange,
2020). With the pandemic border restrictions affecting global supply chains it is also
evident that the general consumer in the UK is now more aware of importance for the
domestic economy to be able to supply it’s people with goods they need and it shows,
23the majority (57%) report that they are more likely to still spend locally on local products rather than elsewhere as well as Google search has seen a significant increase in ethically conscious brands that responded to the pandemic as well as minimize their waste and footprint (L’Estrange, 2020). Notably, it is also suggested that higher engagement online is why sales were able to return to their pre- pandemic numbers. 2.6 Forecasting When discussing forecasting in the context of this study, it primarily focuses on sales forecasting - prediction of future sales revenue that can be based on historical information as well as general industry trends (Bishop, 2020), in this context it’ll be assessing the retail industry, the industry selling consumer goods, and concentrate largely on historical data to determine the said trends. There are several reasons why forecasting sales can be crucial for understanding an individual business or, on the macro level, a country’s economy. Most importantly it can be used to make accurate decisions regarding stock keeping, staffing and maintaining understanding of customer demand as well as adjust your practices to maximize the efficiency of a business functioning (Walker, 2021). Creating a sales forecast can help predict cycles and seasons of sales, that can assist in making all the above mentioned decisions (Bishop, 2020), under usual, predictable conditions. However, the outbreak of COVID-19 created unpredictable market conditions that make forecasting more complicated due to lack of historical data recorded during a similar event, as no such event has occurred before in modern history. This therefore raises a question, can forecasts be used and trusted during uncertain times and if not, how far does a forecast based on pre-recorded data would deviate from the actual events and values recorded in the year 2020? During a time of uncertainty it is necessary to evaluate the priorities within the company (McLeod & Lotardo, 2020), therefore the breakdown of offline and online retail could assist further in determine whether a priority shift in sales channels is necessary to continue working efficiently during and after the pandemic. The retrieved information could 24
also showcase the accuracy of previous existing forecasts when it comes to
estimated growth rate of online retail as well as general projections based
on historic information available through The Office of National Statistics of the
United Kingdom.

After reviewing the retail industry in the United Kingdom pre- and post-COVID
outbreak, it is time to review various forecasting techniques to be able to distinguish
the one most fitting for proceeding with the case study and research what outcome
could be expected from the pandemic conditions and retail restrictions.

Three types of forecast can be identified according to Harvard Business Review -
Qualitative Techniques, Time Series Analysis and Projection, and Causal Models
(Chambers, Mullick, & Smith, 1971). Each of the types works best in a specific
scenario and for a specific data type available therefore it is now necessary to see
what can be attributed best to the earlier described context of the study.

Qualitative techniques imply usage of qualitative data, meaning likely non-numerical
and possibly subjective such as expert opinions as suggested by HBR. There are
several methods covered in this review alone, however it can already be
determined that these techniques are unlikely to fit the desired research based on
the data required. The data available for this research is numerical and will be
covered in more detail in the following chapter.

Time Series Analysis and Projection focuses on pattern recognition and change and is
entirely backed by historical data (Chambers, Mullick, & Smith, 1971). Out of
the methods covered, ‘Moving Average’ has caught attention for being able to
identify seasonality in the data and assist in its removal. This could be of help
for further isolating the historical data that can later on be used to forecast future
sales as well as allowing to witness the general trend of value shifts.

The third type is Causal Model, the method that facilitates relationships between
elements     and    uses    refined    and     specific   information.    It   involves
statistical measurements and calculations
                                       25 such as regression model, hence the
ability to
measure relationships (Chambers, Mullick, & Smith, 1971). Some of the described
methods regression included could be useful for the research covered in this paper.
However, this method implies high specificity of information and less reliance on
historical data in comparison to Time Series, as COVID-19 outbreak in an
unprecedented event that is so recent that not enough information is available on the
subject and enough specificity can hardly be achieved. Therefore, out of the 3 types
described - Time Series Analysis is the most appropriate method to use as the variable
that needs to be tested can be traced by seeing the deviations from the historic norm
during the period of uncertainty that the outbreak is. Time Series Analysis with
graphical plotting and statistical elements is the chosen method of forecasting for the
study and will be covered further in Methodology and Findings chapters.
2.7 Summary
To shortly summarize on what has been stated in this chapter, the information
covered is primarily fact-based at its core, meaning it merely shows whether or not
something has happened, but not necessarily why it happened and how it could have
affected other variables in the chain of events. For instance it can already be claimed
that COVID-19 cases have gone up and down at the recorded dates or that empirically
the sales of certain goods have been fluctuating across sales channels such as
traditional retail and online retail, with online retail showing better performance at
respective recorded dates and value numbers. It was discussed how online retail has
been functioning in recent years and what dynamics were observed under market
conditions more predictable than the ones during the ongoing outbreak and why the
segment growth can be anticipated in the upcoming years. The section covered the
decisions made by the government as well to showcase the context of market
conditions as not the infection cases directly caused the shopping paradigm to shift as
much as steps taken by authorities could cause an effect on the performance of the
retail sector. Notably, it is also important to highlight the possibility of emerging
trends to stay in place for an extended period of time, as people have reported that
some services such as Online Banks they would prefer to continue using further on.
Therefore, substantial part of this research is aimed at determining the effect of
26COVID-19 on retail in both short and long run, as that would allow the humanity to
make higher accuracy predictions for upcoming global events if market performance
can be directly linked to certain restricting measures, in the upcoming times once
will be necessary the measures can be evaluated and a different approach
used to maximize not only effectiveness but also be able to preserve and assist the
market as much as possible. The Literature Review section has also addressed
various tactics and approaches that can be taken in order to achieve forecast
accuracy, making it reliable to be used in longer runs and thus possible to adapt
commercial practices to the extraneous macroeconomic conditions. During the
discussion is has also been shown what technique will be used for the current
study in hope to achieve meaningful results.
However, it cannot be yet claimed that one event happened because of the other,
for now it can only be assumed. Therefore, the aim of the next section titled
Methodology is to go further in-depth on the matter and determine whether or
not the data described can be attributed and tied together to the mentioned
events.
3 Methodology
This section is primarily aimed at describing the techniques and ideas implemented
in the conducted study as well as further discussion on the data presented and what
it can tell about the effect of COVID-19 outbreak could have on the examined
industry. All the computations necessary to prepare data for desired analysis as
well as some of the graphs and tables shown are done in Microsoft Excel.
3.1 Research Design
3.1.1 Quantitative Analysis
Quantitative Analysis is a method that is meant to analysis primarily numerical data,
with the usage mathematical and statistical measurements. It is used heavily
when analyzing past events and forecasting future ones such as for instance
financial
27instrument valuations and macroeconomic shifts (Kenton & Anderson, 2020). Based
on this definition it was decided that this form of analysis is most fitting for the
anticipated research as it revolves around analysis of historical data to make future
predictions as well as uses quantifiable, tangible information that doesn’t need
further definition than it’s numerical value.
3.1.2 Time Series Analysis
Time series is a series of numbers ordered with respect to relevant time periods for
each number (Peixeiro, 2019), allowing to track the change of a given variable over
that time period, see how it fluctuates and analyze it’s behavior. Given the nature of
the study it is understandable that time series is a viable option for usage as it would
allow to keep track of value, volume and infection rate for the variables that that are
being reviewed in the study. The data itself will be more touched upon later in the
chapter, however it can already be stated that the data taken is raw and therefore
seasonality will need to be first smoothed out for the data to show useful results later
in the study. Raw data in this case means unedited (Christensson, 2006) meaning
there was no additional manipulation with the estimations that were made, the
original data. The main two Time Series that will be used in this research are the Time
Series of infection rate in the United Kingdom for COVID-19, and the Time Series for
averaged out weekly online sales in millions of pounds. Additionally however the Time
Series of all retail sales as well as offline only retail sales will be used for drawing
comparisons to the main data provided as well as additional context of the case study.
3.1.3 Seasonality
Seasonality is a linear or non-linear component that changes over time and does
repeat forming a pattern that can later be seen in the trend line (Christensson, 2006).
If the data is not seasonally adjusted how it is in this case then it could be challenging
to see any form of trend as it is likely going to be repeating our with peaks and troughs
28in the respective months usually repeating annually. One of the ways how to
deseasonalize a data set is finding its moving average (MA) and centered
moving average (CMA) that allow to smooth out the discrepancies in data and help
isolate the seasonal component, that can later on be used to find a trend and
eventually make a forecast based on the deseasonalized data. The centered
moving average that appears as a byproduct of cleaning up a dataset can be used as
a form of trend line to show how the data with no seasonal components would look
like if talking solely the direction of where the trend is heading over time.
3.1.4 Moving Average and Centered Moving Average
3.1.4.1 Moving Average
Moving average is a series of averages of subsets within one dataset, that can
showcase averaged change in the data overtime (“Moving average definition”). The
method can be used in identifying patterns in growth/decline momentum that can
point to a certain seasonal trend, as it shows direction of the values movement in the
dataset. In the research described and carried out in this paper, the Moving Average
Is used as an intermediary step towards ‘smoothing’ the raw data presented and
understanding the general performance of retail sales in the given time period.
(Fernando, 2021)
3.1.4.2 Centered Moving Average
Calculating the Centered Moving Average or the CMA is the next step of preparing the
dataset for deseasonalization, that involves averaging the Moving Average values.
This is necessary as the number of values per subset is even in the case of this research
paper, meaning that there are 12 months in 1 year. Therefore, if only the MA is
calculated, there is no midpoint that could be assigned to a subset, the CMA is
therefore calculated to show the midpoint and narrow the dataset further to ease the
upcoming steps of data cleansing. When looking at a dataset visually it can be
observed that after the Centered Moving Average, the dates are aligned back to their
29corresponding values, unlike with just a single Moving Average (“Predictive Analytics
with Microsoft Excel: Working with Seasonal Time Series”, 2015)
After the additional smoothing, the dataset created can also be referred to as a double
moving average, as in essence the CMA is repeating the same process on an already
smoothed dataset (Hyndman, 2009)
3.1.5 Regression
Regression is a statistical concept that allows to determine the strength of
relationship, if present, between the dependent variable and the independent
variable (Beers & Anderson, 2021). In the case of this study the independent variable
is the number of daily COVID-19 infections in the United Kingdom whereas the
dependent variable is the averaged out weekly value of all retail purchases that were
done online prior and during the pandemic, however the regression was used for a
measurement of seasonal components that would later allow to calculate the Trend
values using the intercept coefficient.
3.1.6 Root Mean Square Error
The root mean square error is the standard deviation of the residuals, meaning it can
showcase how far the values are from the line of best fit (Glen, n.d.). In the case
of this study - RMSE was used to determine how close the original values were to
the values of the forecast, in order to add an extra layer of security and validity proof
so valuable results can be achieved.
3.2 Sampling and Data
The data used in this research is provided by the Office for National Statistics of the
United Kingdom, the data is referred to by the author as a ‘first estimate’ of retail sales
(Dalgleish, 2021), however the ONS is the largest independent producer of official
30statistics in the UK and is generally considered a respected and trusted establishment
(ONS, “About us”) therefore it is likely that the data found there is the closest to actual
values that is currently available, making it highly useful for a real-life scenario analysis
that a case study is.
The data report covers Retail Sales in the United Kingdom, the dataset is recorded in
millions of pounds and varies from monthly data to averaged out weekly data. It was
decided to bring the data to the common denominator of weekly sales, as it is the
shortest available time period available in the data report. The data was found nearly
ideal for the Time Series analysis as it is sorted with time factor in mind and each
corresponding value is attached to a specific date or time period allowing for it’s
graphical plotting and further analysis. The two datasets used out of the Retail Sales
Report are the Retail Sales in Pounds and Retail Sales Index internet sales data, both
sets are non-seasonally adjusted.
The data containing the dynamic of retail operations needs to be compared to the
data showing COVID-19 infection rates in the United Kingdom in order to compare the
trends in value fluctuations. It is once again best to retrieve the statistics from official
sources so the values of infection cases come from the governmental data center that
keeps track of everything COVID-19 related in the country. The data makes it on the
list from lab-reported cases (or lateral flow device for England only), it represents the
number of people that has tested positive for COVID-19 at least once, each person is
only counted once on the day of their first positive result to avoid repeating cases
(“Official UK Coronavirus Dashboard”, 2020).
It would take a long time and a lot of effort to fully define and describe the sample of
this study, as it includes an entire population of a country, likely involving nearly every
class, age and ethnicity there can possibly be, therefore it can be claimed as
representative as the study revolves around the United Kingdom and these datasets
display contributions from any member of the target population.
314 Findings
This section is aimed at highlighting the technical processes of conducting further
analysis on data mentioned in the Methodology chapter as well as the results that
those results show and the respective contributions towards the initial research
question determining the effects of COVID-19 on retail sales.
Notably, all datasets are ordered according to time, meaning that time factor is
assigned to each value numbering the total amount of input values as well as
showing the order that they must be listed in (see Table 1). The number assigned to
each value will be used in some of the further calculations necessary to analyze
the data and modify it to achieve desired results.
t year month
1 1990 1
2 2
3 3
4 4
5 5
6 6
7 7
8 8
9 9
10 10
11 11
12 12
13 1991 1
14 2
15 3
Table 1. Visualization of Time Component
The original two datasets used to start are ‘All retailing excluding automotive fuel’
starting in January 1990 through January 2021, expressed in millions of Pounds
Sterling and represent the total value of goods purchased, the dataset is expressed in
32monthly intervals meaning 12 values annually. The aim of using this dataset was to be
able to see the general trends in retail sales and consumption over an extended period
of time.
The second dataset used is “Average weekly online retail sales” recorded from January
2007 through January 2021, similarly to the previous dataset it is also expressed in
millions of Pounds Sterling and provides monthly values, 12 times a year. This dataset
can show directly how the online segment of retail has been performing over the
recorded period of time. In addition, a third dataset was derived from the original two,
an “offline retail sales” set was calculated by subtracting the online only retail values
from the all retail values for dates January 2007 through January 2021 to match the
online retail data in amount of values.
The datasets are expressed in different time units, average weekly values vs monthly
values, therefore it was decided to bring all data to the ‘common denominator’ and
convert the first dataset into averaged weekly values by averaging the monthly values
by the respective number of 7-day periods in the given month for better
correspondence with the online retail sales data (see Table 2).
# per week
Cases Per Month # of Weeks (7 days)
(average)
2020 2 46 4,14 11,11
3 38394 4,43 8 666,82
4 138876 4,28 32 447,66
5 78946 4,43 17 820,77
6 28296 4,28 6 611,21
7 20680 4,43 4 668,17
8 34009 4,43 7 676,98
9 150049 4,28 35 058,18
10 573932 4,43 129 555,76
11 600240 4,28 140 242,99
12 993655 4,43 224 301,35
2021 1 1195781 4,43 269 927,99
Table 2. Average COVID-19 infection rate per week.
33The following description of technical method applies to all 3 earlier mentioned
datasets. After the data was unified, it was necessary to find the Moving Average,
showing the average value number for 12 values shifting by a single value with each
next Moving Average, after that, same procedure was done to the MA when it was
averaged in pairs, with each shift being one value down the timeline. The values
calculated created the Centered Moving Average that has allowed to see the data with
significantly smaller seasonal discrepancy and get the general idea of the trend of
purchases over time (see Fig. 11,12 & 13).
Figure 11. CMA of all retail sales in the UK.
Figure 12. CMA of online retail sales in the UK.
Figure 13. CMA of offline retail sales in the UK.
34This has allowed to isolate the seasonal component for each month of the year,
for every year that a given dataset contains. The seasonal component is a useful
indicator for evaluating the seasonality of the data as it showcases how far
and to what direction does the value in the given period fluctuate in relation to the
averaged out value across all seasons The neutral value of 1 means generally no
seasonal deviations in the given month, with numbers deviating from 1 showing
which direction the discrepancy is leaning towards, whether there are more than
average purchases expected or less than average (see Table 3).
Month St (All retail) St (Online) St (Offline)
1 0,86 0,93 0,87
2 0,92 0,93 1,10
3 1,07 1,22 0,99
4 0,90 0,96 1,01
5 0,87 0,96 1,06
6 1,14 0,94 0,89
7 0,89 0,92 0,88
8 0,86 0,95 1,13
9 1,12 1,22 1,02
10 0,90 0,98 0,81
11 1,02 0,94 1,07
12 1,45 0,92 0,88
Table 3. Seasonal components of retail sales in the UK.
After the seasonal component was determined it was made possible to fully
deseasonalize the original data as the component allowed to estimate to what extent
each of the values needs to be ‘smoothed’ to achieve seasonally adjusted data.
The next objective of the research after smooth data was obtained is to calculate the
trend of market movement in the discussed retail segment by factoring the time
component into the newly acquired data. To begin, a linear regression of
deseasonalized values and time component was ran as well as an ANOVA test, that
35You can also read


