The Impact of the Coronavirus Pandemic on New York City
←
→
Page content transcription
If your browser does not render page correctly, please read the page content below
The Impact of the Coronavirus Pandemic on New York City
 Real Estate: First Evidence
 Jeffrey P. Cohen∗ Felix L. Friedt† Jackson P. Lautier‡
 University of Connecticut Macalester College University of Connecticut

Abstract: Concerns about the lingering novel Coronavirus may have led to long-term structural change
in desired dwelling locations in some large U.S. cities, such as New York City. Densely concentrated
neighborhoods may be at higher risk of virus contagion, giving more individuals incentives to move out.
We investigate whether this pandemic-induced disamenity adversely affected real estate prices of one- or
two-family owner-occupied properties across New York City. First, OLS hedonic results indicate that
greater COVID case numbers are concentrated in neighborhoods with lower-valued properties. Second,
we use a repeat-sales approach for the period 2003 to 2020, and we find that both the fear of contagion
and pandemic-induced income effects adversely impacted home sale prices. Estimates suggest sale prices
fell by roughly $60,000 or around 8% in response to both of the following: 1,000 additional infections per
100,000 residents; and a 10-percentage point increase in unemployment in a given MODZCTA. These
price effects were more pronounced during the second wave of infections. Based on cumulative
MODZCTA infection rates through 2020, the estimated COVID-19 price discount ranged from
approximately 1% to 50% in the most affected neighborhoods, and averaged 14%. Interestingly, the fear
of contagion effect intensified in the more affluent, but less densely populated NYC neighborhoods, while
the income effect was more pronounced in the most densely populated neighborhoods with more rental
properties and greater population shares of foreign-born residents. This disparity implies the pandemic
led to inequality between homeowners in lower-priced and higher-priced neighborhoods.

Keywords: COVID-19, Hedonic, Repeat Sales, Price Discount, Housing Wealth Inequality
JEL Codes: R31

 ∗ Jeffrey P. Cohen, Kinnard Scholar in Real Estate and Professor of Finance, Department of Finance and Center for Real Estate
and Urban Economic Studies, School of Business, University of Connecticut, 2100 Hillside Rd, Storrs, CT 06269;
jeffrey.cohen@business.uconn.edu
 † Felix L. Friedt, Assistant Professor of Economics, Department of Economics, Macalester College, 1600 Grand Avenue, Saint
Paul, MN 55105; ffriedt@macalester.edu.
 ‡ Jackson Lautier, Department of Statistics, University of Connecticut, Philip E. Austin Building, 215 Glenbrook Road, Storrs,
CT 06269-4120, jackson.lautier@uconn.edu.

 Acknowledgements: Jeffrey Cohen’s work on this paper was completed in part while he has been a Research Fellow at the
Institute for Economic Equity, Federal Reserve Bank of St. Louis. Jackson Lautier’s efforts on this paper were based upon work
supported in part by the National Science Foundation Graduate Research Fellowship under Grant No. DHE 1747453. The authors
would also like to thank Jason Barr for his helpful suggestions on the availability of related New York City datasets. The views
expressed in this paper are those of the authors and do not necessarily represent the Federal Reserve Bank of St. Louis, the Federal
Reserve Board, or the Federal Reserve System.

 1
1 Introduction
The novel Coronavirus has completely transformed life as previously known throughout the world, and

the impacts on U.S. residential real estate markets is unprecedented. The U.S. has seen one of the highest
per-capita death rates among virtually any other country. In the early months of 2020 during the pandemic,

New York City experienced a disproportionate intensity of cases and deaths, relative to the rest of the

United States, partly due to the relatively high density in many parts of the City. As the pandemic
worsened between March 1, 2020 to July 31, 2020 (which we refer to as the first wave) and again surged

between August 1, 2020 through December 31, 2020 (described herein as the second wave), vast numbers
of New York City residents chose to flee the city for the suburbs, where more spacious residences and

automobile-dependent towns were appealing due to their relatively insulated way of life. Although this

major shift is still unfolding to some degree, it leads one to wonder how the novel Coronavirus is
impacting residential real estate prices in New York City. An abundance of detailed New York City

COVID-19 case data with relatively precise locations of these cases within the City, lends to the ability

to examine the strength of the relationship between the novel Coronavirus and residential real estate prices

in the five boroughs. It also raises the question of whether homes in the City that are already located on

larger lots of land (i.e., much higher priced) may not be impacted in the same ways as homes that are

much closer together in some of the lower-priced neighborhoods of the City. These are the issues that we

study in this paper.

 As the world is still reeling from subsequent waves of the virus, the impacts on real estate markets are

an ongoing issue and the nascent literature in this area is still developing. The limited existing research
on residential real estate includes analyses of U.S. house price responses to shutdowns and re-openings

related to COVID-19, along with aggregate U.S. market impacts from COVID-19.

 One of the few known existing U.S. studies is D’Lima et al. (2020), who consider the effect of closures
and re-openings. Employing a difference-in-differences identification strategy, the authors assess the

impacts of COVID-19 on residential real estate prices throughout the United States. Their approach

follows the commonly used hedonic house price methods, which assume that the demand for housing can
be broken out into an array of property characteristics (Rosen, 1974), such as numbers of bedrooms,

bathrooms, square footage, acreage, etc., and amenities and/or disamenities (Banzhaf and McCormick,
2012). Then linear regression estimation of this hedonic price equation, where the natural logarithm of

house price is the dependent variable, can yield elasticities of house prices with respect to the

 2
amenities/disamenities. D’Lima et al. (2020) include an indicator in their hedonic model for whether or

not each property sale at time t was in a state that had shut down at time t, and a separate indicator for
whether a property that sold at time t was in a state that had reopened at time t. These authors control for

zip-code fixed-effects and cluster at the zip code level. Their findings include that the shutdowns had a
statistically insignificant negative effect on prices, while reopening had a statistically significant negative

effect (with elasticity of approximately 0.9). They argue that not all restrictions were immediately lifted

upon reopening, which led to the negative effect of reopening.

 Zhao (2020) studies aggregate and micro (zip code level) effects of COVID-19 on U.S. housing

markets. Aggregate level findings include that prices have risen much faster than they did in the months

prior to the Global Financial Crisis; and there has been a structural break in housing demand after
mortgage rates have fallen post-March 2020. Zhao (2020) also notes on the micro-level that individuals

on the lowest and highest levels of the income distribution have demonstrated the greatest increases in

housing demand. Finally, they note that changes in demand in cities are comparable to changes in demand

in suburbs and rural areas.

 Studies of the real estate market impacts of COVID-19 outside the U.S. are sparse. While Francke and

Korevaar (2020), for example, examine how historical pandemics impact house prices in Amsterdam,

they do not specifically consider COVID-19. Rather, they focus on other past pandemics. They find that

there is a significantly negative effect within 6 months after a pandemic, but this discount is only

temporary. This transitory finding potentially bodes well for the impacts of COVID-19 in many cities
throughout the world. In another recent study beyond the U.S. context, the impact of deaths from COVID-

19 on Chinese housing markets is the focus of Chong and Liu (2020). Their finding is that months with

the fewest numbers of deaths experienced the lowest house price changes in response to more deaths. This

relationship is reversed in months with larger numbers of deaths. The authors refer to this phenomenon

as a “U-shaped” effect.

 This review of the brief literature on residential real estate and COVID-19 indicates gaps that deserve

further examination. For instance, a micro analysis of one particular city, and how local rates of COVID-

19 cases impact house prices in the very short term, could yield some poignant evidence of any potential
relationships. New York City is an excellent laboratory for this type of analysis, given the heterogeneity

across its 5 boroughs and many hospitals in the city. Another desirable feature of our New York City

focus is the recent exodus of residents to the suburbs, in order to evade potential future waves of the

 3
pandemic. By focusing on a specific ‘big-city’ real estate market and estimating the response to the

intensity of the outbreak (i.e., cumulative case numbers) rather than shut downs, we are able to assess a
tremendous degree of heterogeneity. That is, all of New York was shut down for some time, and yet still

there were differences in how the market reacts across boroughs and/or modified zip codes (MODZCTAs)
due to variation in actual COVID-19 intensities and pandemic-induced surges in unemployment rates.

 We have two separate prongs to our approach to estimate what we call the fear of contagion1 and

income effects on NYC real estate markets. The first is a classic hedonic housing price model for New

York City (NYC) non-investor-owned one- or two-family house sales, where the dependent variable is

house price at time t; we include control variables for the cumulative number of novel Coronavirus

infections per 100,000 residents within the local MODZCTA, at time t (CCit); as well as local MODZCTA
unemployment rates (Uit). Across neighborhoods, we find a negative relationship between house prices

and CCit as well as Uit , suggesting that NYC neighborhoods with more intense COVID-19 outbreaks and

greater rates of unemployment experienced sale price discounts. While these correlations are insightful,

they may not reveal the causal impact of COVID-19 on NYC property prices. One potential issue may be

changes to the neighborhood-specific composition of sold properties along some unobservable home

attribute. One possible scenario supported by some anecdotal evidence (Goodman and Rashbaum, 2020;

Haynes, 2020) is, for example, an exodus of the more affluent residents, such that COVID-19 triggers the

sale of more valuable properties within NYC neighborhoods. As a result of this compositional shift, the

observed average sale price in a given neighborhood would rise and offset the otherwise adverse impact

of the pandemic on the value of all properties - sold and unsold.

 In the second approach, we attempt to reconcile these initial findings of the underlying relationship by

restricting ourselves to transactions of repeat-sales properties between 2003 and 2020. We differentiate

the effects across the first and second waves of infections in 2020 and estimate a differenced model, where

the difference in prices (between repeat sales) is regressed against the difference in cumulative case rates,

changes in local unemployment, variations in investor ownership shares as well as fixed effects. This

approach identifies the COVID-19 price effect by estimating the average change in sale prices at the

property level and is therefore immune to the potential pandemic-induced compositional changes of real

 1
 We make the assumption that information on detailed location COVID-19 intensity was widely available, particularly for New
York City residents. One example is the “New York City Coronavirus Case Count” interactive web hub made freely available by
the New York Times and updated through May 21, 2021. See https://www.nytimes.com/interactive/2020/nyregion/new-york-city-
coronavirus-cases.html.

 4
estate markets at the neighborhood level. We difference out time-invariant observable and unobservable

home and neighborhood characteristics, such as whether a home is a high- or low-valued property in a
low- or high-valued neighborhood, while controlling for changing local labor market (unemployment)

and real estate conditions. We also include an indicator for whether there have been
modifications/renovations to the property. Including differences of the unemployment variable and a

renovations indicator addresses a common critique of the repeat-sales approach. We find that the

coefficient on the change in cumulative infection rates is negative and statistically significant in the repeat-
sales models. In other words, as there are more cases per resident over time, this adversely affects house

prices. This fear of contagion effect on prices is more pronounced during the second wave of infections,

when for every 1,000 additional COVID-19 infections per 100,000 residents in a given MODZCTA the
value of a one- or two-family NYC home is found to decline by over $60,000 between two sales of the

same property, on average. Our heterogeneity analysis suggests that more affluent home buyers are more

risk averse with respect to rising case rates, while residents in already densely populated neighborhoods
exhibit less fear of contagion – or perhaps cannot afford to.

 In terms of the income effect, we find that a rise in unemployment rates significantly reduces home

sale prices for repeat sales properties. Again, this is particularly apparent during the second wave of the

pandemic. In comparison to pre-pandemic levels, NYC unemployment rates rose by more than 8

percentage points suggesting an average decline in home values of around $50,000. Based on the

heterogeneity analysis, it appears that, while home buyers in more densely populated neighborhoods with

greater dependence on public transit and higher rental shares are less sensitive to rising infection rates,

the income effect on home prices significantly intensifies in these types of neighborhoods.

 Interestingly, homes that sold for a price in the bottom quartile of the pre-COVID local price

distribution experienced a significantly higher price discount in response to higher cumulative cases

during the initial wave of the pandemic, but negligible price discount during the second half (or second

wave) of 2020. In contrast, homes valued in the top quartile of the pre-COVID local price distribution

experienced an intensifying price discount in response to rising cases.

 These findings may be due in part to the fact that in NYC, homes on the lower end of the price
distribution imply less wealth associated with homeownership relative to homes on the higher end of the

distribution. This may have reduced the flexibility of lower-priced homeowners to move to another house

in the suburbs more quickly during a time when the suburban housing market was very hot with cash

 5
offers among the winners and multiple bids over asking prices. Perhaps these market frictions - both in

NYC and in the suburbs - can be a source of explanation for the negligible price discount for lower-priced
NYC houses during the second wave, as higher priced homeowners in NYC were able to get out of their

NYC home and into a suburban house with more agility. The welfare implications of housing wealth
accruing disproportionately to owners of higher valued houses during the pandemic is startling. This

inequality arises through the mechanism of (i) lower valued properties tended to experience more COVID

cases, and (ii) we observe a negative effect of cases on house prices. But despite there being a much larger
impact of cases on prices for lower valued homes in the “first wave” of COVID in NYC, the “second

wave” of COVID in NYC is accompanied by an insignificant effect of cases on prices for lower-valued

homes. This may suggest that residents in lower-valued properties have come to treat pandemic risk as a
new neighborhood constant, like in areas of high-crime. In other words, this first wave effect was so

intense on lower-valued homes that residents perceived this as a permanent change so that future upticks

in cases were already priced-in to second wave market transactions.
 All-in-all, our findings highlight the powerful adverse effect COVID-19 has had on the NYC real

estate market through December, 2020. Over the span of just 10 months since the first reported cases,

COVID-19 infections and the associated rise in unemployment have reduced average house sale prices

by around 20% during the second wave of infections. In comparison to the expected pre-COVID home

value appreciation, the pandemic had eroded a value equivalent to a 5 to 6-year expected return on
residential property investment in just ten months. Moreover, these average effects are not equally

distributed across the NYC universe of one- or two-family homes, but concentrated among lower-valued

neighborhoods that experience greater rates of infections and face higher unemployment rates.

 The remainder of this paper proceeds as follows. In the next section, we provide some background on

NYC residential real estate and COVID-19. In section 3, we describe the empirical models that we

implement, followed by a detailed description of our data in section 4. We present the results of our

estimations in section 5, after which we provide some discussion and conclusions along with suggestions

for future work.

 6
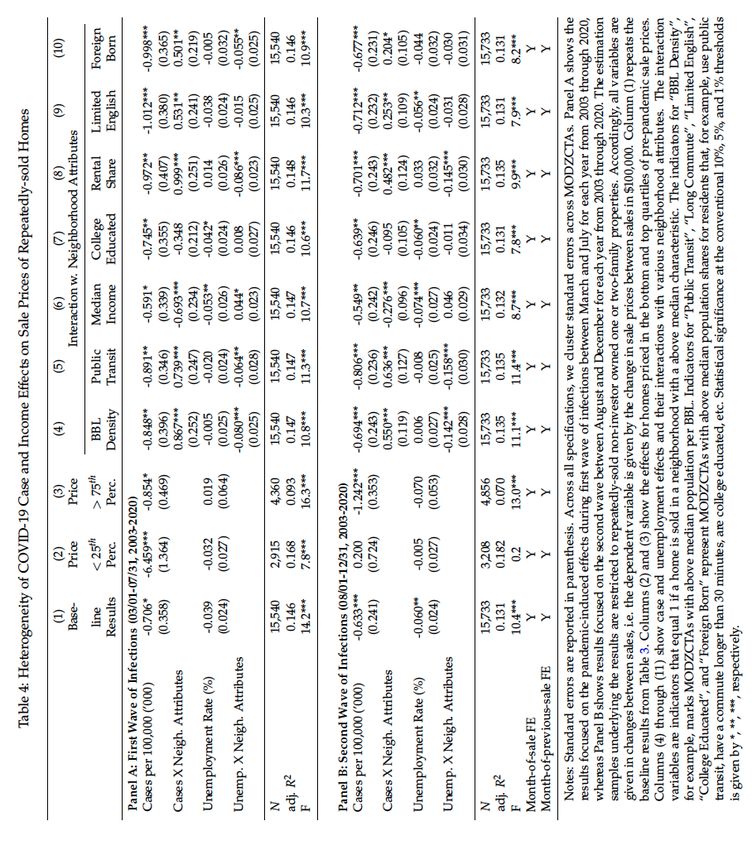
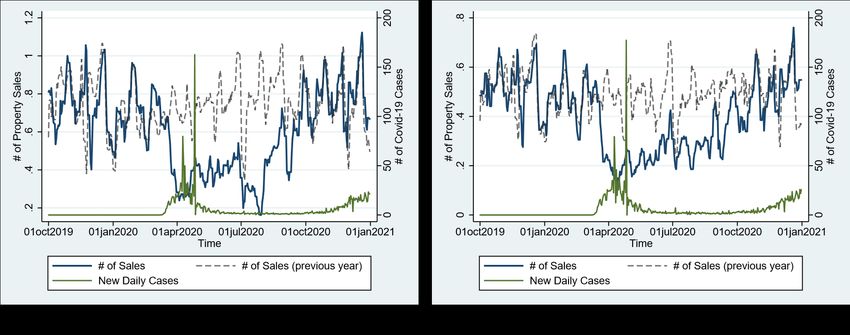
2 Background
It is a rare occurrence to see an Op-Ed in the New York Times by a certain famous New York-based

standup comedian and sitcom star defending the future of New York City (Seinfeld, 2020) against
hyperbolic claims that NYC is “dead forever” (Altucher, 2020). Then again, these are exceptional times.

Major news outlets have told a story of large-scale outbound migration from New York City due to

Coronavirus restrictions. Manhattan vacancy rates climbed to 14-year high levels (Haag, 2020b).
Conversely, surrounding suburbs have been struggling to absorb the demand of “fleeing” New Yorkers.

A home in East Orange, N.J., for example, was listed at $285,000, hosted 97 showings, received 21 offers,
and went under contract 21% over asking – all over a three-day period in July of 2020 (Haag, 2020a).

 Figures 1a through 1f provide a first look at the NYC housing market before and after the outbreak of

the novel Coronavirus and corroborate some of the anecdotal evidence reported in these recent news

articles. In each figure, we plot the number of daily new COVID-19 cases and 7-day moving average of

the number of daily property sales from October 1, 2019 to December 31, 2020 (solid blue and green

lines) and contrast the latter against the moving average number of daily real estate transactions in the

previous year (i.e., October 1, 2018 through December 31, 2019) (dashed grey line). Figure 1a presents

these data for all of NYC, whereas Figures 1b through 1f illustrate the real estate and pandemic dynamics

for each of the five NYC boroughs.

 Each of the six graphs clearly shows that the initial outbreak of the novel Coronavirus in NYC

coincides with notable disruption of the city’s real estate market. While daily sales across all property

types in the second half of 2019 and early 2020 tend to track the volume of transactions in the previous

year, the two series diverge starting in March 2020 as the first wave of cases are reported in NYC. In

aggregate, Figure 1a shows that the number of daily sales falls by around 50 transactions (≈-50%) per day

during the first few months of the COVID-19 outbreak in NYC and that this response not only persisted,
but actually worsened to around 80 lost sales per day through July 31, 2020. The Bronx, Brooklyn and

Queens, for example, showed an immediate 50% to 70% decline in the volume of the real estate market

one month after the outbreak relative to pre-pandemic data (see Figures 1b, 1c, and 1e). The initial
responses of the real estate markets in Manhattan and Staten Island were also negative, but appeared to

be more moderate and short-lived (see Figures 1d and 1f).

 While the decline in real estate market volume was sharp, the data for the second half of 2020 illustrate

that initial claims may have been exaggerated. The number of property sales steadily recovered between

 7
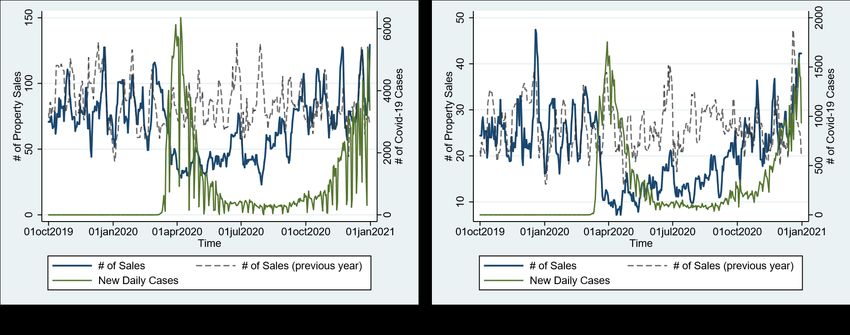
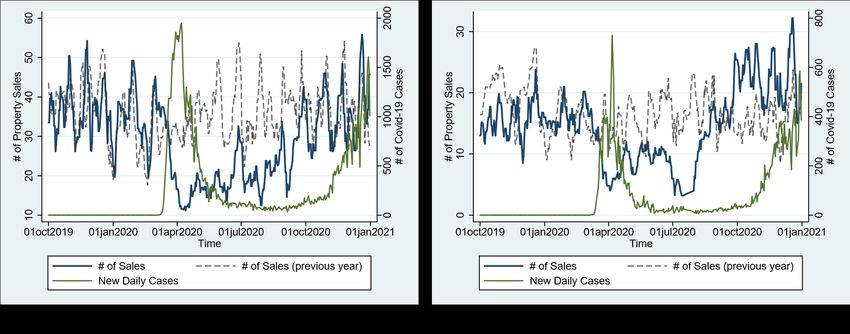
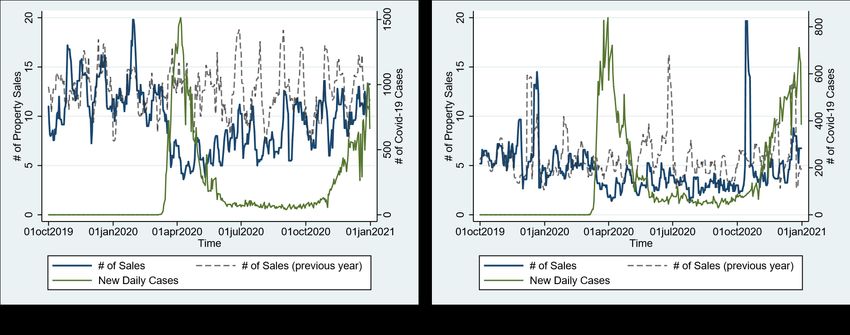
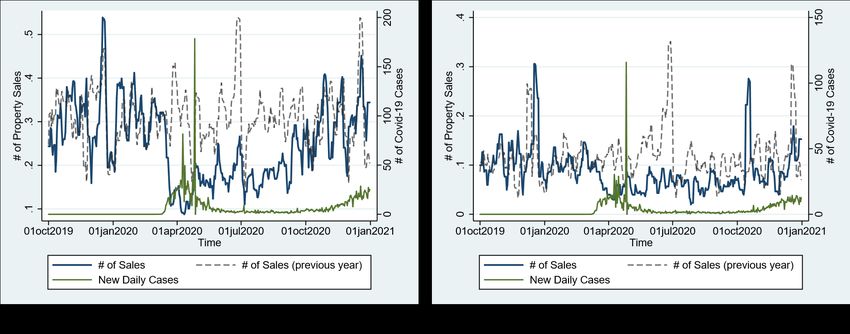
July and December of 2020. Staten Island shows the most rapid recovery among all of the five NYC

boroughs (Figure 1f). In aggregate, the NYC real estate market seems to have recovered in terms of
volume by October 2020. Interestingly, each of the Figures illustrates that the onset of the second wave

of infections in late 2020 does not appear to have the same adverse effects as the initial outbreak.

 Using the detailed information on real estate transactions and spatially disaggregated data on the

number of new COVID-19 infections, we also show these patterns at the MODZCTA level. Specifically,

we calculate average daily infections and the average number of real estate transactions for MODZCTAs

across the distribution of average pre-pandemic (i.e., 2003-2019) house sale prices. Figures 2a through 2d

illustrate the changes for the average MODZCTAs in each quartile of the pre-pandemic home value

distribution.

 For MODZCTAs with average sale prices below the 75th percentile the patterns are similar including

a sizable collapse in real estate transactions in March and April 2020 and a prolonged recovery through

roughly September or October 2020. Within these MODZCTAs, daily infections start to rise around the

same time and peak at approximately the same levels (i.e., around 80 new cases per MODZCTA on April

9th and approximately 170-180 new cases per MODZCTA on April 26th). In contrast, the average

MODZCTA in the top quartile of the pre-pandemic house sale price distribution seems to experience a

more moderate disruption of the local real estate market and is subject to a less intense outbreak (i.e.,

around 30 new cases per MODZCTA on April 9thh and 115 new cases per MODZCTA on April 26th).2

Finally, we note that, irrespective of the level of spatial disaggregation, pre-pandemic sales patterns are
similar. That is, the volumes of real estate transactions before the onset of the initial COVID-19 outbreak

in late 2019 (October-December) and early 2020 (January-February) are on similar trajectories compared

to the number of transactions late 2018 and early 2019. The initial collapse clearly coincides with the rise
of infections among NYC residents and does not predate the pandemic. This appears to be true in

aggregate (Figure 1a), across boroughs (Figures 1b-1f) as well as MODZCTAs with high to low value

properties (Figures 2a-2d).

 2
 There are a few possible explanations for these patterns. For example, wealthier individuals may have the financial means to
better isolate themselves, which reduces the risk of infection. Moreover, housing wealth may be disproportionately held among
older residents who face greater COVID infection risks and are therefore reducing the exposure to potential infections. It is also
possible, however, that the likelihood of getting tested inversely correlates with housing wealth.

 8
Figure 1: New York City Daily Case Counts and Avg. # of House Sales by Borough

 9
3 Model
To evaluate the impact of the COVID-19 pandemic on the NYC real estate market more formally, we first

estimate the impact of novel Coronavirus infections on NYC property sale prices using the hedonic model

popularized by Rosen (1974)3 and used in many economic studies on real estate markets.4 We are able to

estimate the pandemic effects on the full sample of non-investor-owned one and two-family property

transactions as well as the more restrictive repeat-sales sample. To begin, we derive the traditional hedonic
model to evaluate the price effect of the COVID-19 pandemic on NYC homes. The classical hedonic

model of Rosen (1974) has more recently been extended to incorporate amenities and disamenities. This

hedonic model can be written, in general form, as follows:

 &' = ( & , ). (1)

In Equation (1), property prices are assumed to be a function of property characteristics, Hi, and
amenities/disamenities (AD). Best practices for incorporating amenities/disamenities into hedonic models

are described by (Bishop et al., 2020). In our specific application, the purpose of the hedonic model is to

determine how various characteristics of the property and neighborhood demographics, as well as

particular disamenities of interest (i.e., the rise in novel Coronavirus cases and associated rise in

unemployment) affect property sale prices. Conceptually, the pandemic can influence the demand for

homes through two primary channels including: 1) the adverse effects on income; and 2) the increased

fear of contagion in a densely populated city, such as NYC. We attempt to capture and differentiate these
two mechanisms integrating COVID-19 case rates and local unemployment rates into the hedonic

framework. By controlling for the demographics and characteristics with regression analysis, it is possible

to estimate how additional infections and higher unemployment influence property sale prices. Therefore,

our hedonic model takes the following form:

 P!" = β# + β$ CC%" + γH! + φE%" + ωN%" + α% + α" + ε!" , (2)

 3
 Rosen (1974) popularized the study by Kain and Quigley (1970).
 4
 For a review of this literature see, for example, Chau and Chin (2003), while an example of a specific application to another
dis-amenity - aircraft noise pollution - is given by Cohen and Coughlin (2008).

 10
Figure 2: NYC Daily Case Counts and Avg. # of House Sales by Avg. MODZCTA Sale Prices

where Pit represents the vector of sale prices of properties i = 1, 2, .., N at time t, β0 is an intercept term

and Hi represents a matrix of time-invariant property characteristics, such as the year a home was built, its

square footage, and number of floors, among others.5 Nbt represents neighborhood attributes, e.g., the
share of investor-owned properties at time t in the MODZCTA b where property i is located. The main

variables of interest intended to capture the pandemic-induced fear of contagion and income effects on

 5
 While the PLUTOTM dataset contains a number property characteristics, it does not report all of the desirable home attributes,
such the number of bedrooms and number of bathrooms.

 11
home sale prices are, respectively, given by CCbt and Ebt. While Ebt represents economic factors, e.g.,

unemployment at time t in the MODZCTA b where property i is located, CCbt represents the cumulative
local Coronavirus infections per resident measuring the severity of a property’s exposure to local cases in

neighborhood b at the time of sale. Neighborhood characteristics that are constant over time, such as
distance to the nearest airport, are captured by a neighborhood fixed effects αb. Finally, αt represents a

matrix of time-of-sale fixed effects to capture citywide differences over time, such as overall general

appreciation in property values, and ε&' is an error term that is i.i.d. with mean zero and constant variance,

along with zero co-variance across observations i, where i = 1, 2, .., N, and N is the number of houses in

the sample. One of the coefficients of interest is given by β1 and measures the average change in house

sale prices in response to a rise in cumulative local Coronavirus infections conditional on the other control

variables, all else equal. The other coefficient of primary interest is given by φ and measures the change

in sale price per a one-unit change in neighborhood-level unemployment, ceteris paribus.

 The primary issue with this specification is that unobservable home and/or neighborhood

characteristics of sold properties may correlate with the intensity of the local COVID-19 outbreak and

bias our coefficient estimate of interest. If, for example, more affluent homeowners in any given

neighborhood flee the City to avoid the pandemic, the neighborhood-specific composition of sold homes

changes with the pandemic and potentially undermines our COVID-19 price effect estimate. Taking

advantage of the repeat-sales sample, we can control for time-invariant observable and unobservable home

and neighborhood characteristics by taking the first difference of Equation (2) between the initial and

repeat sales. The basic repeat-sales approach was originally developed and popularized by Bailey et al.

(1963) and popularized more broadly by Case and Shiller (1987). Since not all home and neighborhood

characteristics are observable, this approach reduces the risk of omitted variable bias and inconsistent

estimates (Chau and Chin, 2003) and can help to identify the COVID-19 price effect at the property rather

than neighborhood level. As a result, the repeat-sales sample estimate is no longer sensitive to the
composition of homes sold within a given neighborhood and much less prone to be biased.6

 Specifically, suppose the second sale of a property occurs in time period t + τ. This is a slightly varied

version of equation (1), which is written as follows:

 6
 Of course, even the repeat-sales estimator is subject to a few concerns, such as changes in property attributes over time. We
conduct a host of robustness analysis to scrutinize our repeat-sales identification strategy. The results of these sensitivity tests are
presented and discussed in Section 5.3 (see Table 5) and produce consistent estimates that lend support to our identification
strategy.

 12
P!,")* = β# + β$ CC%,")* + γH! + φE%,")* + ωN%,")* + α% + α")* + ε!,")* . (3)

Taking the first difference (∆) of Equation (2) and (3) for two separate sale dates for property i, which is

sold at both time t + τ and time t (where t represents the initial sale and t + τ represents the subsequent

sale), yields:

 Δ !(#,#%&) = ( Δ )(#,#%&) + Δ )(#,#%&) + Δ )(#,#%&) + ∆ (#,#%&) + Δ (!#,#%&) . (4)

The time-invariant characteristics of house i, Hi, and neighborhood b, αb, drop out of (4) when taking the

first difference of Equations (2) and (3). Furthermore, time-of-home-sale and repeat-sale fixed effects (αt

and αt+τ) control not only for the specific timing of each sale of a given house, but also the difference in

the time elapsed between the two sales. That is, we would expect there to be a pandemic-unrelated

difference in home value appreciation between a house sold 10 years ago and one sold 2 years ago.

Similarly, we expect there to be a difference in the change in property prices for a home that was sold in

2010 and 2018 versus a home that was sold in 2012 and 2020. Our fixed effects capture the timing of both

sales as well as the duration of time that has passed between repeat sales and therefore control for both of

these potentially confounding factors.

 The coefficients of interest are still given by β1 and φ, but the interpretations change slightly. Given

the specification in first differences, β1 and φ respectively quantify the average discount or premium on

the change in sale prices of repeat-sales homes corresponding to a one-unit rise in novel Coronavirus

infection and unemployment rates near a given property. A priori, we expect the severity of the pandemic

to be a significant disamenity – both in terms of fear of contagion and an adverse income shock – to home

buyers that leads to a decline in average sale prices (or smaller home value appreciation between sales)

in neighborhoods with rising Coronavirus infections and greater unemployment (β1 < 0 and φ < 0).

 Finally, we acknowledge the potential market segmentation across unobservable determinants (Adair

et al., 1996; Fletcher et al., 2000) and expand our empirical analyses by investigating whether the COVID-

19 outbreak has heterogeneous price effects across the top and bottom quartiles of potential home values

and specific neighborhood attributes. We also present a set of robustness checks for the hedonic repeat

sales analyses in Section 5.

 13
4 Data
To estimate the COVID-19 impact on NYC property sale prices and the number of transactions, we

construct a novel dataset that combines the relevant information from multiple sources. The housing data,
for example, was created through two publicly available resources from NYC government agencies. The

first is the Primary Land Use Tax Lot Output (PLUTOTM) database maintained by the NYC’s Department

of City Planning. 7 The PLUTO file contains detailed information on property characteristics by
individualized tax lot. The second dataset entails information on the timing and price of every NYC

property sale and is publicly available through the NYC’s Department of Finance.8 The two files share a
unique identifier field in borough-block-lot (BBL) and may be merged once compiled. 9 Notably, the

housing data includes both residential and commercial properties, the majority of which are reported sales

of one- or two-family homes, which are the focus of our analyses. The combined housing records span
from January, 2003 through December, 2020. Other recent research on New York City property values

has relied on the PLUTO dataset, including among others, Cohen et al. (2021).

 In an attempt to isolate market arms-length transactions and minimize potential data errors, we employ

a number of standard adjustments to these housing data. First, we remove all transactions with a sale price

below $10,000. Next, we exclude all records with zero buildings, zero floors, zero total units, zero lot

depth or zero square footage. In the event a property’s designated land use changed during our sample or
a sale was classified as a residential transaction, but the property has no residential units, it was removed.

All records with a year built or year altered before 1800 were removed. We further exclude all

observations pertaining to multiple sales of the same property on the same day.10

 Finally, given that some single-family and two-family residential properties in NYC are rentals, we

develop estimates of non-investor-owned properties. This is accomplished by following a methodology
similar to that of Cohen and Harding (2020), where flags in the owner name field are used to filter out

likely investor-owned properties. For instance, if the owner name for a property contains one of the terms

“LLC”, “CO”, “INC”, “DBA”, among others, the owner is flagged as an investor. These flagged

 7
 https://www1.nyc.gov/site/planning/data-maps/open-data/dwn-pluto-mappluto.page
 8
 https://www1.nyc.gov/site/finance/taxes/property-rolling-sales-data.page
 9
 Variations of these data have been used in the past (see, for example, Barr and Cohen (2014)).
 10
 For some transactions these duplicate records may be plausible, perhaps indicating the simultaneous sale of multiple
apartments or condominiums. For our sample of one- or two-family homes, however, these duplicate records cannot be easily
reconciled. We error on the side of caution and exclude these observations, but note that our results are not sensitive to this (or any
of the other) sample restrictions.

 14
observations are excluded from the estimation samples. Moreover, we utilize this investor variable to

determine the annual share of investor-owned properties among the stock of all properties within each
MODZCTA. One potential concern is that the eviction moratorium, placing limitations on landlords

evicting non-paying tenants, may disproportionately affect home values in neighborhoods with high rates
of rental shares. If rental shares correlate with local case counts estimates may be biased. Controlling for

the share of investor-owned properties alleviates this concern.

 Table 1: NYC Borough One- and Two-Family Housing Market and Pandemic Summary Statistics

 (1) (2) (3) (4) (5) (6) (7) (8) (9) (10)
 Before Outbreak After Pandemic Outbreak
 (03/01-12/31/2019) (03/01-12/31/2020)

 Borough Total Avg. Sale Unemp. Total Avg. Sale Unemp. Total Total Max. Max.
 # of Price Rate # of Price Rate # of # of Case Death
 Sales ($ ’000) (%) Sales ($ ’000) (%) Cases Deaths Rate Rate
 Brooklyn 2,956 1,035.5 3.9 2,244 1,074.4 13.6 114,907 6,094 4,488.7 238.1
 Bronx 1,345 567.0 5.1 1,049 598.0 17.3 80,347 4,175 5,654.2 293.8
 Manhattan 65 3,228.3 4.0 53 4,521.8 12.9 55,104 2,673 3,419.6 165.9
 Queens 5,637 738.0 3.3 4,095 761.1 13.4 116,779 6,323 5,148.2 278.8
 Staten Island 3,049 595.7 3.7 2,506 617.3 11.3 32,589 1,102 6,844.4 231.4
 NYC Average - 766.9 3.7 - 798.4 14.7 - - - -
 NYC Total 13,052 - - 9,947 - - 399,726 20,367 - -
 Notes: Data on the number of one- and two-family property transactions and average sale prices are published by
 the NYC Department of Finance. Information on NYC borough unemployment rates are published by the Federal
 Reserve. Statistics on COVID-19 cases and deaths are publicly available from NYC Department of Health and
 reported on a daily frequency starting February 29, 2020. Based on our sample, we define the post outbreak
 period from March 1, 2020 until the end of our sample December 31, 2020. For the purposes of comparison, we
 calculate preoutbreak statistics on the number of sales and average property prices based on limited sample
 restricted to March 1 to December 31, 2019.

 In aggregate, this leaves 306,508 total NYC property transactions of 269,478 one- or two-family

homes between January, 2003 and July, 2020. Of these, we observe 9,947 sales during the COVID-19

period from March to December 2020 (see Table 1). In terms of repeat-sales homes, the data show a total

of 73,568 non-investor transactions for 37,196 unique one- or two-family NYC properties since January,

2003. Of these, we observe 921 sales during the first year of the pandemic from March to December,

2020.

 To provide initial evidence of the likely pandemic impact on the NYC real estate market, we compare
year-over-year changes in average sale prices and the number of transactions before and after the initial

 15
COVID-19 outbreak between March 1 and December 31, 2019 relative to 2020 (see columns (1) through

(4) of Table 1). Taking the difference between columns (1) and (3) of Table 1, for example, shows that
the total number of transactions of NYC one- and two-family homes decreases by 3,105 year-over-year

and that this 24% reduction in the frequency of sales after the outbreak is not driven by a single borough,
but the combined result of a notable housing market collapse in each of the five districts. Across NYC

boroughs, the number of sales declined anywhere from 12 (Manhattan) to 1,542 (Queens) or 18% (Staten

Island and Manhattan) to 27% (Queens) in relative terms.

 Interestingly, the change in average sale prices does not reflect this pattern. In aggregate, the average

property sale price from March 1 to December 31 rose by 4% from $766,900 to nearly $800,000. The

increase in sale prices is consistent across all five boroughs (compare columns (2) and (4) of Table 1) and
ranges from 3.1% in Queens to 40% in Manhattan.

 To investigate whether these adjustments in the number of real estate transactions and sale prices

correlate with the local rise of the COVID-19 infections and the contemporaneous rise in unemployment,

we combine these housing data with spatially disaggregated information on the NYC outbreak of the

novel Coronavirus as well as unemployment rates. With respect to local unemployment rates we rely on

two sources. The first is unemployment data generated by The DEEP-MAPS Project11. The DEEP-MAPS

model combines information from the Current Population Survey (CPS) and the Local Area

Unemployment Statistics (LAUS) data sources to produce a complete national database of inferred labor

force participation at the census-tract level. The DEEP-MAPS data is available at a monthly frequency
for the calendar year 2020.

 The second source provides monthly pre-pandemic unemployment statistics through February 2020

at the borough level. These unemployment rates are published by the U.S. Bureau of Labor Statistics
retrieved from the Federal Reserve Bank of St. Louis (FRED). We use the overlap in census tract and

borough-level data from January and February, 2020 to backcast local unemployment rates based on the

available borough data. Our results are robust to this extrapolation and using borough-level unemployment

statistics instead.

 Table 1 shows that the average borough-level pre-pandemic unemployment rate from March through
December 2019 ranged from 3.3% in Queens to 5.1% in the Bronx and averaged 3.7% for all of NYC

 11
 The Demographic Estimates of Employment Participation, with Multistage Adjustment and Poststratification Synthetics
(DEEPMAPS) model of the labor force projects labor force statistics to small subgroups of the population. For additional
information, please see (Ghitza and Steitz, 2020). Source: https://www.deepmaps.io/data

 16
(see column (3)). One year later, NYC unemployment rates rose more than threefold during the first and

second wave of the pandemic. Column (6) of Table 1 shows average unemployment rates ranging from
11.3% in Staten Island to 17.3% in the Bronx; with an New York City average of 14.7%.

 With respect to pandemic-related data, the NYC Department of Health publishes the number of
positive tests for COVID-19, the number hospitalized COVID-19 patients, and the number of COVID-19

related deaths as well as their respective rates per 100,000 residents on a daily basis. The earliest reporting

dates back to February 29, 2020 and provides these statistics at the NYC borough level differentiating,

for example, between Brooklyn and Manhattan case counts and rates. Starting on April 3, 2020, the NYC

Department of Health began to publish pandemic statistics on the total number of tests and positive test

results at the more disaggregated modified zip code (MODZCTA) level. By May 18, 2020, the agency
augmented these data with information on death counts and death rates per 100,000 MODZCTA residents.

We use the overlap in MODZCTA- and borough-level data from April 3 through December 31, 2020 to

backcast case counts at the MODZCTA level through March 1, 2020 based on the available borough

counts.12 Our results are robust to this extrapolation.

 In total, there are 176 MODZCTA’s scattered throughout the five NYC boroughs including the Bronx,

Brooklyn, Manhattan, Queens, and Staten Island. We build a MODZCTA-to-BBL concordance and match

each of the sold properties to its corresponding MODZCTA and borough. In addition to the

aforementioned real estate statistics, Table 1 also summarizes pandemic information at the borough level

(see columns (7) through (10)). Column (7) indicates that nearly 400,000 people residing in NYC
contracted the Coronavirus by December 31, 2020, most of whom live in the Bronx, Brooklyn, and

Queens. Of these individuals who tested positive over 20,000 died in NYC. Brooklyn and Queens lead

these statistics with over 6,000 infected individuals who perished (see column (8)). These aggregate

pandemic statistics are notably lower for Manhattan and Staten Island than those observed in Brooklyn

and Queens. Staten Island, for example, appears much less severely affected, often reporting case and

death counts four to five times lower than those observed in the other boroughs. This distinction, however,

becomes less obvious when taking borough-level population into account. Considering case and death

rates per 100,000 borough residents, all boroughs experience the COVID-19 outbreak with similar
severity by December 31, 2020 (see columns (9) and (10) of Table 1).

 12
 Specifically, we calculate the MODZCTA share in total borough cases when both case counts are available and use these
shares to predict MODZCTA case counts from March 1 through April 3, 2020, when only borough-level data are available.

 17
While Table 1 provides important first insights into the potential pandemic effects on housing markets

across the five boroughs, the aggregated statistics through December 2020 mask a few interesting facts.
Table 2 offers a more detailed picture of the likely pandemic-induced changes in the NYC real estate

market. Specifically, we present pre- and post-pandemic sample averages in sale prices, sale volumes,
unemployment rates, property attributes, and neighborhood characteristics during the first wave of

COVID-19 infections through July 31, 2020 (Panel A of Table 2) and those observed during the onset of

the second wave of infections through December 31, 2020 (Panel B of Table 2). We test for differences
in these means and differentiate the characteristics for the sub-sample of repeat-sales properties (columns

(6) through (10)).

 MODZCTA neighborhood characteristics are based on the 2019 American Community Survey (ACS)
published by the U.S. Census Bureau. The reported pre- and post-pandemic averages represent the average

characteristics associated with the observed property sales and vary with the composition of sales through

time. Therefore, the reduction in sample average neighborhood density per unit during the second wave

of infections (see columns (5) and (10) of Panel B of Table 2), for example, should not be interpreted as

a change in population density in NYC between 2019 and 2020, but instead should be interpreted as a

change in the location of a typical property sale towards less (pre-pandemic) densely populated

neighborhoods in NYC.

 The statistics reported in Table 2 reveal several interesting patterns. First, the pre- to post-pandemic

dynamics of the NYC real estate market are distinctly different during the first wave of the novel
coronavirus outbreak relative to its second wave. Excluding repeat sales properties, Table 2, for example,

shows that the change in average sale prices is negligible during the first wave of the pandemic, but

positive and statistically significant during the second wave of infections, albeit the average characteristics

of these homes do not seem to change relative to pre-pandemic levels. Table 2 also demonstrates that the

average rise in local unemployment rates (relative to pre-pandemic levels) is less pronounced during the

second wave of infections. This partial recovery in unemployment rates correlates with a positive change

in the volume of real estate transactions. While the market experiences a significant drop in the volume

of sales during the first wave of the COVID-19 outbreak (irrespective of neighborhood characteristics),
the number of real estate transactions per MODZCTA notably recovers during the latter half of 2020.

Moreover, this recovery in property sales appears correlated with certain neighborhood attributes. Table

2 shows that during the second wave of the pandemic a disproportionate number of sales occurs in higher-

 18
income neighborhoods with more white and college-educated residents. Furthermore, recovery seems to

be driven by sales in less densely populated neighborhoods with fewer rental units.

 The second interesting pattern revealed by Table 2 pertains to differences across one-time sales

(columns (1) through (5)) and repeat-sales properties (columns (6) through (10)). Although there are
significantly fewer transactions of repeat-sales properties, the changes in property characteristics for

repeat-sales homes tend to be very similar to those observed for homes that are sold only once over the

sample duration. That is, the transactions of both one-time sales and repeat-sales properties experience a

significant reduction in the volume of sales and face significantly higher local unemployment rates during

the first wave of infections. Other property and location characteristics appear to remain stable during the

first wave of the pandemic, irrespective of whether it is the first or a repeat transaction of a given property.
The same tends to be true during the second wave of infections, where we note significant changes in

location characteristics and show that these differences are similar for one-time and repeat-sales homes.

 An exception to these similarities between one-time and repeat-sales homes is the average change in

sale prices during the first wave of infections. While properties with a single reported sale show no

statistically significant change in sale prices between the first half of 2019 and the first half of 2020, the

average sale price of repeat-sales properties is shown to rise significantly in early 2020 relative to pre-

pandemic levels.

 To take a closer look at the spatial patterns of the pandemic, we map MODZCTA COVID-19

cumulative case rates as of July 31, 2020, towards the end of the first wave of infections, as well as
December 12, 2020, in the midst of the second wave of infections. Figures 3a through 3b reiterate our

initial observations. First, the severity of the outbreak is greater in the Bronx, Queens, and Staten Island

where the majority of MODZCTAs report cumulative case rates above the 50th percentile of the NYC
COVID-19 case rate distribution. In contrast, many of Manhattan’s MODZCTAs experience cumulative

cases rates at or below the 25th percentile irrespective of first or second wave. That being said, Figures 3a

through 3b also show that the virus had spread far throughout NYC with a minimum MODZCTA case

rate of 663 as of July 31, 2020 and a minimum of 1,637 cases per 100,000 residents as of December 31,

2020.

 Second, Figures 3c and 3d show that the spatial distribution of the year-over-year change in the number

of one- or two-family home sales tends to negatively correlate with the number of COVID-19 cases

mapped in Figures 3a and 3b. This is especially true during the first wave of infections. From March 1,

 19
2020 through July 31, 2020, Staten Island, Brooklyn, and Queens experience some of the largest

reductions in the number of transactions. MODZCTAs in Manhattan report the smallest year-over-year
reductions, and even some increases, in the number of property sales, though it is notable that Manhattan

also has the smallest number of one or two-family homes. This inverse correlation between the volume
of sales and cumulative case rates is still apparent (i.e., see Manhattan, and parts of the Bronx and Queens),

but not as strong during the second wave of infections. Particularly, Staten Island and parts of Brooklyn

defy this pattern demonstrating larger sales volumes and higher cumulative case rates.

 Third, year-over-year changes in the average MODZCTA sale prices, depicted by Figures 3e and 3f,

are much more volatile and more dispersed across NYC MODZCTA’s than Coronavirus case rates and

are therefore only mildly and negatively correlated. Most MODZCTAs in Manhattan report zero sales
during the COVID-19 period in 2020 and therefore we cannot determine the change in average sale prices.

For those Manhattan MODZCTAs that report sales during the relevant periods in 2019 and 2020, the

average sale price of one- or two-family homes either falls drastically by as much as $12.4 million or

increases dramatically by up to $29 million. Across the remaining boroughs, around two-thirds of

MODZCTAs experience a modest increase in average sale prices (see Figures 3e and 3f).

5 Results
Our empirical analysis estimates the COVID-19 case effect on the sale price of NYC one- and two-family
homes. We differentiate the pandemic effects across the full sample of one- and two-family homes as well

as the restricted repeat-sales sample. Moreover, the analyses provide estimates of the pandemic effects

during the first wave of infections (samples restricted to the months of March through July of any given

year to control for seasonal effects) and the second wave of infections (samples restricted to the months

of August through December of any given year to control for seasonal effects). The results point to

significant fear of contagion and pandemic-induced income effects on the NYC real estate market. The

estimates notably vary across the first and second waves of infections and differ for repeat sales.

5.1 Baseline Price Analysis

We begin our price analysis with the standard hedonic regression on the full sample of one- and two-

family home sales (non-investor-owned). Table 3 shows we differentiate the effects between the first wave

 20
Table 2: Changes in Pre- and Post-Pandemic NYC Real Estate Market Characteristics

 (1) (2) (3) (4) (5) (6) (7) (8) (9) (10)
 Sales of once-sold Properties Sales of repeatedly-sold Properties
 Characteristic Pre- Pre- Post- Post- ∆ in Pre- Pre- Post- Post- ∆ in
 Mean S.D. Mean S.D. Means Mean S.D. Mean S.D. Means

Panel A: First Wave of Infections (03/01/2019-07/31/2019 vs. 03/03/2020-07/31/2020)
 Sale Price ($ ‘000) 784.74 (600.4) 793.64 (579.2) 8.90 660.50 (470.3) 763.98 (384.9) 103.48***
 # of Sales 81.20 (60.3) 49.43 (34.7) -31.78*** 10.24 (6.5) 5.09 (3.2) -5.15***
 Unemployment Rate (%) 4.04 (2.8) 14.07 (8.1) 10.03*** 5.13 (3.4) 15.48 (8.1) 10.35***
 Renovated Home (yes==1) 0.04 (0.2) 0.05 (0.2) 0.01 0.03 (0.2) 0.04 (0.2) 0.01
 Building Area (’00 sqft) 24.34 (164.6) 28.95 (222.0) 4.61 16.57 (6.2) 17.52 (7.4) 0.95
 Lot Area (’000 sqft) 7.25 (109.4) 10.93 (162.4) 3.68 2.88 (1.5) 2.90 (1.9) 0.02
 # of Floors 2.03 (0.5) 2.03 (0.5) -0.00 2.04 (0.5) 2.09 (0.5) 0.05
 Basement (yes==1) 1.00 (0.0) 1.00 (0.0) 0.00 1.00 (0.0) 1.00 (0.0) 0.00
 Population (’000) 53.94 (25.2) 54.89 (25.3) 0.95 54.27 (24.9) 57.51 (24.0) 3.24
 Share of White Residents (%) 39.46 (17.1) 38.05 (16.9) -1.41*** 38.56 (18.3) 38.96 (18.0) 0.40
 Share of Rental Units (%) 45.95 (19.9) 46.45 (20.0) 0.50 47.16 (20.5) 48.07 (21.5) 0.90
 Density per Unit 2.79 (0.4) 2.78 (0.4) -0.02 2.88 (0.4) 2.86 (0.4) -0.03
 English Proficiency 11.71 (10.2) 11.73 (10.2) 0.02 9.73 (8.9) 10.90 (9.9) 1.17
 Median Income ($ ’000) 73.67 (18.6) 72.98 (18.2) -0.69 70.26 (19.0) 69.64 (20.5) -0.61
 Share College Educated (%) 56.33 (8.9) 56.30 (8.8) -0.03 53.91 (8.9) 53.85 (9.9) -0.06
 Observations 5,670 3,471 9,141 542 277 819

Panel B: Second Wave of Infections (08/01/2019-12/31/2019 vs. 08/01/2020-12/31/2020)
 Sale Price ($ ’000) 769.41 (517.7) 806.35 (754.2) 36.94** 647.07 (381.2) 740.55 (483.4) 93.48**
 # of Sales 89.37 (63.4) 90.64 (74.8) 1.27 9.26 (6.4) 8.79 (9.2) -0.47
 Unemployment Rate (%) 3.59 (2.5) 12.09 (4.0) 8.50*** 4.41 (2.9) 12.59 (3.7) 8.18***
 Renovated Home (yes==1) 0.04 (0.2) 0.04 (0.2) 0.00 0.02 (0.1) 0.03 (0.2) 0.01
 Building Area (’00 sqft) 24.42 (170.0) 28.29 (211.5) 3.87 32.48 (258.6) 29.69 (243.7) -2.80
 Lot Area (’000 sqft) 7.76 (120.8) 9.87 (143.7) 2.11 12.05 (166.3) 13.50 (190.8) 1.45
 # of Floors 2.03 (0.5) 2.02 (0.5) -0.01 2.00 (0.5) 2.02 (0.5) 0.02
 Basement (yes==1) 1.00 (0.0) 1.00 (0.0) 0.00 1.00 (0.0) 1.00 (0.0) 0.00
 Population (’000) 54.49 (25.6) 52.82 (25.2) -1.66*** 53.94 (24.5) 54.13 (24.1) 0.19
 Share of White Residents (%) 39.38 (17.0) 40.96 (17.8) 1.58*** 40.09 (18.6) 43.97 (19.2) 3.89**
 Share of Rental Units(%) 46.06 (19.8) 44.28 (20.1) -1.78*** 46.22 (20.1) 42.67 (20.8) -3.55*
 Density per Unit 2.79 (0.4) 2.76 (0.4) -0.03*** 2.86 (0.4) 2.79 (0.4) -0.06*
 English Proficiency 11.88 (10.4) 11.64 (10.4) -0.24 9.88 (9.2) 9.51 (8.4) -0.37
 Median Income ($ ’000) 73.64 (18.4) 75.43 (18.8) 1.79*** 71.62 (19.4) 75.82 (19.2) 4.20**
 Share College Educated (%) 56.39 (8.6) 57.00 (8.8) 0.62*** 54.67 (8.8) 56.56 (8.7) 1.89**
 Observations 6,345 5,845 12,190 495 354 849

 Notes: Data on the number of one- and two-family property transactions and sale prices are published by the
 NYC Department of Finance. Information on NYC MODZCTA unemployment rates are published by DEEP-
 MAPS. Statistics on housing characteristics are publicly available through the PLUTOTM database maintained by
 the NYC Department of City Planning. Neighborhood characteristics represent the sample averages for the
 respective samples of observed sales and are based on 2019 data available through American Community Survey
 published by the U.S. Census. Based on our sample, we define distinct post outbreak periods including the 1) the
 1st wave of infections from March 1, 2020 through July 31, 2020; and 2) 2nd wave of infections from August 1,
 2020 through December 31, 2020. For the purposes of comparison, we calculate pre-outbreak statistics based on
 a limited sample restricted to 1) March 1 to July 31, 2019; and 2) August 1 to December 31, 2019.

 21
Figure 3: Cumulative Case Rates and MODZCTA Changes in the # of Property Sales and Avg. Sale
Prices by Wave of Infection

 22
of infections, including sales data from March through July from 2003 through 2020, and the second wave

of infections, including sales data from August through December from 2003 through 2020. We restrict
the samples to these five-months windows per year to control for seasonality in the real estate market.

First wave estimates are shown in columns (1) and (2), whereas second wave estimates are given in
columns (5) and (6). Each regression controls for the local neighborhood share of investor-owned single-

and two-family residential properties as well as available property characteristics, such as the age of the

home, its building and lot square footage, number of floors, and whether the property has a basement and
has been altered since 2000. 13 Moreover, we include MODZCTA and month-of-sale fixed effects to

control for other unobservable time-invariant neighborhood attributes and common trends.

 The coefficient estimates of interest suggest that a rise in the rate of cumulative MODZCTA
Coronavirus infections per 100,000 residents is associated with a significant reduction NYC home sale

prices. This effect is found to be notably larger during the second wave of the pandemic compared to the

first (compare columns (1) and (2) vs. (5) and (6) of Table 3) and robust to the inclusion of the

neighborhood unemployment rate. As we expected, a rise in unemployment significantly lowers property

sale prices and the estimated effect is relatively stable across both estimation samples (see columns (2)

and (6)).

 Coefficients estimates for the control variables tend carry the expected sign (Chau and Chin, 2003)

and some are found to be statistically significant at the 1% to 10% levels (see columns (1), (2), (5), and

(6) of Table 3). Among the statistically significant estimates, we find that property modifications are
associated with increases in property values. For every alteration since the year 2000, the average sale

price of one- and two-family homes rises by approximately $135,000. Similarly, larger homes located on

larger lots and those with basements command a price premium adding, for example, over $210,000 in

value per 1,000 additional square feet of living space.14 The share of investor-owned properties within a

given home’s neighborhood does not seem to be strongly correlated with its sale price.

 13
 According to the meta data of the PLUTOTM dataset, the NYC Department of Finance defines alterations as modifications to
the structure that, according to the assessor, change the value of the real property. The year of alteration is based on the associated
building permits.
 14
 The PLUTOTM dataset includes a number of potential control variables that describe the characteristics of a sold property.
Among the possibilities, we integrate structural home attributes that are consistently available for our sample of sold homes and
have been shown to be relevant determinants of house sale prices in the previous literature (see, for example, Chau and Chin (2003)).
Our results are quantitatively and qualitatively robust to the inclusion of alternative characteristics, such as indicator variables for
NYC neighborhood or health area, among others, and are available upon request.

 23
You can also read