LUCSUS - Lund University Publications
←
→
Page content transcription
If your browser does not render page correctly, please read the page content below
1_

     From Farm to Sea
     Applying Michelsen’s Six Step Theory to organic farming in
     Lithuania and its role in reducing eutrophication in the Baltic Sea
     and the Curonian Lagoon

     Simona Jastremskaite

           Master Thesis Series in Environmental Studies and Sustainability Science,
                                         No 2021:024

         A thesis submitted in partial fulfillment of the requirements of Lund University
     International Master’s Programme in Environmental Studies and Sustainability Science
                                           (30hp/credits)

                                                LUCSUS
                                                Lund University Centre for
                                                Sustainability Studies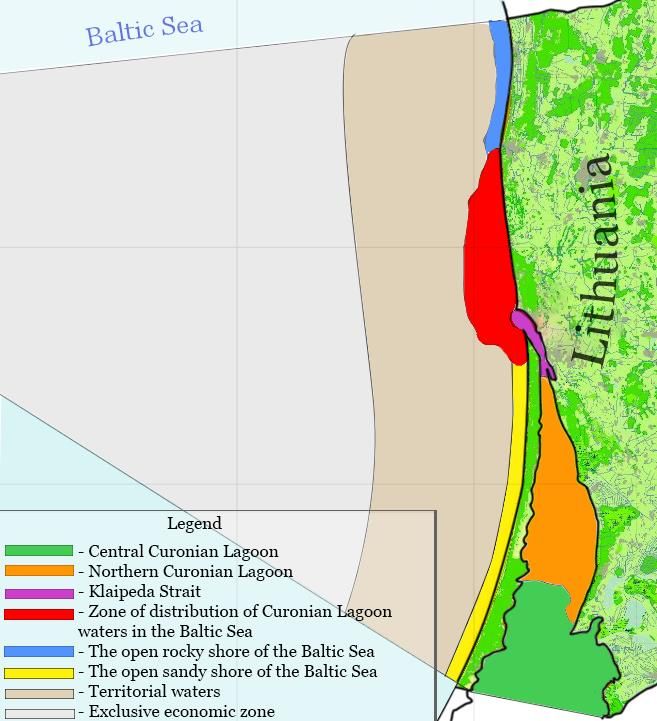
From Farm to Sea
Applying Michelsen’s Six Step Theory to organic farming in Lithuania and its
 role in reducing eutrophication in the Baltic Sea and the Curonian Lagoon

                               Simona Jastremskaite

 A thesis submitted in partial fulfilment of the requirements of Lund University International
                    Master’s Programme in Environmental Studies and Sustainability Science

                                                                     Submitted May 11, 2021

                                     Supervisor: Kimberly Nicholas, LUCSUS, Lund University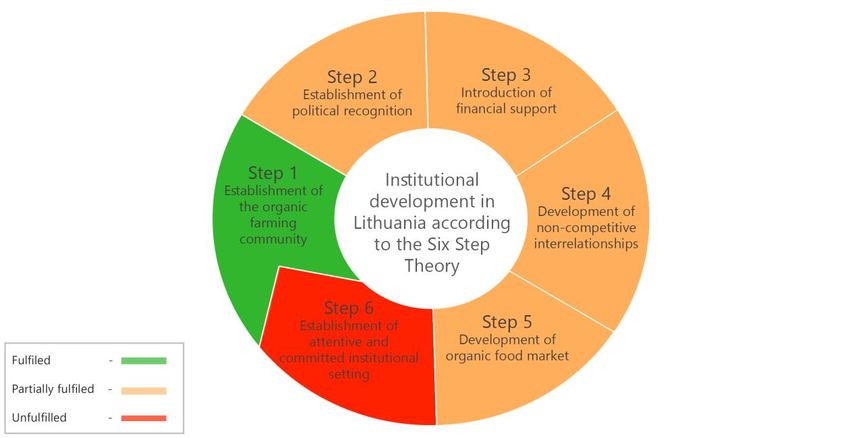
The page intentionally left blank
Abstract
Eutrophication in the Baltic Sea and Curonian Lagoon, mainly caused by agriculture, is creating a major
burden on Lithuania. While organic agriculture reduces eutrophication, the conversion of lands under
conventional agriculture to organic has been relatively slow.
Based on a systematic literature review, I identified 8 case studies and analysed that overall nitrogen
and phosphorous leaching from organic farming was 38% and 22% lower respectively than in the
conventional counterparts. I applied Michelsen’s Six Step Theory of the institutional development of
organic agriculture to 14 interviews with farmers and devising a survey of 134 consumers. I found that
the first step has been accomplished, but some of the elements in the remaining five steps have not
yet been fulfilled towards the development of organic farming in Lithuania. There is a need for better
incentives including collaboration between all relevant stakeholders that would encourage organic
farming and reduce eutrophication.

Keywords: institutional development, agriculture, sustainability science, organic farmers, nutrient
leaching, consumer awareness

Word count: 11,922
Acknowledgements
I would like to thank my supervisor Kimberly Nicholas for her guidance and patience throughout the
entire process. She provided me with countless sources to read and broaden my horizon in my research
topic. Her constant feedback was a source of not only great support but also helped me in streamlining
my work. I am delighted to admit that she made this major learning curve a rather enjoyable one.
I would also like to take this opportunity to thank the entire team of Environmental Protection
Department under the Ministry of Environment in Vilnius, Lithuania for providing me with a massive
opportunity to learn about the institutional development in the country and understand the
complicated issue of eutrophication in the Baltic Sea and Curonian Lagoon. I am grateful towards my
supervisors, Sergėjus Tretjakovas and Linas Ostanevičius for their guidance, insights and being sources
of information during my 3 month internship at Environmental Protection Department under the
Lithuanian Ministry of Environment.
A huge round of applause to all the farmers from Lithuania who took precious time out of their work
schedule to participate in the research interviews and share such invaluable information that
supported my research findings. I would also like to thank the 134 anonymous individuals who took
their time and filled in the consumer survey for this thesis.
I would like to thank the staff of Lund University Centre for Sustainability Studies for creating a
conducive environment for learning and research while deepening my knowledge and improving my
critical thinking ability. I would also take this opportunity to acknowledge my peers and colleagues for
their valuable inputs and feedback which helped me incorporate multiple perspectives into my work.
I would also like to thank my parents, Alina and Valdemaras for supporting me throughout the
internship and drafting the manuscript for the thesis. I would also like to thank my parents-in-law
Sujata & Gouri Sankar for all their humour, patience and encouragement.
Last but definitely not the least, I would like to thank my husband Dr. Soham Wrick Datta from the
bottom of my heart. He supported me when I was at my lowest, put up with my tantrums and cooked
the most delicious meals to keep me energized and take my stress away. He devised plans to take me
away from my computer and take my mind off my thesis for a stipulated time every week. I am also
grateful for his insights and sharing his experience about academic writing and suggestions on how to
improve my thesis. You are my rock!
Table of Contents

1 Introduction ........................................................................................................ 1
  1.1 Research aim ........................................................................................................... 3
  1.2 Contribution to sustainability science....................................................................... 4
2 Background ......................................................................................................... 4
  2.1 Coastal areas in Lithuania ........................................................................................ 4
  2.2 Current Eutrophication status in Lithuania ............................................................... 6
3 The Six Step Theory ............................................................................................. 8
  3.1 The Six Steps in detail ............................................................................................ 10
      Step 1: Establishment of an organic farming community ...................................................... 10
      Step 2: Establishment of political recognition ....................................................................... 10
      Step 3: Introduction of financial support .............................................................................. 10
      Step 4: Development of non-competitive interrelationships.................................................. 11
      Pure co-operation ............................................................................................................... 11
      Pure competition ................................................................................................................ 12
      Creative conflict .................................................................................................................. 12
      Step 5: Development of organic food market ....................................................................... 12
      Step 6: Establishment of attentive and committed institutional setting ................................ 12

4 Materials and methods ..................................................................................... 13
  4.1 Data collection and analysis ................................................................................... 13
      4.1.1 Systematic literature review for nutrient leaching in organic and conventional farms ... 13
      4.1.2 Semi-structured qualitative interviews with organic and conventional farmers ............ 14
      4.1.3 Consumer survey ........................................................................................................ 15
      4.1.4 Systematic literature review, interviews and survey for Six Step Theory ....................... 16

6 Results ............................................................................................................... 17
  5.1 Soil condition and nutrient leaching: comparing organic and conventional farming 17
  5.2 Interviews with Lithuanian farmers – motivations and barriers in organic farming .. 19
      5.2.1 Financial support ........................................................................................................ 20
      5.2.2 Lack of dialogue between the domains and unstable regulatory system ....................... 21
      5.2.3 Insufficient consumer demand .................................................................................... 22
  5.3 Consumer survey in Lithuania: purchasing trends and awareness regarding organic
  products ...................................................................................................................... 23
  5.4 Development of organic farming in Lithuania in relation to the Six Step Theory ...... 25
5.4.1 Development of organic farming in Lithuania over the years ....................................... 25
5.4.2 Six Step Theory on institutional development of organic farming in Lithuania .............. 26
Step 1: Establishment of the organic farming community ...................................................... 29
Step 2: Establishment of political recognition ......................................................................... 29
Step 3: Introduction of financial support ................................................................................. 30
Step 4: Development of non-competitive interrelationships ................................................. 30
Step 5: Development of organic food market ......................................................................... 31
Step 6: Establishment of attentive and committed institutional setting ............................... 33
5.5. The main barriers of organic farming in Lithuania .................................................. 33
6 Discussion and Recommendations .................................................................... 34
6.1 Nutrient leaching from organic and conventional agriculture ................................. 35
6.2 Tackling the 4 identified barriers in organic farming in Lithuania ............................ 36
6.2.1 Insufficient and unclear strategies and ever-changing regulations ............................... 36
6.2.2 Lack of financial support ............................................................................................. 37
6.2.3 Limited dialogue between stakeholders ...................................................................... 38
6.2.4 Lack of awareness, limited promotion and low consumer demand ............................... 39
6.3 Limitations of the thesis ......................................................................................... 40
7 Conclusion ......................................................................................................... 40
8 References......................................................................................................... 42
9 Appendices ........................................................................................................ 52
Appendix A. The coastal areas of Lithuania .................................................................. 52
Appendix B Interview Analysis (translated from Lithuanian) ........................................ 53
Appendix C Survey for the consumers of Lithuania ....................................................... 60
Appendix D Six Step Theory. Original table taken from Larsson et al. (2013, p.6, 7) ...... 67
Appendix E The three interrelationships between the three domains........................... 69
Appendix F Annual rainfall in Lithuania from 2010 to 2020 (raw data) .......................... 70
Appendix G Annual nitrogen and phosphorus inputs measured at the Nemunas outlet
into the Curonian Lagoon (raw data)............................................................................ 71
Appendix H. The Keywords used (with the addition of keywords used in Lithuanian) ... 72
Appendix I Total farming area and total number of farms in Lithuania (raw data). ........ 73
Appendix J Nitrogen and Phosphorus leaching. ............................................................ 74List of Figures Figure 1. Map of Lithuania ...................................................................................................................... 6 Figure 2. Annual nitrogen and phosphorus inputs measured at the Nemunas and compared to the annual precipitation levels ...................................................................................................................... 7 Figure 3. Interview questions addressing the Six Step Theory. ............................................................ 15 Figure 4. Total nitrogen leaching in different conventional and organic farms around Europe .......... 18 Figure 5. Total phosphorus leaching in different conventional and organic farms around Europe ..... 18 Figure 6. Consumer base, frequency in buying organic products and awareness regarding official certification ........................................................................................................................................... 24 Figure 7. Main motivations behind buying organic products ............................................................... 25 Figure 8. Development of organic and conventional farming in Lithuania (2010-2020) ...................... 26 Figure 9. Organic production logo ........................................................................................................ 33 Figure 10. Institutional development in Lithuania of organic farming sector according to the Six Step Theory.................................................................................................................................................... 34 List of Tables Table 1. Ecological status of the coastal areas in the Lithuanian Baltic Sea ........................................... 6 Table 2. The Six Step Theory by Michelsen et al. (2001) ...................................................................... 10 Table 3. Type relationship between the three domains ....................................................................... 11 Table 4. Keywords used for literature review (in English) .................................................................... 14 Table 5. Motivations to start organic farming as indicated by farmers................................................ 19 Table 6. Reluctance to switch to organic farming as indicated by conventional farmers .................... 20 Table 7. Financial support as indicated by farmers .............................................................................. 20 Table 8. Lack of financial support for the new organic farms as indicated by farmers ........................ 21 Table 9. Lack of dialogue and instability in regulatory system as indicated by farmers....................... 22 Table 10. Consumer demand in Lithuania as indicated by farmers ...................................................... 23 Table 11. The Six Step Theory from Lithuanian perspective................................................................. 28 Table 12. Institutional setting or organic agriculture in Lithuania according to the three domains .... 31
Abbreviations
BSAP – Baltic Sea Action Plan
CAP – Common Agricultural Policy
EU – European Union
HELCOM – Helsinki Commission
RBD – River Basin District
RDP - Rural Development Programme
TN – Total Nitrogen
TP – Total Phosphorus
1 Introduction
Eutrophication, more commonly known as algal bloom, is an enhancement of nutrients that negatively
affects water bodies originating primarily from different anthropogenic activities such as urban
wastewater, industry or intensive agriculture (da Costa et al., 2018). In recent times it has become one
of the most complicated issues around the world due to the negative impacts on aesthetic,
recreational, economic and ecological conditions (Stancinkaite et al., 2011). Eutrophic tendencies
increased over the past decades becoming a serious threat. In 1960 eutrophication was detected in 10
water bodies and in 2008 it skyrocketed to 405 water bodies around the world (Selman & Greenhalgh,
2009). The ever-increasing temperatures due to climate change also enhances algal blooms and
intensifies eutrophic processes (Jansson et al., 2019). Therefore, it is necessary to curb the nutrient
leaching from human activities to avoid even more intense algal blooms in the future.

The Baltic Sea is often referred to as being the most polluted sea around the world (Tynkkynen et al.,
2014). 97% of the Baltic Sea is affected by eutrophication which results in a wide spectrum of negative
impacts for surrounding countries including loss of biodiversity, negative effects on tourism and human
health among others (Fleming-Lehtinen et al., 2018; Wasmund, 2002; Fammler et al., 2018). The nine
countries which belong to the Baltic Sea region (Sweden, Finland, Russia, Estonia, Latvia, Lithuania,
Poland, Germany and Denmark) all contribute to the eutrophic processes as the sea is extremely
sensitive to anthropogenic activities (Fleming-Lehtinen et al., 2018). The eutrophication is enhanced
due to its geographical characteristics including shallowness, abundant freshwater input from the
surrounding countries, and the sluggish exchange of water between the Baltic and the North Sea
(Reusch et al., 2018). However, even if the water body has a tendency to natural eutrophic processes,
decreasing the additional nutrients from anthropogenic activities would potentially diminish algal
bloom levels.

Eutrophication is a complex problem and tackling the issue requires a step-by-step process involving
high level expertise, governance, involvement of various institutions and stakeholders, and prioritising
detailed research. The countries under the Helsinki Commission (HELCOM) are constantly making
efforts to reduce eutrophication while working under the Baltic Sea Action Plan (BSAP). The BSAP has
an array of objectives and targets to curb the nutrient levels causing harmful algal blooms (Murray et
al., 2019). However, the ambition to reach good ecological status for the Baltic Sea and the Curonian
Lagoon (hereinafter referred to as the Baltic Sea) and reduce eutrophication by 2020 was not reached
and thus the updated BSAP is expected to be released around mid-2021 (HELCOM, 2020a).

                                                   1
The Baltic Sea is an important part of Lithuanian economy and culture. Around 3% of the total GDP in
Lithuania originates from the shipping industries, coastal tourism and fishing (European Commission,
2015). The shallow Curonian Lagoon, which catches all freshwater runoff from Lithuania, is separated
from the sea by the Curonian Spit (Fig. 1). This area contains unique and vulnerable biodiversity of
marine species and the entire region of Curonian Spit is declared as UNESCO heritage site (Inacio et
al., 2018). However, eutrophication is one of the main reasons for the dead zones which negatively
affects the coastal areas in Lithuania (Murray et al., 2019), and is expected to worsen under current
policies, stressing the biodiversity and socioeconomic wellbeing of the country (Daunys et al., 2020).
The main contributor to the harmful algal blooms in the Baltic Sea is excess nutrients mainly originating
from agriculture (Daunys et al., 2020). Approximately 60% of land in Lithuania is designated to
agricultural activities (European Commission, 2020a) and in 2019 it accounted for around 3% of the
total GDP in Lithuania (Statista, 2021) and provided approximately 6% of total employment (The World
Bank, 2020). Agriculture contributes to around 55% of nutrient runoff into the Baltic Sea (Lietuvos
Respublikos Vyriausybe, 2017). Nutrients leaching from agriculture are responsible for the failure to
reach good ecological status in the River Basin Districts (RBDs) approximately 12% of the Venta RBD,
20% in the Nemunas RBD and a staggering 71% in Lielupe RBD (Plunge, et al., 2018).
Lithuania puts immense efforts in trying to reduce excess nutrients from anthropogenic activities. They
invested around 1 billion euros from 2004 until 2020 to urban wastewater treatment systems which
helped in reducing the discharge of nutrients from the cities and successfully move towards achieving
better ecological status of the Baltic Sea (Leflaive, 2019). Lithuania introduced and levied pollution
taxes that help to control the industries (Leflaive, 2019). However, nitrogen and phosphorus leaching
from agriculture is harder to control since it heavily depends on precipitation, soil quality and overall
agricultural management techniques (Remeikaite-Nikiene & Lauciute, 2020).
One of the proposed ideas to control nutrient leaching from farming is to enhance the organic farming
sector (Fammler et al., 2018). Unlike conventional farming, one of the main constituents of organic
agriculture is strict management of fertilisers which consequently lessens harmful nitrogen and
phosphorus runoffs (Seufert, Ramankutty & Mayerhofer, 2017). Despite early uncertainty about the
potential benefit of organic agriculture in reducing eutrophication (Tuomitso et al., 2012), the new
BSAP regards nutrient runoffs from agriculture as one of the major contributors to eutrophication and
thus emphasises the growth of the organic farming sector as one of the measures to decrease overall
nutrient runoffs (HELCOM, 2020b). The differences in characteristics and the economic and
environmental benefits of organic agriculture are acknowledged by the consumers and the
government of Lithuania thus stressing the need to expand the organic farming sector. However, the
2current growth of organic farming, at only around 8% of total agriculture in Lithuania and growing at
the slow pace of approximately 0.26% per year (Fig. 8) is considered to be too meagre to make any
positive impact on environment. Lithuania does not have a set goal or action plan for the successful
development of organic farming. Therefore, it is necessary for Lithuania to increase the growth of
organic agriculture.
Considering the large and growing area under conventional agriculture in Lithuania, and comparing it
to the relatively minuscule areas of organic farms which is developing slower than expected, it can be
argued that eutrophication tendencies in Lithuania will not decrease if no appropriate measures
towards the promotion of organic agriculture is taken.
1.1 Research aim
In this thesis, I aim to provide evidence that if carefully managed organic farming practices increased
in Lithuania, by transitioning conventional farms into organic agriculture, the eutrophication levels in
the Baltic Sea would be likely to reduce over time. However, the development of organic agriculture is
considered to be slow due to the lack of institutional development. To go into further analyses in
regard to organic farming in Lithuania, I have applied the Six Step Theory proposed by Michelsen et al.
(2001) which analyses and suggests improvements regarding institutional development of organic
agriculture, based on evidence from six EU countries, including Belgium characterised by pure
competition interrelationship and Denmark with total agricultural area and landform which are similar
to Lithuania. Therefore, the thesis addresses the following research questions (RQs):
RQ1: How does nitrogen and phosphorus leaching from conventional farming compare to leaching
from organic farming in the EU?
RQ2: How do farmers in Lithuania perceive the challenges and benefits of conducting organic
agriculture?
RQ3: How do consumers in Lithuania promote and hinder the institutional development of organic
agriculture?
RQ4: How far has organic farming developed in Lithuania in regard to the Six Step Theory?
The thesis contributes to sustainability science by analysing the Six Step Theory which promotes the
development of robust and pertinent institutional environment that would boost the growth of the
sustainable organic farming sector and in turn would potentially reduce eutrophication levels in the
Baltic Sea.
31.2 Contribution to sustainability science
Sustainability science is a field of research that deals with interrelationships “between nature and
society” (Kates et al., 2001, p.641). It emphasises on the complex interactions between multiple
disciplines to support sustainable development (Clark & Dickson, 2007).
The thesis addresses two sustainability issues identified by Jerneck et al. (2011): biodiversity loss and
land use change. There are three main characteristics of sustainability science: 1) Methodological
pluralism (several methods used in one study which would be “aimed at action”), 2) Integrated
assessment (using knowledge (science) to work towards action (policies)) and 3) Interdisciplinarity
(working towards integration of results into interdisciplinary frameworks, contexts and fields)
(Spangenberg, 2011, p. 276).
I attempted to apply all three characteristics in the thesis:
1) I used a range of methods involving a collection of both quantitative and qualitative data that is
aimed at elaborating on institutional development;
2) I assessed the benefits of organic farming, analysed the state of institutional development in the
organic farming sector and worked towards devising potential recommendations on the improvement
of national policies and institutional environment. This paper contributes to sustainability science as I
showcased the benefits of organic farming, analysed and evaluated the institutional development of
the organic farming sector in Lithuania as per the Six Step Theory by Michelsen et al. (2001);
3) I aimed at interdisciplinarity by involving diverse stakeholders including consumers, organic and
conventional farmers and the governing body of Lithuania into the process of the research, evaluating
the possible boundaries and considering the possible solutions across different disciplines and sectors.
2 Background
2.1 Coastal areas in Lithuania
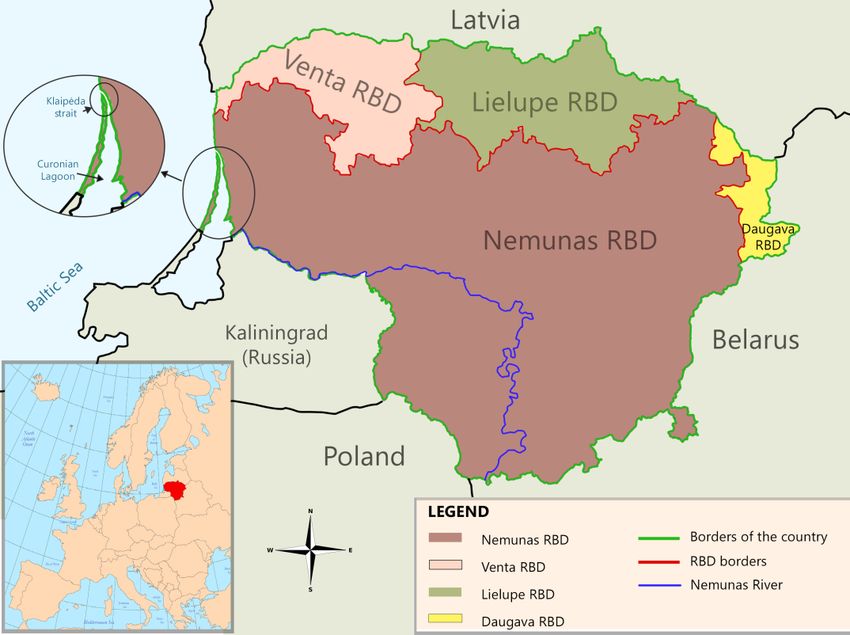
This paper focuses on Lithuania and its maritime area which includes the Curonian Lagoon and
Lithuanian coastal territories of the Baltic Sea (Fig. 1). The coastline in Lithuania is 262 km long
(European Commission, 2015) while the territorial waters of Lithuania are 1,810 km2 (MSP-platform,
2020).
The Baltic Sea is one of the largest brackish water bodies in the world where the salinity ranges from
5g/kg to 7g/kg (Kniebusch et al., 2019) and can be almost regarded as a freshwater body since the
average global seawater salinity is around 35g/kg (Millero et al., 2008). The sea is mainly fed with fresh
4water supplies from rivers flowing through the surrounding countries which also bring pollutants and
excess nutrients enhancing eutrophication (Kniebusch et al., 2019). The sea is a semi-enclosed water
body which has restricted water exchange with the North Sea at the small outlet at Kattegat Bay
between Denmark and Sweden (Fammler et al., 2018). Low salinity levels and slow exchange of water
makes the sea extremely sensitive to the surrounding pressures due to accumulation of pollutants
from anthropogenic activities thus encouraging eutrophic processes which poses serious threats to the
local ecosystem (Smol et al., 2020).
The Curonian Lagoon (Fig. 1) is the biggest semi-enclosed lagoon in Europe characterised as shallow
(average depth 3.8 metres), almost freshwater body located in the coastal areas of Lithuania and
shared with the region of Kaliningrad, Russia (Meziene et al., 2019; Zemlys et al., 2013). This lagoon is
disconnected from the Baltic Sea by the isthmus of Curonian Spit and the only place where it meets
the sea leading to water exchange is the small outlet in the Klaipeda Strait (Fig. 1).
The main discharge into the Curonian Lagoon is from the Nemunas River, of which 48% originates from
Lithuania, 46% from Belarus while Kaliningrad (Russia), Poland, and Latvia contribute to the rest (Raike
et al., 2018). The Nemunas contributes to about 98% of water input (Cerkasova et al., 2016). As the
Nemunas River drains the central and western Lithuanian lowlands which are the country’s best
agricultural lands (FAO, 2016) and consisting of mostly intensive agricultural areas (Raike et al., 2018),
the river is highly nutrient polluted (Meziene et al., 2019). Considering the international boundaries
with all the RBDs, there is a need for establishing a successful collaboration and dialogue between the
neighbouring countries sharing the RBDs in order to ensure cooperation for monitoring programmes
and implementing River Basin Management Plans towards nutrient reduction.
5Figure 1. Map of Lithuania. The figure shows map of Lithuania as well as the neighbouring countries, River Basin
districts (RBDs), Curonian Lagoon, Klaipeda Strait, coastal areas of Lithuania and the River Nemunas. The figure
was created by author.
2.2 Current Eutrophication status in Lithuania
The coastal areas of Lithuania is constantly failing to achieve good ecological status (Table 1). The
ecological status of water bodies is usually classified according to the five main levels – very good,
good, average, bad and very bad (Remeikaite-Nikiene & Lauciute 2018). The quality of the water body
depends on several indicators which includes monitoring the levels of chlorophyll a, levels of total
Nitrogen (TN) and total Phosphorus (TP), evaluating the transparency of water, calculating the
abundance of macroinvertebrates, measuring the levels of phytoplankton and observing the
ichthyofaunal indicator (Remeikaite-Nikiene & Lauciute 2018). The monitored coastal areas in
Lithuania are classified as highly eutrophic, ranging from average to bad or very bad, indicating the
necessity for future studies and careful management of nutrients.
Years 2010 2011 2012 2013 2014 2015 2016 2017 2018
The coastal areas*
Central Curonian Lagoon
Northern Curonian Lagoon
Klaipeda Strait
Zone of distribution of Curonian Lagoon waters in the
Baltic Sea
The open rocky shore of the Baltic Sea
The open sandy shore of the Baltic Sea
Table 1. Ecological status of the coastal areas in the Lithuanian Baltic Sea. The table shows the ecological status
of the coastal areas in Lithuania from 2010 to 2018. Different colours indicate the ecological status:
- very good; - good; - average; - bad; - very bad.
* To understand the coastal areas in Lithuania refer to the Appendix A. The data for the table was taken from
Remeikaite-Nikiene & Lauciute (2018) and created by author.
6During heavy precipitation, the country experiences high levels of nutrient leaching into the RBDs
which eventually reaches the Baltic Sea (Feiza et al., 2019). Therefore, the entire territory of the
country has been declared as nitrate vulnerable zone (Aplinkos apsaugos agentura, 2020). Annual
precipitation is one of the main factors which decide the nutrient runoffs and inputs of TN and TP from
farmlands into the rivers (Fig. 2).
In the period 2010-18, precipitation accelerated nutrient leaching from the soil leading to the Nemunas
River exceeding the recommended nutrient input ceiling and worsening ecological status of the coastal
areas as emphasised by the HELCOM statistical data portal (HELCOM, 2019). The annual levels of TN
and TP were higher than the recommended nutrient input ceiling (Fig. 2). It can be seen that the mean
TN over this nine year period is more than double the recommended nutrient input ceiling for
Nemunas and the highest TN in 2017 due to heavy precipitation that increased leaching from
farmlands, was more than triple the limit. Similarly, the mean TP over this nine year period is also more
than double the recommended nutrient input ceiling for Nemunas, and more than four times the limit
in 2017 (Fig. 2).
Annual nitrogen inputs from Nemunas compared to input ceilings and
annual precipitation (2010-2018)
80000 1000
60000 800
600
mm
t
40000
400
20000 200
0 0
2010 2011 2012 2013 2014 2015 2016 2017 2018
year
Nemunas inputs Nitrogen input ceiling Annual precipitation
Annual phosphorus inputs from Nemunas compared to input ceilings
and annual precipitaion (2010-2018)
2500 1000
2000 800
1500 600
mm
1000 400
t
500 200
0 0
2010 2011 2012 2013 2014 2015 2016 2017 2018
year
Nemunas inputs Phosphorus input ceiling Annual precipitation
Figure 2. Annual nitrogen and phosphorus inputs measured at the Nemunas and compared to the annual
precipitation levels. The nutrient inputs were measured at the Nemunas outlet into the Curonian Lagoon and the
Baltic Sea and compared to the annual precipitation levels. The data for nutrient input ceilings was gathered from
HELCOM (2021) report. The data for nutrient inputs from Nemunas was gathered from HELCOM (2019) database
(Appendix G). The data for annual precipitation was provided by the Lithuanian Hydrometeorological Service
(Appendix F). The figure was created by the author.
73 The Six Step Theory
The Six Step Theory was first introduced by Johannes Michelsen, Kennet Lynggaard, Susanne Padel and
Carolyn Foster in 2001 (Michelsen et al., 2001). The theory analyses the development and current state
of organic farming within the EU countries, using institutional aspects and institutional theory, and
proposes efficient policies and institutional improvements in regard to the growth of organic farming
sector in six steps (Table 2). The theory was developed by studying cases of institutional development
in six EU countries: Austria, Belgium, Denmark, Greece, Italy and United Kingdom.
The Six Step Theory consists of three domains which are interconnected with one another in complex
relationships and also responsible for creating barriers in regard to organic farming (Michelsen et al.,
2001). The three domains are: (1) the farming community, (2) agriculture policy and (3) food market.
All three of them must collaborate and work with one another within institutional environments in all
six steps to successfully develop organic farming sector (Michelsen et al., 2001, p i). The three domains
and the corresponding institutions are represented within all six steps, namely: 1) establishment of the
organic farming community, 2) establishment of political recognition, 3) introduction of financial
support, 4) development of non-competitive relationships, 5) development of organic food market and
6) establishment of attentive and committed institutional setting (Michelsen et al., 2001, p. vii).
The first three steps are crucial in order to have a strong establishment of the organic sector and the
last three steps are regarded as being essential for the stable progress of organic agriculture (Larsson
et al., 2013). The Six Step Theory should not be adopted in a linear manner but rather used in a circular
path (Michelsen et al., 2001). Therefore, when countries fulfil all the steps it is essential to go back to
the beginning and assess the existing institutions in order to devise better strategies and look into the
possible barriers (Michelsen et al., 2001).
The EU Member States carry out the specified rules for agriculture differently from each other to be
able to adapt to their national regulations (Michelsen et al., 2001). As a result, certain procedures such
as financial support, market development or institutional setting in regard to the development of the
organic farming sector differ in almost every EU country. Therefore, in many cases weak institutional
setting interferes with the progress of the already sluggish growth of organic agriculture (Larsson et
al., 2013). The Six Step Theory identifies the possible barriers within the institutional setting that
hinders the development of organic farming and finds possible solutions (Larsson et al., 2013).
Therefore, the Six Step Theory was chosen in to order to understand how Lithuanian state institutions
developed their governance and policies to support the growth of the organic farming sector.
8Steps Characteristics of a successfully Indicators of characteristics
established step
Step 1: Establishment of 1.1 Robust identity of organic farming 1.1.1 The introduction of organic
the organic farming community farming as a concept (date)
community 1.2 Established organic farming 1.2.1 Associations for organic
associations farmers exist
1.2.2 Farmers who are a part of the
associations
Step 2: Establishment of 2.1 Regulations and governance in 2.1.1 Introduction of the first
political recognition regard to organic farming exist national regulation regarding
organic farming (date)
2.1.2 Current regulations regarding
organic farming (date)
2.2 Procedures and strategies 2.2.1 Organic farming strategy is a
part of general farming strategy in
the country
2.2.2 Target to reach for organic
farming in the country (%)
Step 3: Introduction of 3.1 Financial support 3.1.1 Financial support is
financial support introduced (date)
3.2 Area payments 3.2.1 Area payments exist
3.2.2 The amount provided for
organic farming only (euro/ha)
3.3 Research and innovation 3.3.1 Research support designated
programme support for organic farming exists
(euro/year)
3.3.2 Range of research
programme
3.4 Financial schemes and subsidies 3.4.1 Loans for organic farms exit
3.4.2 Tax reduction for organic
farms exists
3.4.3 Certification/inspection cost
reimbursement
Step 4: Development of 4.1 Cooperation (pure co-operation, 4.1.1 Cooperation and dialogue
non-competitive pure competition and creative between the farming community,
interrelationships conflict) agriculture policy, and the market
exist
4.2 Inclusion of organic farming into 4.2.1 Political body designated to
official state institutions represent organic farming
community exists
Step 5: Development of 5.1 Established supply chain for organic 5.1.1 Designated areas to process
organic food market farming sector organic products exist
5.1.2 The entire supply chain for
organic production is established
5.1.3 Promotion of the organic
products
5.2 Consumers choice and favour of 5.2.1 Consumers understand the
organic production concept of organic farming
5.2.2 Consumers understand the
value of certified product with the
official logo
5.2.3 Consumer acceptance of
organic products (%)
5.2.4 % of consumers who buy
organic products more than once a
9week/ more than once a month/
lesser than once a month
5.2.5 Price acceptance (%)
5.3 Certification for organic products 5.3.1 Special organic product logo
is used
5.4 Market share of organic products is 5.4.1 Market share of organic
large products (total percent)
Step 6: Establishment of 6.1 Inclusive space for dialogue 6.1.1 Discussion arena is created
attentive and committed regarding both parties and future action 6.1.2 Future action plan for organic
institutional setting planning farming is set and/or constantly
discussed
Table 2. The Six Step Theory by Michelsen et al. (2001). The table shows the in-depth analysis of the steps by
showing the characteristics of the steps and the relevant indicators for the characteristics. The table was created
by the author based on the theory of Michelsen et al. (2001) and inputs of Larsson et al. (2013, p.6, 7) who closely
worked on the theory by establishing the essential indicators. The original table from Larsson et al. (2013, p. 6, 7)
can be found in Appendix D).
3.1 The Six Steps in detail
Step 1: Establishment of an organic farming community
Establishing a successful organic farming community is the initial step towards the development of
organic farming. The identity of organic agriculture is usually regarded as a “social movement”
(Michelsen, 2009, p. 254) as organic farmers are willing to establish or switch to organic practices due
to their personal beliefs and ideas in regard to changing different aspects of the mainstream
agricultural activities. However, the problem arises when farmers have biases or very little knowledge
in regard to organic farming which often results in relatively small numbers of farmers transitioning to
organic practices (Siepmann & Nicholas, 2018). Therefore, it is essential to establish a community and
associations that would provide guidelines, sufficient knowledge and support in transitioning towards
organic farming.
Step 2: Establishment of political recognition
Country-level governmental recognition of organic farming strengthens the establishment of the
sector (Michelsen et al., 2001). It consists of specific regulations and measures including environmental
and quality monitoring programmes as well as establishing procedures and future strategies. Political
recognition is followed by more tangible governmental support such as financial aid (Larsson et al.,
2013).
Step 3: Introduction of financial support
Financial support for both organic and conventional farming communities within member states are
usually paid from the Common Agricultural Policy (CAP) funds that come from the general budget of
the EU (European Commission, n.d.). This is usually introduced with the additional payments to the
farmers depending on the type of farming and the so called ‘greening’ payments from the Pillar II of
CAP, which is focused on environmental and rural development issues. Research support along with
10different schemes, projects, loans and subsidies help in assisting the organic farming sector towards
further growth (Michelsen et al., 2001).
Step 4: Development of non-competitive interrelationships
Non-competitive interrelationships are created between the three domains of farmers, policy, and
markets, which together represent the institutions related to the organic farming sector and need to
actively collaborate with each other for further development of organic farming (Michelsen et al.,
2001). The successfully implemented relationship dynamics, dialogue and cooperation between the
three domains usually motivate and encourage other farmers to establish or transition to organic
agriculture thus advancing the overall development of the sector (Michelsen et al., 2001). Michelsen
et al. (2001) describe three main relationships between the three domains, namely: pure co-operation,
pure competition and creative conflict (Table 3). The latter is the best because it is a combination of
both collaboration and conflict which leads to constant exchange of views for betterment of situations
and results in the continuous development of the organic farming sector.
Type of relationship between the three domains
Components
Pure co-operation Pure competition Creative conflict
General relationship
Very little or no co- A combination of both
between organic and Unconditional co-operation
operation between the collaboration and conflict in
general agriculture in regard to every aspect
three domains regard to various aspects
institutions
Need for organisations
No Yes Yes
related to organic farming
No wish for clear
Collaboration in regard to
communication and the so- Elimination of all possible
pursuing and addressing
Perception of interests called “silence on dialogue between the three
some issues and conflict in
differences in farming domains
regard to others
systems” is apparent
Mutual respect and
No wish for exchange of No effort is made for
Exchange of views constant exchange of views
views exchange of views
for betterment of situations
Possible results in regard
Weak identity and
to the identity of organic Shrinking sense of identity Continuous development
stagnation
farming
Possible results in regard
Gradual crippling of further Restricted growth and
to the development of Gradual development
development development
organic farming
Table 3. Type relationship between the three domains. The three main relationships between the organic farming
sector and the agricultural institutions. The table shows and analyses the three possible relationships between
the organic farming sector and agricultural institutions as per Michelsen et al. (2001). The table is taken from
Michelsen et al. (2001, p.11) and adapted by the author for relevance in regard to the case study. The original
table can be found in Appendix E.
Pure co-operation
Pure co-operation is based on unconditional cooperation between the organic farming sector (the
farming community) and the other institutions that belong to the remaining two domains (agricultural
policy and the food market). There is no need for support organisations and there may be no distinction
between organic and conventional farming as there is “silence on differences in farming systems”
(Michelsen et al., 2001, p.10). When the pure co-operation exists between the three domains, there
11are no clashes of interest and no propositions for further development. Such interrelationship
diminishes organic farming identity. This particular interrelationship can only be successful if the
objective of the government is to establish organic agriculture across the entire country (Michelsen et
al., 2001).
Pure competition
Unlike pure cooperation, the pure competition interrelationship results in very little or no
communication between the existing farming institutions among the three domains as they see one
another as a competitor within the market and in regard to governmental and economic support
(Michelsen et al., 2001). Although there is a strong need for support organisations and further action
that would strengthen organic agriculture, there is no cooperation, no exchange of proposals and pre-
existing continuous clashes of interests between the three domains. Consequently, the pure
competition interrelationship restricts the growth and strengthening of organic agriculture sector and
its identity in the country (Larsson et al., 2013).
Creative conflict
Creative conflict is considered the best interrelationship between the three domains (Michelsen et al.,
2001). There is successful dialogue between the organic farming sector and the existing farming
institutions as they cooperate on some aspects and compete on the others (Michelsen et al., 2001). It
is considered that creative conflict creates a continuous collaboration in regard to solutions between
the three domains which are solved either by the cooperation or competition. Thus it is considered
that creative conflict would eventually bring about the change which would benefit both parties and
encourage the successful development of organic agriculture (Michelsen et al., 2001).
Step 5: Development of organic food market
It is advantageous to possess a robust national market consisting of a successful supply chain
management and network including suppliers, manufacturers, distributors and retailers in the organic
sector (Larsson et al., 2013). Additionally, there is a need for certification of organic production and a
customer base who would frequently buy organic products (Larsson et al., 2013).
Step 6: Establishment of attentive and committed institutional setting
The final step consists of the collaboration of three domains involving active participation of relevant
institutions in the organic sector to define the future goals and reduce potential barriers in regard to
the development of organic farming (Michelsen et al., 2001).
124 Materials and methods
Systematic literature reviews were conducted to compare nitrogen and phosphorous leaching
between organic and conventional farming in the European Union (RQ1). Semi-structured qualitative
interviews with 14 farmers of Lithuania were conducted to understand the challenges and benefits of
starting organic farming (RQ2). 134 consumers were surveyed to identify the possible barriers in the
development of organic farming (RQ3). In order to assess the Six Step Theory by Michelsen et al. (2001)
(RQ4) the data collected from interviews and surveys along with statistical data, grey literature and
different academic articles were analysed.
4.1 Data collection and analysis
4.1.1 Systematic literature review for nutrient leaching in organic and conventional farms
To assess if organic agricultural practices have lower nutrient (TN + TP) leaching than conventional
agriculture (RQ1), I conducted a literature review comparing organic and conventional farms around
EU countries (RQ1).
The literature review was conducted in 4 stages: 1) setting the criteria for relevant articles, 2) searching
for academic literature, 3) assessing the relevance of the study to the thesis, and 4) analysing the data.
To find relevant articles, the following criteria were set: a) an article must be comparing both organic
and conventional farming; b) it must be an academic, peer-reviewed article; c) the study must be
conducted within the EU; d) the article must be published within the period 2000-2021. I gathered
articles from databases such as Web of Science and Google Scholar while using relevant keywords
(Table 4). Articles were searched in both English and Lithuanian.
During stage 1 & 2, I selected eight articles for further in-depth analysis. The analysis was conducted
by gathering information on nutrient leaching in organic and conventional agriculture along with other
variables that could affect nutrient levels such as country, type of crop, soil, fertiliser, levels of
precipitation and depth of the soil the samples were taken from.
RQ Database platform Keyword series
RQ1 “Nutrient” AND “Leaching” AND “Organic” AND “Conventional”
Web of Science “Organic farming” AND “Conventional farming” AND “Nutrient”
“Agriculture” AND “Nutrients” AND “Lithuania”
Organic farming VS conventional farming nutrient leaching
Google Scholar
Organic farming conventional farming nitrogen phosphorus leaching
RQ2 Not applicable Not applicable
RQ3 Not applicable Not applicable
13RQ4 Web of Science “Organic farming” AND “Lithuania”
Institutional development organic farming Lithuania
Google Scholar
Institutional barriers organic farming Lithuania
Table 4. Keywords used for literature review (in English). The table aims to present the database platforms used
to search for articles and keywords that were used in order to get most of the results in order to answer RQs.
Additionally, the Appendix H shows the keywords that were used in Lithuanian language.
4.1.2 Semi-structured qualitative interviews with organic and conventional farmers
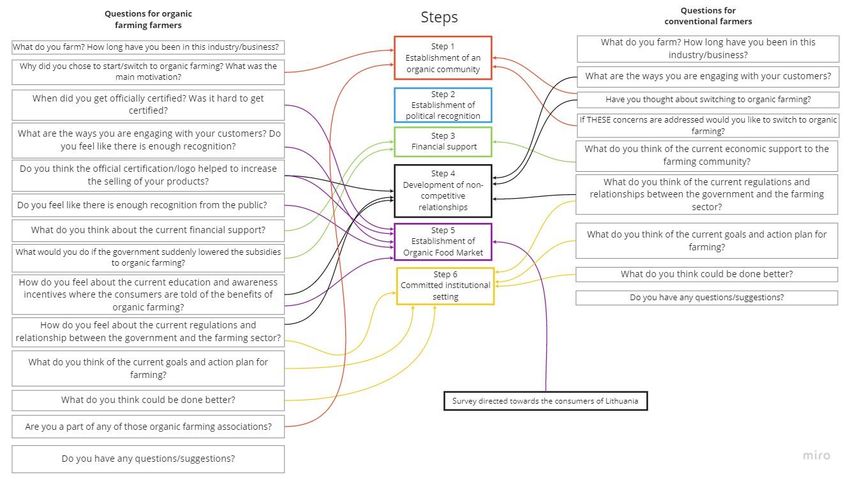
Semi-structured qualitative interviews were chosen as a method to have an effective conversation
with the interviewees. Semi-structured interviews offer a flexibility to ask additional questions and
change the order of questions to reach the goal of the study (Bryman, 2012).
The interviews with both organic and conventional farmers were conducted to answer RQ2 and RQ4.
It was used to find out the benefits of organic farming and the main barriers hindering the
establishment or transition towards organic agriculture (RQ2) while elucidating the impressions
towards governance and share opinions on overall institutional development in regard to agriculture
in Lithuania to be able to corroborate each step of the Six Step Theory by Michelsen et al. (2001) (Fig.
3) (RQ4).
The criteria for the interviewees were that the farmers were receiving area payments from the CAP
and they had to be certified (organic farmers only). The interviews followed the interview guide and
consisted of the 3 stages:
1) A general message was sheared inviting farmers to a research interview about their experiences in
regard to the agricultural activities, policies, institutional development and their relationship with the
agricultural policy and market domains in Lithuania. The message was shared on different farmer
groups on social media and sent out in emails found on farming business websites (N=22 responses).
2) A short online survey was sent to everyone who responded to the general message. The purpose of
the survey was to group the respondents into organic and conventional farmers plus collect data such
as size and type of farm, type of funding, contact details and preferred platform and date for the
interview. The second stage also included all participants agreeing to a consent form (N=17 responses).
3) Individual interviews. The interviews consisted of separate questions for organic or conventional
farmers (Fig. 3). Each interview lasted around 30-60 minutes, with a total of 7 conventional and 7
organic farmers (N=14).
Considering the current COVID-19 pandemic, the interviews were conducted online in order to ensure
the safety of both parties.
14The interviews were conducted in Lithuanian, recorded and later transcribed using Office Word Online
tool. The transcribed interviews were analysed in regard to the Six Step Theory by Michelsen et al.
(2001) (Appendix B).
Figure 3. Interview questions addressing the Six Step Theory. Created by the author.
4.1.3 Consumer survey
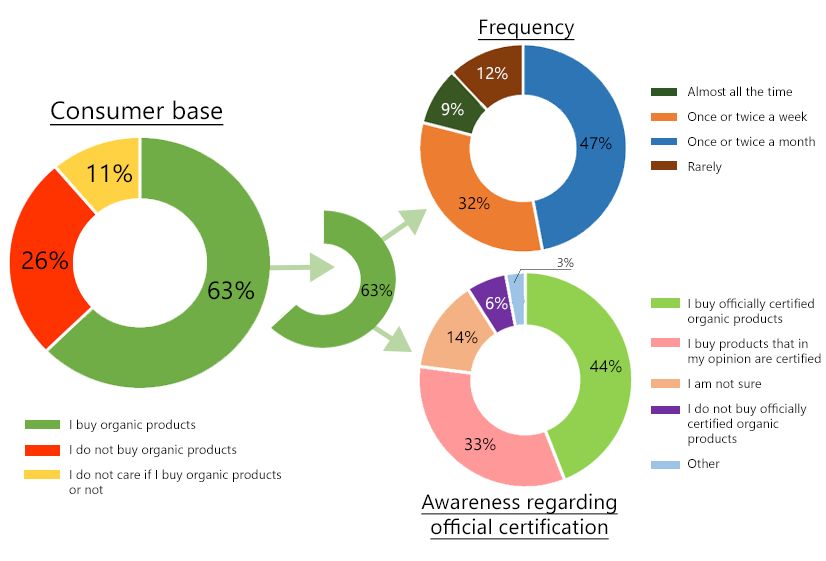
I conducted a consumer survey (Appendix C) because a strong consumer base is regarded as one of
the main factors which motivates the farmers to start organic farming. However, consumers can also
become a barrier for organic farming if the organic produce is not prioritised by them or if there is a
lack of understanding in regard to the difference between organic and other produce. Therefore, I
conducted a survey in Lithuania to reach a wide audience, irrespective of age, gender, education and
economic status. 134 individuals responded to the survey.
The consumer survey was created in order to gather data on the general understanding of consumers
in regard to organic products and organic farming in Lithuania. The responses were analysed to answer
RQ3 in order to understand the possible hindrances originating from the consumers as one of the
major barriers for the development of organic farming. The survey also helped in elucidating the level
of fulfilment of Step 5 (Development of organic food market) of the Six Step Theory (RQ4).
The survey process consisted of 2 stages:
1) General message shared on different groups on Facebook which mainly focused on diets, food and
farmer or fresh markets. The message briefly informed the individuals about the purpose of the survey.
152) The survey. The survey was created via Google Forms, consisted of 26 questions and was completely
anonymised.
4.1.4 Systematic literature review, interviews and survey for Six Step Theory
To answer RQ4 I conducted a systematic literature review directed towards institutional setting in
Lithuania to identify the possible barriers for the development of organic farming and propose
solutions. I adhered to the Six Step Theory coined by Michelsen et al. (2001) and analysed by Larsson
et al. (2013) and Moshitz et al. (2004). The data for the RQ4 was gathered using 3 methods: 1)
systematic literature review involving academic and grey literature; 2) interviews with organic and
conventional farmers; 3) consumer survey.
In order to find relevant literature the following criteria were set: a) the paper must be about Lithuania;
b) the paper should describe at least one institutional setting adhering to the Six Step Theory c) the
paper must be published within the period 2000-2021.
The literature review was conducted in 4 stages: 1) setting the criteria for relevant articles, 2) searching
for academic and grey literature, 3) assessing the relevance of the study to the thesis, and 4) analysing
the data adhering to the Six Step Theory. I selected 19 articles for further in-depth analysis.
The relevant articles were gathered from various databases such as Web of Science and Google Scholar
while using appropriate keywords (Table 4). National reports and EU documents were gathered from
various databases like Aplinkos apsaugos agentūra (EPA of Lithuania), Lietuvos Respublikos Vyriausybė
(the Government of Republic of Lithuania), Žemes ūkio Ministerija (Ministry of Agriculture) and
European Commission.
To understand the growth of organic and conventional farming in Lithuania and to determine if the
development of organic farming two institutions were contacted: 1) Žemės ūkio informacijos ir kaimo
verslo centras (Agricultural Information and Rural Business Centre) who provided the data for
conventional farming and 2) public institution Ekoagros who provided the data regarding the
development of organic farming.
To examine each step of the Six Step Theory I looked into every indicator of its characteristics (Table
2, Section 3). To determine if the step is fulfilled, partially fulfilled or unfulfilled, I looked into the level
of completion of Indicators as suggested by Larsson et al. (2013). I categorised them as: 1) Fulfilled, if
all indicators within the step were complete; 2) Partially Fulfilled, if the majority of indicators in the
step were either complete or partially complete; 3) Unfulfilled, if the majority of the indicators within
the step were incomplete.
166 Results
I compared nutrient leaching from organic and conventional farming in the EU countries (RQ1),
followed by the reports of the interviews with Lithuanian farmers showing the challenges and benefits
of organic agriculture (RQ2) and results from the consumer survey showcasing the barriers for organic
agriculture (RQ3). I presented the data on growth of organic and conventional farming in relation to
the Six Step Theory to elucidate institutional development in regard to organic farming in Lithuania
(RQ4).
5.1 Soil condition and nutrient leaching: comparing organic and conventional farming
From the eight studies comparing organic and conventional agriculture, organic farming had lower
annual leaching of both total nitrogen (TN) and total phosphorus (TP) than their conventional
counterparts in most cases (Fig. 4 & 5). In total, I found 6 case studies with 18 paired comparisons of
TN between the different farms, with all but one (17 out of 18, or 94%) showing lower leaching from
organic by a cumulative average of 38%; and 3 case studies with 8 paired comparisons of TP, with 5
(63%) showing lower leaching from organic by a cumulative average of 22%.
The largest differences between organic and conventional farming in nitrogen leaching were detected
in the sandy soils (Fig. 4). Organic pig farm & organic dairy and beef farm, both with sandy soil had 45%
and 37% lower annual nitrogen leaching levels than the conventional counterparts respectively.
Additionally, organic arable crop land with sandy soil had 60% lower nitrogen leaching. It is known that
sandy soils are one of the worst regarding nutrient or water retention but organic farms tend to have
better nutrient retention abilities even in sandy soils (Hansen et al., 2000). However, an organic dairy
farm with sandy soil demonstrated that TN leaching was 25% higher (Fig. 4) but this particular
conflicting finding was mainly due to overfertilisation and incorrect crop rotation practices (Kelm,
Loges & Taube, 2008).
Phosphorus leaching tends to be lower in organic farms (Fig. 5) as most of the leaching happens from
the top layer unlike in conventional farms where the leaching occurs across all the soil layers. Organic
wheat and carrot farm had 96% lower phosphorus leaching compared to the conventional farm (Fig.
5). The sample was taken from the lowest soil layer (around 60-80cm) under excessive precipitation.
However, the study indicated that the samples taken from the top soil layer (around 0-20cm) in organic
wheat and carrot farm indicated that the leaching was 56% higher than the same layer in conventional
farms (Fig. 5). The study demonstrated that organic farming may leach more from the top soil layer
during heavy precipitation but the lower soil layers are better at retaining nutrients in organic farming
than in conventional farming due to better soil quality (Riddle et al., 2018).
17You can also read