Lysis Profiles of Salmonella Phages on Salmonella Isolates from Various Sources and Efficiency of a Phage Cocktail against S. Enteritidis and S ...

 
CONTINUE READING
Lysis Profiles of Salmonella Phages on Salmonella Isolates from Various Sources and Efficiency of a Phage Cocktail against S. Enteritidis and S ...
microorganisms
Article
Lysis Profiles of Salmonella Phages on Salmonella
Isolates from Various Sources and Efficiency of a
Phage Cocktail against S. Enteritidis and
S. Typhimurium
Kantiya Petsong 1 , Soottawat Benjakul 1 , Soraya Chaturongakul 2 , Andrea I. Moreno Switt 3
and Kitiya Vongkamjan 1, *
 1   Department of Food Technology, Prince of Songkla University, Hat Yai 90112, Thailand;
     ann-kantiya@hotmail.com (K.P.); Soottawat.b@psu.ac.th (S.B.)
 2   Department of Microbiology, Mahidol University, Ratchathewi, Bangkok 10400, Thailand;
     soraya.cha@mahidol.ac.th
 3   Escuela Medicina Veterinaria, Facultad de Ciencias de la Vida, Universidad Andres Bello, Republica 440,
     8370251 Santiago, Chile; andrea.moreno@unab.cl
 *   Correspondence: kitiya.v@psu.ac.th; Tel.: +66-74-286-337; Fax: +66-74-558-866
                                                                                                      
 Received: 27 February 2019; Accepted: 1 April 2019; Published: 5 April 2019                          

 Abstract: Salmonella enterica serovar Enteritidis and Salmonella enterica serovar Typhimurium are major
 foodborne pathogens of concern worldwide. Bacteriophage applications have gained more interest for
 biocontrol in foods. This study isolated 36 Salmonella phages from several animal farms in Thailand
 and tested them on 47 Salmonella strains from several sources, including farms, seafood processing
 plant and humans in Thailand and USA. Phages were classified into three major groups. The estimated
 phage genome size showed the range from 50 ± 2 to 200 ± 2 kb. An effective phage cocktail consisting
 of three phages was developed. Approximately 4 log CFU/mL of S. Enteritidis and S. Typhimurium
 could be reduced. These phages revealed a burst size of up to 97.7 on S. Enteritidis and 173.7 PFU/cell
 on S. Typhimurium. Our phage cocktail could decrease S. Enteritidis on chicken meat and sunflower
 sprouts by 0.66 log CFU/cm2 and 1.27 log CFU/g, respectively. S. Typhimurium on chicken meat and
 sunflower sprouts were decreased by 1.73 log CFU/cm2 and 1.17 log CFU/g, respectively. Overall,
 animal farms in Thailand provided high abundance and diversity of Salmonella phages with the lysis
 ability on Salmonella hosts from various environments and continents. A developed phage cocktail
 suggests a potential biocontrol against Salmonella in fresh foods.

 Keywords: Salmonella phage; animal farm; phage host range; phage cocktail; Salmonella serovar;
 chicken meat; sunflower sprout

1. Introduction
      Salmonella enterica serovars Enteritidis and Typhimurium have been reported as the most common
causes of salmonellosis outbreaks related to food contamination [1]. The US Centers for Disease
Control and Prevention (CDC) reported an estimation of 1 million domestically acquired salmonellosis
cases with 19,000 hospitalizations and 380 deaths [2]. Animal farms are typically associated with
the presence of diverse Salmonella serovars [3,4]. The environments around farms such as feedstuff,
soil, water, and feces are common sources of Salmonella [4]. Distribution of Salmonella on farms
leads to the likelihood of Salmonella contamination in various food of animal origin and produce.
Salmonella serovars predominantly present in food can be differed, for example, serovars Enteritidis and
Typhimurium are common in eggs [5], serovars Kentucky and Enteritidis are common in poultry [6],

Microorganisms 2019, 7, 100; doi:10.3390/microorganisms7040100          www.mdpi.com/journal/microorganisms
Microorganisms 2019, 7, 100                                                                          2 of 18

serovars Newport, Infantis and Javiana are common in fruits and vegetables [7]. The environments
of food processing plant have been linked to occurrence of diverse Salmonella serovars. For example,
serovars Weltevreden [8,9], Anatum, Enteritidis, Newport, and Typhimurium have been previously
detected in wastewater from the plant [10]. Salmonella serovars predominant in human are also of
crucial concern. These include Salmonella serovars Weltevreden, Enteritidis and Anatum which have
been reported as the most common serovars isolated from human in Thailand [11]. The occurrence of
Salmonella contaminated in poultry meat has been often reported [12]. Fresh produce such as sprout
has also been reported as the high risk food that is commonly been contaminated by Salmonella [12,13].
Control of Salmonella in both food categories is thus crucial.
     Bacteriophages (phages) are viruses of bacteria which are adapted to be very specific for infecting
and killing bacterial hosts [14]. The habitat of phages is normally related to their hosts as predator and
prey [15]. Phage application as a biocontrol agent against pathogens has been reported the outstanding
properties over antibiotics (e.g., specificity to target hosts) [14] or chemical agents which are commonly
used in meat products and may have some negative effects on human health [16]. Certain phages
have been shown to have minimal effects on the change of quality and sensory properties of specific
foods [17]. To improve the antibacterial efficiency and avoid phage-resistant bacteria from using
phage-based biocontrol, phage cocktail is an alternative approach. Several studies have reported
the success in using effective phage cocktails to control Salmonella serovars in various food products,
including raw meat, fresh produce and ready-to-eat foods [18–20].
     Phage abundance and diversity recovered from particular sources can provide a better understanding
on the phage-host relationship. Phage lysis profiles obtained from testing phages against Salmonella
strains from various sources are useful information for further development of phage-based control for
targeting Salmonella serovars predominant in different sources. This study aimed to isolate Salmonella
phages from animal farms (poultry, swine, goat and bovine) in Thailand and investigate phage lysis profiles
on Salmonella strains from at least two geographical regions (Thailand and USA) isolated from different
sources, including animal farms, food processing plants and humans that have a history of Salmonella
infection. Phages presenting the highest lysis ability against the two most common Salmonella serovars
(Enteritidis and Typhimurium) were further developed as a phage cocktail. One-step growth curves of
all phages included in the cocktail were studied to determine phage biology including latent period and
burst size. Our developed phage cocktail was evaluated the effectiveness in reducing S. Enteritidis and S.
Typhimurium in vitro and in fresh foods (raw chicken meat and sunflower sprouts) during storage at 4 ◦ C.

2. Materials and Methods

2.1. Sample Collection
      A total of 12 samples were collected from six animal farms, including poultry, swine, goat, and
bovine farms in Songkhla province, Thailand between January 2014 and October 2016. Of six farms,
three of which were commercial farms (poultry, swine and goat) and three others were free range
farms (poultry and bovine). Approximately 500 g of each randomly selected sample (feces, feed, soil
and drinking water) was collected using a sterile spatula and transferred to a sterile bag. Feces samples
were collected from the floor inside the pens of the commercial farms where animals resided. For
free range farms, feces samples were collected from random open areas where animals resided. Feed
samples were taken from the storage containers freshly prepared for feeding animals. Soil samples
were taken from the free range farms only and from random open areas where animals resided.
Drinking water in farms was also collected. Each sample was kept in a cooler box containing ice packs
and transferred to a laboratory. Collected samples were stored at 4 ◦ C until analysis in the laboratory.

2.2. Bacterial Strains Used in the Study
     Salmonella strains used in this study consisted of 47 Salmonella strains presenting 28 common serovars
(Table 1). All Salmonella strains tested were the representative of predominant serovars isolated from
Microorganisms 2019, 7, 100                                                                                 3 of 18

various sources, including animal farms, food processing plants and humans in Thailand and USA. A total
of 23 strains of Salmonella isolated from animal farms and human in the USA were obtained from Food
Safety Laboratory, Cornell University (indicated with a prefix of “FSL”). Other 24 strains of Salmonella
were previously isolated from animal farms, food processing plants and humans in Thailand. These were
obtained from the Faculty of Microbiology, Mahidol University and the Faculty of Agro-Industry, Prince
of Songkla University, Thailand (indicated with a prefix of “PSU-BS-”). Salmonella strains were kept in
15% glycerol at −80 ◦ C as working stocks. For overnight culture, an isolated colony of Salmonella from
Tryptone Soya Agar (TSA; Oxoid, Hampshire, UK) was transferred in 5 mL of Tryptone Soya Broth (TSB;
Oxoid, Hampshire, UK) and incubated at 37 ◦ C for 16–18 h.

          Table 1. Salmonella strains used for phage isolation and determination of phage lysis profiles.

                                Serovars           Isolates ID                Source (Country)
                                 Agona              H2-016 *            Pig slaughterhouse (Thailand)
                                                   FSL S5-667                   Bovine (USA)
                                                                          Seafood processing plant
                                Anatum            PSU-BS-104SL
                                                                                 (Thailand)
                                                   FSL A4-525 *                 Bovine (USA)
                              Braenderup            FSL S5-373                  Human (USA)
                                 Cerro              FSL R8-242                  Bovine (USA)
                               Corvolis           PSU-BS-092SL             Animal farm (Thailand)
                                                    FSL R8-092                  Human (USA)
                                Dublin               W1-016                 Dairy farm (Thailand)
                                                    FSL S5-368                  Bovine (USA)
                               Enteritidis          FSL S5-371                  Human (USA)
                                 Give             PSU-BS-181SL             Animal farm (Thailand)
                                                     H2-018 *               Dairy farm (Thailand)
                               Heidelberg           FSL S5-455                  Human (USA)
                                Infantis            FSL S5-506                  Human (USA)
                                Javiana             FSL S5-406                  Human (USA)
                               Kedougou               H2-061            Pig slaughterhouse (Thailand)
                               Kentucky              W1-010 *               Dairy farm (Thailand)
                                                  PSU-BS-058SL             Chicken farm (Thailand)
                                                                          Seafood processing plant
                                                  PSU-BS-116SL
                                                                                 (Thailand)
                                                   FSL S5-431                   Bovine (USA)
                                                                          Seafood processing plant
                                Krefeld           PSU-BS-111SL
                                                                                 (Thailand)
                               Mbandaka              W1-015                 Dairy farm (Thailand)
                                                  PSU-BS-035SL             Chicken farm (Thailand)
                                                   FSL A4-793                   Bovine (USA)
                              Montevideo           FSL S5-474                   Bovine (USA)
                                                   FSL S5-403                   Bovine (USA)
                               Muennster           FSL S5-917                   Bovine (USA)
                               Newport             FSL S5-548                   Bovine (USA)
                              Oranienburg          FSL R8-376                   Human (USA)
                                                                          Seafood processing plant
                                Ordonez           PSU-BS-181SL
                                                                                 (Thailand)
                                Panama             FSL S5-454                   Human (USA)
                                 Rissen              H2-015             Pig slaughterhouse (Thailand)
                               Saintpaul           FSL S5-369                   Human (USA)
                                Stanley           PSU-BS-001SL              Swine farm (Thailand)
                                                    H2-002 *            Pig slaughterhouse (Thailand)
                                                                          Seafood processing plant
                                                PSU-BS-041SALX
                                                                                 (Thailand)
                                                   FSL S5-464                   Human (USA)
                                                                          Seafood processing plant
                               Tennessee          PSU-BS-183SL
                                                                                 (Thailand)
                              Typhimurium           H2-001 *            Pig slaughterhouse (Thailand)
                                                  PSU-BS-014SL             Chicken farm (Thailand)
                                                   FSL S5-370                   Human (USA)
                                Virchow           FSL H2-117 *                Human (Thailand)
                                                   FSL S5-961                   Human (USA)
                              Weltevreden            H2-031             Pig slaughterhouse (Thailand)
                                                  PSU-BS-013SL             Chicken farm (Thailand)
                                                   FSL R8-798                   Human (USA)
                         * indicates strains of Salmonella used as hosts for Salmonella phage isolation.
Microorganisms 2019, 7, 100                                                                       4 of 18

2.3. Isolation and Purification of Salmonella Phages
      Salmonella phages were isolated using enrichment isolation with a multi-strain Salmonella cocktail
whose serovars are shown to be predominant in Thai animal farms (Agona H2-016, Anatum A4-525,
Give H2-018, Kentucky W1-010, Stanley H2-002, Typhimurium H2-001, and Virchow H2-117) [11,21].
Briefly, 25 g of each sample was enriched with 225 mL of TSB and 2.5 mL of host mixture. After
filtration of the mixture through 0.45 µm and 0.22 µm syringe filters, filtrate (100 µL) was used to
prepare the double layer by mixing with each host strain previously grown in TSB for 16–18 h at 37 ◦ C.
For each overlay, 300 µL of the 1:10 dilution of the overnight host strain was mixed with 4 mL of 0.7%
TSA, followed by incubation at 37 ◦ C for 18–24 h. Plaques were observed on each host lawn. A distinct
isolated plaque was selected and suspended in 300 µL of Phosphate Buffered Saline (PBS, (pH 7.4),
137 mM NaCl, 2.7 mM KCl, 4.3 mM Na2 HPO4 , 1.4 mM KH2 PO4 ) for purification. Serial dilutions were
performed and appropriate dilution was subjected to three passages with a specific host that showed a
positive result, using a double layer agar technique [4].

2.4. Lysate Preparation and Titer Determination of Salmonella Phages
     An isolated plaque from the third purification passage was used to prepare 10-fold serial
dilutions in PBS. Appropriate dilutions were used to prepare the overlay with a given host to yield
semi-confluent lysis. Overlay was harvested with 10 mL of Salt-Magnesium buffer (SM buffer),
followed by centrifugation at 3213× g for 15 min at 4 ◦ C. Supernatant was filtered through a 0.22 µm
syringe filter and phage lysates were kept at 4 ◦ C. Each phage lysate was serially diluted in PBS
and 100 µL of each dilution was mixed with 300 µL of host, then the mixture was poured on bottom
agar [22]. Phage titers were determined after incubation at 25 ◦ C for 16–18 h by counting plaques
present on each plate of a given dilution [22].

2.5. Determination of Lysis Profiles of Salmonella Phages
      Lysis profile for each phage was determined by a spot test on bacterial lawn of a given Salmonella
strain in the collection included in this study. Briefly, 5 µL of each phage lysate representing
108 PFU/mL were spotted on the bacterial host lawn prepared as mentioned above but without
filtrate. Phage lysis patterns were determined after 18–24 h of incubation at 25 ◦ C. The experiment was
performed in independent triplicates. Phage lysis patterns were analyzed by converting a positive lysis
(zone of lysis on a spot) to a score of 1 and negative results were converted to a score of 0. A heatmap
representing lysis groups was generated by cluster analysis, following Vongkamjan et al. [22] with
Ward’s method of binary distance, using the R software program (R development Core Team 2012 [23].

2.6. Genome Size Determination of Salmonella Phages
     Representative Salmonella phages from each sample source were selected for genome size
determination. A total of 17 phage isolates were included for Pulsed-Field Gel Electrophoresis (PFGE)
analysis. Agarose plugs were prepared by mixing equal volume (55 µL) of a given phage lysate with
high titer of approximately 106 –108 PFU/mL and 1.3% low melting point agarose. Plugs were kept
at low temperature (4 ◦ C) in order to solidify for 1 h. Plugs were loaded into 1% agarose gel and
electrophoresis was performed in 0.5X TBE buffer using CHEF-DR III system (Bio-Rad, Hercules, CA,
USA). PFGE was performed for 20 h with 0.5–5 s of switch time. Two size markers were included;
CHEF DNA size standard of 8–48 kb ladder and CHEF DNA size standard lambda λ ladder 0.05–1 Mb
(both from Bio-Rad, Hercules, CA, USA) [4,22].

2.7. Development of a Phage Cocktail Targeting Two Major Salmonella Serovars
    To develop a Salmonella phage cocktail against S. Enteritidis and S. Typhimurium, nine phages
which showed the strong lysis ability on S. Enteritidis and S. Typhimurium (KP1, KP2, KP4, KP5,
KP9, KP34, KP36, KP49, and KP50) were ordered their lysis ability by a spotting test and efficiency of
Microorganisms 2019, 7, 100                                                                             5 of 18

plating (EOP) using method modified from previous study [24]. In this study, S. Enteritidis FSL S5-371
and S. Typhimurium H2-001 were used as the target hosts. S. Anatum FSL A4-525 was used as the
reference host of phages KP1, KP2, KP5 and KP9. S. Virchow H2-117 was used as the reference host of
phages KP34 and KP36. S. Agona H2-016 was used as the reference host of phages KP49 and KP50.
Three Salmonella phages which showed the highest lysis ability were selected to prepare a cocktail
using a ratio of 1:1:1 for each phage.

2.7.1. Spotting Assay
      Each Salmonella phage dilutions ranging in concentration from 103 –107 PFU/mL were spotted on
bacterial lawn of S. Enteritidis or S. Typhimurium prepared as mentioned above. Immediately after
spotting, the plates were incubated at 25 ◦ C for 16–18 h. The clear zone or visible plaques formed by
serial dilutions on the plate were determined as +++, confluent lysis (clear spot); ++, semi-confluent
lysis (semi-clear); +, turbidity without plaque formation. The experiment was repeated three times for
each phage.

2.7.2. Efficiency of Plating (EOP) Assay
     Similar to a spotting assay, each Salmonella phage dilution ranging in concentrations from
103 –107 PFU/mL were spotted on bacterial lawn of S. Enteritidis or S. Typhimurium. EOP assay
replicates for a particular phage were done in parallel on both reference and target hosts. The EOP
was calculated by the ratio of the average PFU on a target host to the average PFU on a corresponding
reference host. EOP values were presented in 3 levels; high production (EOP ≥ 0.5), medium
production (0.01 ≤ EOP < 0.5) and low production (0.0001 < EOP < 0.01).

2.8. One-Step Growth Curve
      A one-step growth curve for three phages included in the phage cocktail were investigated
following a protocol of Bao et al. [25] with modifications. The bacterial hosts S. Enteritidis and
S. Typhimurium grown overnight (107 CFU/mL) in TSB as mentioned above were mixed with
108 PFU/mL and 109 PFU/mL of phage to a final volume of 30 mL to represent the multiplicity
of infection (MOI) of 10 and 100, respectively. The co-culture was incubated at 37 ◦ C (220 rpm) for an
initial attachment for 20 min, followed by centrifugation of the sample at 6000× g for 10 min at 4 ◦ C to
remove the excess phage as the supernatant. Cell pellets were re-suspended with the same volume
(30 mL) as pre-centrifugation with TSB and resumed to incubation for additional 60 min. Lysate (1 mL)
was taken every 5 min for the standard plaque count assay (in triplicates) to determine the number
of phages obtained from each period. Latent period was defined as the time interval between the
adsorption (not including 20 min of pre-incubation) and the beginning of the first burst, as indicated
by the initial rise in the phage titer. Burst size was calculated as the ratio of the final count of liberated
phage particles to the initial count of infected bacterial cells during the latent period.

2.9. Efficiency of Phage Cocktail to Reduce S. Enteritidis and S. Typhimurium In Vitro and Evaluation of
Phage-Resistance in Salmonella after Treated with Phage Cocktail
     An overnight culture of S. Enteritidis and S. Typhimurium prepared as mentioned above (10 mL)
was separately centrifuged at 6000× g for 10 min at 4 ◦ C. To wash cell pellets, 5 mL of PBS were added
and centrifuged at the same conditions three times. Washed Salmonella pellets were suspended in TSB
and diluted to approximately 105 CFU/mL. Phage cocktail stock was diluted with TSB to achieve
phage concentration at 107 PFU/mL. Each Salmonella strain suspension and phage cocktail preparation
were mixed at a ratio of 1:1 by volume and incubated at 37 ◦ C in a shaking incubator (ThermoStableTM
IS-30 model, DAIHAN Scientific, Gangwon-do, Korea) at 220 rpm for 12 h. Controls included in the
study were only S. Enteritidis and S. Typhimurium cultured in TSB. The cell numbers of S. Enteritidis
and S. Typhimurium from the treatments and controls at each temperature tested were enumerated
Microorganisms 2019, 7, 100                                                                       6 of 18

every 4 h interval by a spread plate on TSA. After 12 h of experiment, samples were collected for the
analyses of phage resistance.
     The changes in resistance phenotype of S. Enteritidis and S. Typhimurium after treated with a
phage cocktail were evaluated by a spotting test. Five colonies of S. Enteritidis and S. Typhimurium
from controls and treatments of phage cocktail recovered from TSA after 12 h of experiment above
were re-cultured in TSB, followed by incubation at 37 ◦ C for 16–18 h. Each culture was used to prepare
an overlay for a spotting test. Serial dilutions (103 –107 PFU/mL) of phage cocktail and each individual
phage mixed in a cocktail were spotted on each bacterial lawn. Phage lysis patterns were determined
after 18–24 h of incubation at 25 ◦ C.

2.10. Efficiency of Phage Cocktail to Reduce S. Enteritidis and S. Typhimurium in Foods
      Chicken meat and sunflower sprouts were selected as representative foods which commonly have
Salmonella contamination. Samples were purchased from the supermarkets in Hat Yai, Thailand.
To eliminate Salmonella that may be present, the samples were soaked in 50 ppm free chlorine
concentration solution for 5 min [26]. Subsequently, the samples were soaked and washed in sterile
distilled water for 5 min for 3 times. Chicken breast was aseptically cut into pieces of approximately
5 × 5 cm2 and sunflower sprout was aseptically weight approximately 5 g. Overnight culture of
S. Enteritidis and S. Typhimurium was prepared. Cell pellets were suspended with PBS and diluted
to obtain the final concentration of 105 CFU/mL. One milliliter of each Salmonella strain was evenly
spiked to the surface of each piece of chicken breast and sunflower sprout in a sterile Whirl-Pak bag to
achieve the inoculation level of approximately 105 CFU/piece or 105 CFU/5 g. Samples were left on
clean bench for 10 min to allow the cells to adapt to the conditions on food samples tested. A phage
cocktail preparation (1 mL containing 107 PFU/mL) was evenly spiked to each piece of chicken and
sunflower sprout in a sterile Whirl-Pak bag. PBS buffer (1 mL) was added to sample inoculated with
Salmonella as control. Treatments and control were stored at 4 ◦ C. Number of Salmonella cells was
enumerated on day 0, 1, 2, 3, and 4 on Xylose-Lysine-Desoxycholate agar (XLD; Oxoid, Hampshire,
UK).

2.11. Statistical Analysis
     Differences of the bacterial counts between control and treatment by a phage cocktail in this
study were analyzed by Student’s t-test for both in vitro and in food models. The Analysis of variance
(ANOVA) was used to compare differences between the storage period for a given strain. Comparison
of means was carried out by Duncan’s multiple range tests. Significance was declared at p < 0.05 using
the statistical Package for Social Science (SPSS 10.0 for windows, SPSS Inc., Chicago, IL, USA).

3. Results

3.1. Recovery of Salmonella Phages from Various Animal Farms in Thailand
     Of 12 samples collected from three sampling visits to various animal farm environments in
Songkhla province, Thailand, 36 Salmonella phages were obtained (Table 2). Three samples from
sampling visit 1 from commercial farms represented two phages. Vast numbers of phages (34 phages)
were obtained from the other 9 samples from two samplings at free range farms. Genome sizes of
representative phages from different animal farms and different sources were estimated by PFGE
analysis. Of the 17 representative phages, isolated phages from feces, feed, soil and drinking water
from poultry farms, they showed an estimated genome size in the range of 50 ± 2 kb to 105 ± 2 kb
(Table 3). An estimated genome size of 200 ± 2 kb was observed in phages isolated from goat feces.
Whereas, phages isolated from bovine feces showed an estimated genome size of 50 ± 2 kb and
60 ± 2 kb. Overall, phages isolated in this study showed an estimated genome size in the range of
50 ± 2 kb to 200 ± 2 kb.
Microorganisms 2019, 7, 100                                                                            7 of 18

                  Table 2. Recovery of Salmonella phages from various animal farms in Thailand.

           Animal Farms (Sampling Date [mo/yr])             Number of Sample (Number of Phages)
         Sampling 1 (04/2014)
                 Poultry farm; commercial                                    1 (1)
                  Swine farm; commercial                                     1 (0)
                   Goat farm; commercial                                     1 (1)
         Sampling 2 (08/2015)
                  Bovine farm; free range                                   1 (3)
                  Poultry farm; free range                                  4 (15)
         Sampling 3 (10/2016)
                  Poultry farm; free range                                   4 (16)
                            Total                                           12 (36)

     Table 3. Estimated genome size of representative Salmonella phages from various animal farms in
     this study.

           Salmonella Phage ID                     Source                 Estimated Genome Size (kb)
       KP3                             Goat feces                                     200 ± 2
       KP4                             Soil (poultry farm 2)                          105 ± 2
       KP5                             Poultry feces (poultry farm 3)                  60 ± 2
       KP6                             Poultry feed (poultry farm 2)                   72 ± 2
       KP7                             Soil (poultry farm 2)                           60 ± 2
       KP10                            Poultry feed (poultry farm 2)                   60 ± 2
       KP11                            Soil (poultry farm 2)                           60 ± 2
       KP34                            Poultry feces (poultry farm 1)                  60 ± 2
       KP38                            Bovine feces                                    60 ± 2
       KP39                            Bovine feces                                    50 ± 2
       KP41                            Drinking water (poultry farm 3)                97 ± 2
       KP43                            Poultry feces (poultry farm 3)                  60 ± 2
       KP49                            Soil (poultry farm 3)                           60 ± 2
       KP50                            Poultry feces (poultry farm 3)                 103 ± 2
       KP53                            Poultry feces (poultry farm 3)                  50 ± 2
       KP54                            Soil (poultry farm 3)                           50 ± 2
       KP55                            Poultry feed (poultry farm 3)                   60 ± 2

3.2. Lysis Profiles of Salmonella Phages from Animal Farms on Salmonella Strains from Various Sources in
Thailand and USA
      All 36 Salmonella phages obtained in this study were tested on 47 Salmonella strains representing
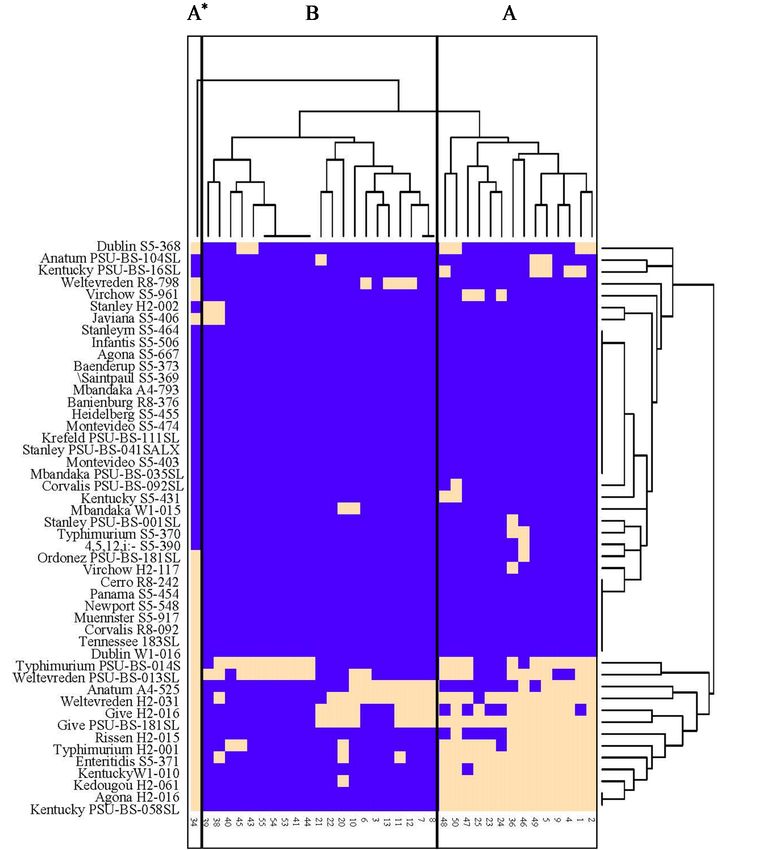
28 serovars. These phages were classified into three groups based on the host range, including (A)
broad, (B) narrow and (A*) special broad host range (Figure 1). In group A, 14 phages showed strong
lysis ability with Salmonella strains from Thailand but lower weaker lysis ability with Salmonella strains
from USA However, several phages showed ability to lyse Salmonella strains from both continents and
different sources. In group B, 21 phages showed the ability to lyse Salmonella strains mostly isolated
from Thailand, especially Salmonella isolated from animal farms. One unique phage (KP34) isolated
from a commercial poultry farm was classified into the special broad host range group. This phage
showed the broadest host range among isolated phages with the ability to lyse over 60% of Salmonella
strains from Thailand and 48% of Salmonella strains from USA Overall, phages isolated in this study
presented different spectrum to lyse host strains from both continents and different sources.
Microorganisms 2019, 7, 100                                                                                         8 of 18
 Microorganisms 2019, 7, x                                                                                            8 of 18

        Figure
      Figure 1. 1.Heatmap
                   Heatmaprepresentation
                              representationofoflysis
                                                  lysisprofiles
                                                       profiles of
                                                                of 36
                                                                   36 Salmonella
                                                                      Salmonella phages tested
                                                                                         tested (vertical
                                                                                                 (verticalaxis)
                                                                                                           axis)onon47
      47Salmonella
         Salmonellahost
                     host strains
                          strains (horizontal
                                  (horizontal axis) from Thailand
                                                            Thailand and
                                                                       andUSA
                                                                           USAPhages
                                                                                 Phageswere
                                                                                         wereclassified
                                                                                               classifiedinto
                                                                                                           into  three
                                                                                                              three
        groups,
      groups,    including
              including   (A)(A) broad,
                               broad,  (B)(B) narrow
                                            narrow    and
                                                    and   (A*)
                                                        (A*)    special
                                                              special   broad
                                                                      broad   host
                                                                            host   range.
                                                                                 range.   Beige
                                                                                        Beige    areas
                                                                                              areas     indicate
                                                                                                     indicate     lysis
                                                                                                               lysis
        and
      and   darker
          darker     areas
                   areas    indicate
                         indicate nono   lysis.
                                      lysis.

3.3.
  3.3.Phage
       PhageSusceptibility
             Susceptibilityof of
                              Different  Salmonella
                                 Different          Serovars
                                           Salmonella        from
                                                      Serovars    Various
                                                               from       Sources
                                                                    Various Sources
     All
       All3636 Salmonella  phages obtained
               Salmonella phages      obtainedininthisthis  study
                                                         study  werewere    tested
                                                                       tested  on 47on  47 Salmonella
                                                                                     Salmonella   strains strains   of
                                                                                                           of different
different  major  serovars  previously    isolated  from   the environments      related to
  major serovars previously isolated from the environments related to animal farms, animal  animal    farms,  animal
slaughterhouse
  slaughterhouse  and
                    andfood
                         foodprocessing
                               processing  plant
                                             plantand
                                                    and from
                                                          fromhumans.
                                                                humans.  High
                                                                           High susceptibility
                                                                                  susceptibilitytoto
                                                                                                   phage
                                                                                                      phage lysis was
                                                                                                              lysis was
observed   among   Salmonella  strains  mostly  isolated   from  animal   farms  and  slaughterhouse
  observed among Salmonella strains mostly isolated from animal farms and slaughterhouse in              in Thailand
(Table 4), including
  Thailand    (Table serovars   Agona,
                      4), including      Give, Kedougou,
                                       serovars               Kentucky,
                                                   Agona, Give,            Typhimurium
                                                                     Kedougou,             and Weltevreden.
                                                                                    Kentucky,    TyphimuriumTwo     and
additional  strains showing   high  susceptibility   to phage  lysis included   serovars  Anatum
  Weltevreden. Two additional strains showing high susceptibility to phage lysis included serovars   and  Enteritidis.
Other  five and
  Anatum     serovars,  including
                  Enteritidis.      Kentucky,
                                Other             Rissen,including
                                        five serovars,      Dublin, Virchow
                                                                        Kentucky,andRissen,
                                                                                      Weltevreden
                                                                                             Dublin,from      diverse
                                                                                                         Virchow    and
sources  from  both  Thailand  and  USA    presented    medium    susceptibility  to phage  lysis.
  Weltevreden from diverse sources from both Thailand and USA presented medium susceptibility to   Several   serovars
showed
  phage low
          lysis.susceptibility to phage
                 Several serovars    showedlysis.
                                               lowHowever,     among
                                                     susceptibility   toserovars   classified
                                                                         phage lysis.         in this
                                                                                        However,        group,serovars
                                                                                                     among       most
Salmonella  strains were  isolated  from    USA   These   included   serovars   Agona,   Braenderup,
  classified in this group, most Salmonella strains were isolated from USA These included serovars       Heidelberg,
  Agona, Braenderup, Heidelberg, Infantis, Javiana, Kentucky, Mbandaka, Montevideo, Muenster,
  Newport, Oranienburg, Panama, Saintpaul, Stanley and Typhimurium.
Microorganisms 2019, 7, 100                                                                                            9 of 18

Infantis, Javiana, Kentucky, Mbandaka, Montevideo, Muenster, Newport, Oranienburg, Panama,
Saintpaul, Stanley and Typhimurium.

          Table 4. Phage susceptibility of different Salmonella serovars recovered from various sources.

                                                                            % Susceptibility (Level) a
                    Serovars                     Source
                                                                           Thailand                 USA
             Agona                     Pig slaughterhouse              41.7 (H)              -
             Anatum                    Bovine                          -                     41.7 (H)
             Enteritidis               Human                           -                     50.0 (H)
             Give                      Animal farm                     63.9 (H)              -
                                       Dairy farm                      50.0 (H)              -
             Kedougou                  Pig slaughterhouse              44.4 (H)              -
             Kentucky                  Dairy farm                      38.9 (H)              -
                                       Chicken farm                    41.7 (H)              -
             Typhimurium               Pig slaughterhouse              47.2 (H)              -
                                       Chicken farm                    55.6 (H)              -
             Weltevreden               Pig slaughterhouse              69.4 (H)              -
                                       Chicken farm                    58.3 (H)              -
             Dublin                    Bovine                          -                     19.4 (M)
             Kentucky                  Seafood processing plant        13.9 (M)              -
             Rissen                    Pig slaughterhouse              27.8 (M)              -
             Virchow                   Human                           -                     11.1 (M)
             Weltevreden               Human                           -                     13.9 (M)
             Agona                     Bovine                          -                     No lysis
             Anatum                    Seafood processing plant        8.3 (L)               -
             Braenderup                Human                           -                     No lysis
             Cerro                     Bovine                          2.8 (L)               -
             Corvalis                  Animal farm                     2.8 (L)               -
                                       Human                           2.8 (L)               -
             Dublin                    Dairy farm                      2.8 (L)               -
             Heidelberg                Human                           -                     No lysis
             Infantis                  Human                           -                     No lysis
             Javiana                   Human                           -                     8.3 (L)
             Kentucky                  Bovine                          -                     5.6 (L)
             Krefeld                   Seafood processing plant        No lysis              -
             Mbandaka                  Dairy farm                      5.6 (L)               -
                                       Chicken farm                    No lysis              -
                                       Bovine                          -                     No lysis
             Montevideo                Bovine                          -                     No lysis
                                       Bovine                          -                     No lysis
             Muennster                 Bovine                          -                     2.8 (L)
             Newport                   Bovine                          -                     2.8 (L)
             Oranienburg               Human                           -                     No lysis
             Ordonez                   Seafood processing plant        5.6 (L)               -
             Panama                    Human                           -                     2.8 (L)
             Saintpaul                 Human                           -                     No lysis
             Stanley                   Swine farm                      2.8 (L)               -
                                       Pig slaughterhouse              5.6 (L)               -
                                       Seafood processing plant        No lysis              -
                                       Human                           -                     No lysis
             Tennessee                 Seafood processing plant        2.8 (L)               -
             Typhimurium               Human                           -                     5.6 (L)
             Virchow                   Human                           5.6 (L)               -
     a Phage susceptibility level defined by % of total phages that could lyse each host strain (n = 36): 31% (High; H). If no strain tested, ‘-’ is shown in table.
Microorganisms 2019, 7, 100                                                                                                   10 of 18

3.4. Development of a Phage Cocktail
      Of 36 isolated Salmonella phages evaluated for a lysis profile, 9 phages showed strong lysis
ability on S. Enteritidis and S. Typhimurium. Based on the highest EOP, three phages (KP4, KP5 and
KP50) were selected for the development of a phage cocktail (Table 5). Each phage composed in a
phage cocktail preparation showed the latent period on S. Enteritidis as 5, 15 and 40 min at MOI
100, and 10, 15 and 10 min at MOI 10 for phages KP4, KP5 and KP50, respectively (Table 6, Figure 2).
On S. Typhimurium, these phages showed the latent period of 10, 10 and 15 min at MOI 100, and 15,
15 and 10 min at MOI 10 for phages KP4, KP5 and KP50, respectively. Phages KP4, KP5 and KP50
included in a phage cocktail preparation showed large burst sizes as 25.1, 30.1 and 97.7 PFU/cell,
respectively on S. Enteritidis at MOI 100. At MOI 10, the burst sizes of phages KP4, KP5 and KP50
on S. Enteritidis were observed as 16.6, 6.6 and 37.1 PFU/cell, respectively. On the S. Typhimurium
host, the burst size of phages KP4, KP5 and KP50 was observed as 70.8, 173.7 and 112.2 PFU/cell,
respectively at MOI 100, and 19.1, 19.1 and 28.8 PFU/cell, respectively at MOI 10.

     Table 5. Lysis ability and efficiency of plating (EOP) of Salmonella phages on S. Enteritidis and
     S. Typhimurium.

                        Reference            Target                         Lysis Ability a
      Salmonella                                                                                                   Level of
                        Salmonella         Salmonella                 Phage Titer (PFU/mL)
        Phage                                                                                                       EOP b
                         Serovar            Serovar
                                                           107        106        105          104    103
                          Anatum           Enteritidis    +++          ++         -          -       -             Medium
             KP1
                          (A4-525)         Typhimurium     ++           -         -          -       -             Medium
                          Anatum           Enteritidis    +++         +++        ++          -       -             Medium
             KP2
                          (A4-525)         Typhimurium    +++          ++         -          -       -              Low
                          Anatum           Enteritidis    +++         +++       +++         +        -             Medium
             KP4
                          (A4-525)         Typhimurium    +++         +++       +++          +       -             Medium
                          Anatum           Enteritidis    +++         +++       +++         +        -             Medium
             KP5
                          (A4-525)         Typhimurium    +++         +++        ++          -       -             Medium
                          Anatum           Enteritidis    +++         +++       +++         ++       -              High
             KP9
                          (A4-525)         Typhimurium    +++           +         -          -       -              Low
                          Virchow          Enteritidis    +++         +++        ++          -       -             Medium
            KP34
                          (H2-117)         Typhimurium     ++           -         -          -       -              Low
                          Virchow          Enteritidis    +++         +++       +++         ++       -             Medium
            KP36
                          (H2-117)         Typhimurium     ++           -         -          -       -              Low
                           Agona           Enteritidis     ++           -         -          -       -              Low
            KP49
                          (H2-016)         Typhimurium     ++           -         -          -       -              Low
                           Agona           Enteritidis    +++         +++     +++        +++         +              High
            KP50
                          (H2-016)         Typhimurium    +++         +++     +++         +          -             Medium
      a Clear zone or visible plaques were observed as +++, confluent lysis (clear spot); ++, semi-confluent lysis
      (semi-clear); +, turbidity without plaque formation. b EOP values were presented in 3 levels: high production (EOP
      ≥ 0.5), medium production. (0.01 ≤ EOP < 0.5) and low production (0.0001 < EOP < 0.01).

          Table 6. Latent period and burst size of Salmonella phages included in a phage cocktail preparation.

                                   Latent Period (min)                                   Burst Size (PFU/Cell)
   Salmonella
    Phage ID              S. Enteritidis         S. Typhimurium                  S. Enteritidis            S. Typhimurium
                      MOI 100      MOI 10       MOI 100      MOI 10          MOI 100      MOI 10      MOI 100          MOI 10
          KP4             5           10          15             10            25.1           16.6          70.8         19.1
          KP5            15           15          10             15            30.1            6.6         173.7         19.1
          KP50           40           10          15             10            97.7           37.2         112.2         28.8
Microorganisms 2019, 7, x
       Microorganisms
Microorganisms 2019, 7,2019,
                        x    7, 100                                                                                                                                                  11 of 1811 of 18
       Microorganisms 2019, 7, x                                                                                                                                                             11 of 18
                                                                                                                                                                                    A-1
                                                                                                                                                                                                                                      KP4
    A-1 A-1                                                                                                                                                                        B-1 B-1                              9
                                                                           KP4                                                                                 KP4
                                       9                                          KP4                                    9                                           KP4
                                                                    9                                                                                  9

                                                                                                                                                                                               Phage titer (PFU/mL)
                                                                                                                                                                                                                        8

                                                                                                  Phage titer (PFU/mL)
              Phage titer (PFU/mL)

                                       8                                                                                 8

                                                                                                                                Phage titer (PFU/mL)
                                           Phage titer (PFU/mL)     8                                                                                  8
                                                                                                                                                                                                                        7
                                       7                                                                                 7
                                                                    7                                                                                  7
                                                                                                                                                                                                                        6
                                       6                                                                                 6
                                                                    6                                                                                  6                                                                5
                                       5                                                                                 5
                                                                    5                                                                                  5                                                                4
                                       4                                                                                 4                                                                                                  0   10   20   30
                                                                    4                                                                                  4
                                           0                         10    20 30 40 50 60                                    0                          10    20 30 40 50 60                                                          Time (
                                                                       0    10 20 30 40 50     60                                                         0    10 20 30 40 50       60
                                                                           Time (min)                                                                         Time (min)
                                                                                 Time (min)                                                                         Time (min)      A-2
    A-2 A-2                                                                                                                                                                        B-2 B-2                                            KP5
                                                                           KP5                                                                                 KP5                                                      9
                                                                                                                                                                     KP5

                                                                                                                                                                                                 Phage titer (PFU/mL)
                                       9                                          KP5                                    9
                                                                    9                            Phage titer (PFU/mL)                                  9                                                                8
                Phage titer (PFU/mL)

                                                                                                                               Phage titer (PFU/mL)
                                             Phage titer (PFU/mL)

                                       8                                                                                 8
                                                                    8                                                                                  8                                                                7
                                       7                                                                                 7
                                                                    7                                                                                  7                                                                6
                                       6                                                                                 6
                                                                    6                                                                                  6                                                                5
                                       5                                                                                 5
                                                                    5                                                                                  5                                                                4
                                       4                                                                                 4                                                                                                  0   10   20   30
                                                                    4                                                                                  4
                                           0                         10    20 30 40 50 60                                    0                          10    20 30 40 50 60                                                          Time
                                                                       0    10 20 30 40 50     60                                                         0    10 20 30 40 50       60
                                                                            Time (min)                                                                        Time (min)
                                                                                  Time (min)                                                                        Time (min)
                                                                                                                                                                                    A-3
    A-3 A-3                                                                                                                                                                        B-3 B-3                                           KP50
                                                                           KP50                                                                               KP50                                                      9
                                                                                                                                                                     KP50

                                                                                                                                                                                                Phage titer (PFU/mL)
                                       9                                          KP50                                   9
                                                                    9                                                                                  9
               Phage titer (PFU/mL)

                                                                                                                                                                                                                        8
                                                                                               Phage titer (PFU/mL)
                                            Phage titer (PFU/mL)

                                                                                                                             Phage titer (PFU/mL)

                                       8                                                                                 8
                                                                    8                                                                                  8
                                                                                                                                                                                                                        7
                                       7                                                                                 7
                                                                    7                                                                                  7
                                                                                                                                                                                                                        6
                                       6                                                                                 6
                                                                    6                                                                                  6
                                                                                                                                                                                                                        5
                                       5                                                                                 5
                                                                    5                                                                                  5
                                                                                                                                                                                                                        4
                                       4                                                                                 4                                                                                                  0   10   20   30
                                                                    4                                                                                  4
                                           0                         10 20 30 40 50 60                                       0                          10    20 30 40 50 60                                                          Time (
                                                                       0 10 20 30 40 50        60                                                         0    10 20 30 40 50      60
                                                                           Time (min)                                                                         Time (min)
                                                                                 Time (min)                                                                         Time (min)
                                                                                                                Figure 2. One-step growth curv
      FigureFigure
             2. One-step   growth
                     2. One-step    curvecurve
                                  growth   of phage  KP4,KP4,
                                                of phage   KP5 KP5
                                                                 and and
                                                                      KP50 on S.
                                                                         KP50 onEnteritidis  (A-1,
                                                                                 S. Enteritidis    A-2A-2
                                                                                                (A-1,  and  A-3)
                                                                                                          and   andand
                                                                                                              A-3)  S. Typhimurium (B-1, B-2
            Figure 2. One-step growth curve of phage KP4, KP5 and KP50 on S. Enteritidis (A-1, A-2 and A-3)
      and S.S.Typhimurium
               Typhimurium(B-1, (B-1,B-2
                                      B-2and
                                          andB-3).
                                               B-3).MOI
                                                    MOI100100presented
                                                              presentedbyby         and MOI
                                                                                    and  MOI10  10presented
                                                                                                   presentedbyby      .. Bars represent the mean
            and S. Typhimurium (B-1, B-2 and B-3). MOI 100 presented by                     and MOI 10 presented by
             . Bars
            Bars    represent
                  represent    the
                             the   mean
                                 mean     standard
                                        standard    deviation
                                                  deviation (n (n = 3).
                                                                = 3).
                     . Bars represent the mean standard deviation (n = 3).
                                                                                                               3.5. Efficiency of Salmonella Phage C
       3.5. Efficiency
3.5. Efficiency        of Salmonella
                of Salmonella   Phage Phage  Cocktail
                                      Cocktail         in Reducing
                                                in Reducing          S. Enteritidis
                                                              S. Enteritidis and S.and      S. Typhimurium
                                                                                        Typhimurium     in VitroIn and
                                                                                                                    Vitro and
       3.5. Efficiency
       Different  FreshofFoods,
                           Salmonella Phage Cocktail
                                and Evidence           in ReducingDevelopment
                                               of Phage-Resistant     S. Enteritidisinand   S. TyphimuriumDifferent
                                                                                        Salmonella
                                                                                                                           Fresh Foods, and Evidence
                                                                                                                 in Vitro and
Different Fresh Foods, and Evidence of Phage-Resistant Development in Salmonella
       Different Fresh Foods, and Evidence of Phage-Resistant Development in Salmonella                               In vitro study showed that a
             In vitro study showed that a phage cocktail could decrease the numbers of S. Enteritidis and
      In vitro study showed that a phage cocktail could decrease the numbers of S. Enteritidis                       and S.
                                                                                                               Typhimurium        as indicated by the
             In vitro study
       S. Typhimurium       as showed  that
                               indicated  byathephage   cocktail
                                                   highest       could of
                                                            reduction    decrease     the numbers
                                                                           both serovars        of moreof than
                                                                                                          S. Enteritidis    and S.
                                                                                                                 4 log CFU/mL
Typhimurium as indicated by the highest reduction of both serovars of more than 4 log CFU/mL                           after
                                                                                                               4 hCFU/mL
                                                                                                                    of a phage   cocktail treatment a
       Typhimurium
       after             as indicated
              4 h of a phage           bytreatment
                                cocktail  the highest at reduction   of both serovars
                                                          MOI 100 (Figure     3). During   of more
                                                                                               the 8 than  4 log
                                                                                                      h treatment,            after
                                                                                                                       an overall
4 h of a phage cocktail treatment at MOI 100 (Figure 3). During the 8 h treatment, an overall of                reduction
                                                                                                                    more
       4 h of a phage
       reduction        cocktail
                   of more   thantreatment
                                  3 log CFU/mLat MOIwas100 (Figure 3).
                                                          observed   forDuring   the 8 tested.
                                                                         both strains      h treatment,   an overall
                                                                                                   In chicken           reduction3 log CFU/mL w
                                                                                                                            than
                                                                                                                 meat artificially
of more than 3 log CFU/mL was observed for both strains tested. In chicken meat artificially                   contaminated       with Salmonella, a
       of more thanwith
       contaminated       3 log  CFU/mLa was
                              Salmonella,          observed of
                                            high reduction    forS. both  strains
                                                                    Enteritidis  was  tested.   In chicken
                                                                                         observed              meat artificially
                                                                                                     in phage-treated     chicken
contaminated with Salmonella, a high2 reduction of S. Enteritidis was                     observed in phage-treated
                                                                                                               chicken     meat on day 2 (0.53 lo
       contaminated
       meat               with log
              on day 2 (0.53    Salmonella,
                                   CFU/cma )high      reduction
                                                 and day   4 (0.66 of
                                                                    logS.CFU/cm
                                                                          Enteritidis      was observed
                                                                                     2 ) (Figure   4). For S. in   phage-treated
                                                                                                               Typhimurium,       a
chicken meat on day 2 (0.53 log CFU/cm2) and2 day 4 (0.66 log CFU/cm2) (Figure                                 4).   For  S.
       chicken meat on day 2 (0.53 log CFU/cm ) and day 4 (0.66 log CFU/cm2) (Figure 4). For S.a high reductionTyphimurium,
Typhimurium, a high reduction was observed in phage-treated chicken meat on day 2CFU/cm                           (1.39 log
                                                                                                                          2) and day 3 (1.73 log CFU
       Typhimurium, a high reduction was observed in phage-treated chicken meat on day 2 (1.39                                 log
CFU/cm ) and 2day 3 (1.73 log CFU/cm ).
          2                                  2
       CFU/cm ) and day 3 (1.73 log CFU/cm2).
sprouts, respectively. Results indicate a potential use of this phage cocktail in chicken meat and
Microorganisms       7,Microorganisms
               2019,sprouts
       sunflower       x      during2019, 7, x
                                      a storage
                                             condition at 4 °C for 4 days.                            11 of 18                                                                                                                                     11 of 18

           Phage-resistant development in Salmonella was investigated after a treatment with our phage
     A-1               A-1 A phage cocktail and individual phages included in phage cocktailB-1
      cocktail preparation.                                                                           preparation                                                                                                                                 B-1
                                KP4               KP4                      KP4                  KP4
      were  re-tested on7,sub-cultured
                 9 2019,
      Microorganisms       100       9 S. Enteritidis and S.                      9
                                                             9 Typhimurium recovered        from a previous phage
                                                                                                              12 of 18
      challenge study. Sub-cultured Salmonella strains previously treated with a phage cocktail presented

                                                                                                                                                                                     Phage titer (PFU/mL)
                                                                                                                                            Phage titer (PFU/mL)
                                                                                           Phage titer (PFU/mL)
               Phage titer (PFU/mL)
                 8
      similar results                8
                      as the sub-cultured                    8
                                            S. Enteritidis and S. Typhimurium8 from the non-phage treatment
      high reduction
      (Table           was observed
              7). However,             in phages
                               individual phage-treated
                                                  showedchicken   meat
                                                            similar lysison day 2on
                                                                          ability   (1.39
                                                                                       thelog CFU/cm2 ) Salmonella
                                                                                           sub-cultured  and day 3
                 7        2          7                       7                    7
      (1.73 log  CFU/cm     ).
      strains from both the previous treatment and the non-phage treatment.
                                        6                                                                           6                                              6                                        6
                                                                                 10                                                                                                                                         B
                                                Bacterial count (Log CFU/mL)
                                                                                                                                                                            B*
                                        5                                                                           5              B*                              5                                        5
                                                                                  8
                                        4                                                                           4                                    4                                                  4               B
                                            0                 10                  20               30                   040 10
                                                                                                                             50 20
                                                                                                                                 60 30                  40 0 50 1060 20                     30                  040 10
                                                                                                                                                                                                                     50 20
                                                                                                                                                                                                                         60 30     40   50   60
                                                                                       A
                                                                                  6 Time (min)                                  Time (min)                                 Time (min)                                   Time (min)
     A-2                                                            A-2                                                                                                     A                                                    B-2              B-2
                                                                      4                A                                                                                    KP5                                          KP5
                                                                                      KP5                                        KP5
                                                                                                                                   A
                                        9                                                                           9                                              9                                        9

                                                                                                                                                                                    Phage titer (PFU/mL)
                                                                                                                                           Phage titer (PFU/mL)
                                                                                             Phage titer (PFU/mL)
                 Phage titer (PFU/mL)

                                                                                  2                                                                                8                                        8
                                        8                                                                           8
                                                                                                                                                                   7                                        7
                                        7                                         0                                 7

                                        6                                              0                            6     2        4                               6
                                                                                                                                                                   6            8                           6     10       12
                                                                                                                                                                Time (h)
                                        5                                                                           5                                              5                                        5
                                                                                                                                                         (a)
                                        4                                                                           4                                    4                                                  4
                                            0                  10                 20                30                  040 10
                                                                                                                             50 20
                                                                                                                                 60 30                  40 050 1060 20                      30                  040 10
                                                                                                                                                                                                                     50 20
                                                                                                                                                                                                                         60 30     40   50   60
                                                  Bacterial count (Log CFU/mL)

                                                                                 10 Time (min)                                   Time (min)                                Time
                                                                                                                                                                            C* (min)                                    Time (min)
                                                                                                                                                                                                                          C*
                                                                                                                                   B*
     A-3                                                            A-38                                                                                                                                                         B-3              B-3
                                                                                  KP50                                          KP50                                       KP50                                         KP50
                                        9                                                                           9                                              9                                        9              D
                                                                                  6 A
                                                                                            Phage titer (PFU/mL)
                Phage titer (PFU/mL)

                                                                                                                                                                                Phage titer (PFU/mL)
                                                                                                                                         Phage titer (PFU/mL)

                                        8                                                                           8                                              8            C                           8
                                                                                  4
                                        7                                                   B 7                                                                    7                                        7
                                                                                                                                   A
                                        6
                                                                                  2                                 6                                              6                                        6

                                        5                                         0                                 5                                              5                                        5
                                                                                       0                                   2        4                        6     4
                                                                                                                                                                                8                           4
                                                                                                                                                                                                                  10       12
                                        4                                                                           4
                                            0                 10                  20               30                   040 10
                                                                                                                             50 20
                                                                                                                                 60 30                 40Time
                                                                                                                                                           0 50 (h)
                                                                                                                                                                1060       20            30                     040 10
                                                                                                                                                                                                                     50 20
                                                                                                                                                                                                                         60 30    40    50   60
                                                                                      Time (min)                                Time (min)                                  Time (min)                                   Time (min)
                                                                                                                                        (b)
      FigureFigure    3. Survival
              2. One-step
             Figure           growth
                         Survival    of
                                Figureof (a)
                                          2. S.
                                         curveS. Enteritidis
                                          (a)One-step
                                                  of phagegrowth
                                                 Enteritidis     and
                                                                KP4,  (b)
                                                                       KP5S.
                                                                 andcurve
                                                                      (b)    Typhimurium
                                                                             of
                                                                          S.and phage    on S.treated
                                                                                  KP50 KP4,
                                                                              Typhimurium      KP5   andwith
                                                                                                          KP50
                                                                                                Enteritidis   a phageS. cocktail
                                                                                                                 onA-2
                                                                                                             (A-1,      Enteritidis
                                                                                                                         and A-3)  at 37  ◦ C A-2 and A-3)
                                                                                                                                          °C
                                                                                                                                      (A-1,
      and S.for
              Typhimurium
             for 12
                 12 h.
                     h.Control
                         Controland  S. Typhimurium
                                  (B-1,  B-2 andcocktail
                                   (non-phage
                                    (non-phage                (B-1,
                                                      B-3). MOI
                                                     cocktail        B-2presented
                                                                    100
                                                               treated)
                                                                 treated) and   B-3). by
                                                                           presented   MOI
                                                                                        by 100 presented
                                                                                       by                 MOIby10 presented
                                                                                                     andtreatment
                                                                                                    and                       andby
                                                                                                                     of a phage    MOI    10 presented by
                                                                                                                                   cocktail
                                                                                                                                   cocktail
              . Bars represent
             presented
             presented by  by      the  .. Bars
                                        mean
                                           Bars   represent
                                                 standard
                                                   represent    the
                                                                 themean
                                                             deviation
                                                                     mean   standard
                                                                           (n = 3).
                                                                             standard
                                                  represent the mean standard deviation deviation
                                                                                         deviation (n =
                                                                                                     (n 3).
                                                                                                        =
                                                                                                        = 3). The  sign   (*) on  the
                                                                                                              The sign (*) on the lineslines
             indicates
             indicates significant
                          significant differences
                                         differences (p  (p
Microorganisms 2019, 7, 100                                                                                                                  13 of 18
Microorganisms 2019,
Microorganisms2019,
Microorganisms       7,
                     7,xxx
               2019,7,                                                                                                                       13 of
                                                                                                                                              13of
                                                                                                                                             13    18
                                                                                                                                                 of18
                                                                                                                                                    18

                                                      12
                                                      12
                                                      12

                                         CFU/cm 2))
                                               2
                                    (Log CFU/cm
                                                      10
                                                      10
                                                      10                                                              C*
                                                                                                                      C*
                                                                                                                      C*
                                                                                                  C                D*
                                                                                                                   D*
                                                                                                                   D*
                                                                                                  C
                                                                                                  C
                              count (Log               888                              B*
                                                                                        B*
                                                                                     B* B*
                                                                                     B*
                                                                                     B*
                                                                                                      B*
                                                                                                      B*
                                                                                                      B*
                                                                         AB
                                                                         AB
                                                                      AB AB
                                                                      AB
                                                                      AB
                                                       666   A
                                                             AA
                                                             A A
                                                               A
                    Bacterial count

                                                       444
                    Bacterial

                                                       222

                                                       000
                                                               000      111           222         333                 444
                                                                              Storage time
                                                                              Storagetime
                                                                              Storage      (day)
                                                                                       time(day)
                                                                                            (day)
                                                                                  (a)
                                                                                   (a)
                                                                                  (a)
                                           12
                                           12
                                           12
                                        CFU/g)
                                   (Log CFU/g)

                                           10
                                           10
                                           10

                                                      888
                             count (Log

                                                                                                      B*
                                                                                                      B*
                                                                                                      B*
                                                                         AB*
                                                                         AB*         B
                                                                                     B AB*
                                                                                       AB*
                                                                                     B AB*     AB*
                                                                                               AB*
                                                                                               AB*               AB*
                                                                                                                 AB* AB*
                                                                                                                     AB*
                                                                                                                 AB*AB*
                                                      666      A
                                                               A
                                                             A A
                                                             A
                                                             A       AB*AB*
                                                                     AB*
                                                                     AB*
                   Bacterial count

                                                      444
                   Bacterial

                                                      222

                                                      000
                                                              000      111            222         333                 444
                                                                              Storage time
                                                                              Storagetime
                                                                              Storage      (day)
                                                                                       time(day)
                                                                                            (day)
                                                                                  (b)
                                                                                   (b)
                                                                                  (b)
        Figure
         Figure 4.
      Figure       4. Recovery
                   4. Recovery
                       Recovery of   of  S.  Enteritidis
                                             Enteritidis ((( ))) and
                                         S. Enteritidis
                                     of S.                        and
                                                                  and S. S.  Typhimurium
                                                                             Typhimurium ((( ))) artificially
                                                                         S. Typhimurium              artificially  contaminated
                                                                                                      artificially contaminated
                                                                                                                    contaminated in
                                                                                                                   contaminated          in (a)
                                                                                                                                        in   (a)
                                                                                                                                            (a)
        chicken
         chickenmeatmeat
                    meatandand
                            and(b)(b)  sunflower
                                      sunflower
                                  (b)sunflower      sprouts
                                                    sprouts
                                       sunflowersprouts         treated
                                                     sproutstreated        with
                                                                 treatedwithwithaaaphage
                                                                                    phage   cocktail
                                                                                     phagecocktail
                                                                                            cocktailandand   stored
                                                                                                        andstored
                                                                                                              storedatat    ◦°C
                                                                                                                      at444°C    for
                                                                                                                              C for
                                                                                                                             °C  for444days.
                                                                                                                                        days.
                                                                                                                                         days.
      chicken
        Control
       Control     (non-phage
         Control(non-phage          cocktail
                    (non-phagecocktail         treated)
                                     cocktailtreated)
                                               treated)ofof
                                                         ofS.S.  Enteritidis
                                                             S.Enteritidis
                                                                 Enteritidisand and  S.
                                                                                 andS.  Typhimurium
                                                                                        Typhimurium        inoculated
                                                                                         Typhimuriuminoculated
                                                                                      S.Typhimurium        inoculatedon  on   both
                                                                                                                         onboth     samples
                                                                                                                              bothsamples
                                                                                                                                     samples
        presented
      presented
         presentedby   by  solid
                       bysolid     line
                           solidline     and
                                   lineand    dashed
                                         anddashed     line,
                                               dashedline,      respectively.
                                                        line,respectively.
                                                                respectively.Bars Bars  represent
                                                                                   Barsrepresent
                                                                                         representthethe  mean
                                                                                                     themean     standard
                                                                                                          meanstandard         deviation
                                                                                                                  standarddeviation
                                                                                                                               deviation(n   (n
                                                                                                                                              (n
      ==== 3).
           3).  The
            3). The   sign
                 The sign   (*)
                      sign (*)   on
                             (*) on   the
                                  on the    bars
                                      the bars    indicates
                                            bars indicates     significant
                                                  indicates significant        differences
                                                               significant differences       (p
Microorganisms 2019, 7, 100                                                                                      14 of 18

     Table 7. Lysis ability of a phage cocktail and individual phages included in a phage cocktail preparation
     on S. Enteritidis (SE) and S. Typhimurium (ST) after being treated with a phage cocktail.

                                                                           Lysis Ability a
                                                   Cocktail             KP4                  KP5         KP50
                       Treatment
                                                                        Phage Titer (PFU/mL)
                                                  107     106     107      106     107       106   107     106
          Control SE (non-phage treatment)        ++      ++      ++          ++   ++        ++    ++       +
          Control ST (non-phage treatment)        ++       +      ++          +    ++        −      +       −
                  Phage-treated SE                ++      ++      ++          −    ++        −     ++       −
                  Phage-treated ST                ++      +       ++          +    ++        −      +       −
      a Clear zone or visible plaques were observed as +++, confluent lysis (clear spot); ++, semi-confluent lysis

      (semi-clear); +, turbidity without plaque formation.

4. Discussion
     The recovery of high number of Salmonella phages in this study suggests that animal farm
environments in Songkhla province, Thailand represent an important source of abundant Salmonella
phages. Typically, Salmonella phages have been isolated from diverse animal farms such as poultry
farms [25,27], swine farms [28,29], goat farms [30] and bovine farms [4,31]. Our study also suggests
that free range farms could yield many phages, especially from soil and feed samples. Similar to
previously reported sources of phages, Wongsuntornpoj et al. [31] isolated a number of Salmonella
phages from small-scale free range cattle farms in Thailand [31]. As the presence of bacteriophage is
normally related to bacterial host population [32], samples from free range farms including soil in an
open land may have high opportunity to be exposed to various important sources of Salmonella such
as wild birds, insects, rodent droppings and other carriers [33].
     Variations in the genome size of Salmonella phages obtained in this study indicate the potential
diverse phage groups that may be distributed in farm environments in Thailand. Some identical
genome sizes were observed among phages from various farms in different countries (Table 8),
suggesting presence of common phage types from these animal farm-related sources. Among Salmonella
phages isolated from dairy farms in USA, the genome sizes ranging from 22 kb to 156 kb [4], while
some phages from dairy farms in Thailand exhibited the genome sizes of 40 kb to 200 kb [31]. Lysis
profiles indicated that our isolated phages showed better ability to lyse Salmonella strains from animal
farms in Thailand as compared to strains from USA. Our findings indicate the relationship between
phages and Salmonella hosts is due to geological isolation. This phenomenon can be explained by
the mechanisms of the phage-host receptors which are related to the evolution as pray-predator [34].
However, the spectrum of phage lysis can be extended across different sources or regions of host
habitats. In this study, our isolated phages showed lysis on Salmonella strains from diverse sources
including environments related to animal farms, animal slaughterhouses, food processing plants and
from humans. Phages could also lyse bacterial hosts from different continents. Overall, phages
isolated from animal farms in this study could lyse most serovars of Salmonella that have been
reported as the predominant and prevalent serovars in humans, foods and animal farms in Thailand
including Salmonella serovars Agona, Anatun, Give, Enteritidis, Kedougou, Kentucky, Typhimurium
and Weltevreden [11,21,35,36]. Findings here suggests a potential for phage applications against
bacterial hosts from various environments in different food chains or countries.
Microorganisms 2019, 7, 100                                                                         15 of 18

     Table 8. Estimated genome size of Salmonella phages isolated from animal farms in this study and
     Salmonella phage isolated from previous studies.

            Source of Isolation              Country        Estimated Genome Size (kb)     Reference
    Goat feces                               Thailand       200 ± 2                        This study
    Bovine feces                             Thailand       50 ± 2, 60 ± 2                 This study
    Poultry feed                             Thailand       60 ± 2, 72 ± 2                 This study
    Soil (poultry farm)                      Thailand       50 ± 2, 60 ± 2, 105 ± 2        This study
    Drinking water (poultry farm)            Thailand       97 ± 2                         This study
    Poultry feces                            Thailand       50 ± 2, 60 ± 2, 103 ± 2        This study
    Dairy farms                                USA          22 to 156                          [4]
    Dairy farms                              Thailand       40 to 200                         [31]
    Sewage effluent                             UK          40, 48.5 and 155                  [37]
    Chicken feces                             Korea         240                               [38]
    Sewage (poultry farm)                     Korea         40                                [39]
    Water buffalo feces                    Southern Italy   39                                [40]
    Swine lagoon effluent (poultry farm)        UK          42                                [41]

     Phage latent period and burst size are major parameters which play an important role in the host
lysis system [42]. Phages which present a short latent period and large burst size will be replicated
more quickly and the new phage particles (progeny) could be released more efficiently [25]. Our phages
combined in a phage cocktail showed a short latent period and large burst size of up to 97.7 and
173.7 PFU/cell on both S. Enteritidis and S. Typhimurium, respectively. The range of Salmonella phage
latent periods has been reported within the range of 15 to 45 min [43]. Abedon et al. [44] reported that
shorter phage latent periods could be obtained by higher bacterial densities. It is also suggested that
phage exhibiting very short latent periods maybe viewed as specialists for propagation when bacteria
within cultures are highly prevalent [44]. Phage burst size has been reported with large variations (5 to
250 PFU/cell) depending on the bacterial strain infected [45]. Overall, the short latent period and large
burst size of our phages suggests a rapid replication and effective release of new phage particles from
both S. Enteritidis and S. Typhimurium hosts, thus appropriate for using to control bacterial hosts as
reported by previous other studies [46,47].
     Our developed phage cocktail showed high efficiency to control S. Enteritidis and S. Typhimurium
in both in vitro study and different food categories that are typically linked to Salmonella and foodborne
outbreaks. Our phage cocktail could decrease S. Enteritidis on chicken meat and sunflower sprouts
by 0.66 log CFU/cm2 and 1.27 log CFU/g, respectively. S. Typhimurium on chicken meat and
sunflower sprouts were decreased by 1.73 log CFU/cm2 and 1.17 log CFU/g, respectively. In a
previous study, Grant et al. [48] demonstrated a < 1 log reduction of Salmonella on ground chicken
after treatment with the commercial Salmonella phage cocktail (SalmonelexTM , Micreos Food Safety,
Wageningen, The Netherlands) [48]. Another phage cocktail showed a reduction of S. Enteritidis and
S. Typhimurium on chicken breast at 0.9 and 2.2 log CFU/g, respectively within 7 days at 4 ◦ C [20].
Our finding showed no evidence of phage resistance in both Salmonella serovars upon phage cocktail
treatment. This phenomenon might be related to the biology (latent period and burst size) of the
phages included in our phage cocktail. Short periods of time to kill bacterial hosts for phages is an
important factor that prevents the occurrence of bacteria resistance to phage [43].

5. Conclusions
     This study aims to understand the abundance and diversity of Salmonella phages in animal farm
environments. Phages presenting an ability to lyse Salmonella strains from different sources in the food
chain and countries were included for development of Salmonella phage cocktail. Phages from our
collection obtained from animal farms in Thailand indicate diverse and effective phages that can be
used as a biocontrol agent to control S. Enteritidis and S. Typhimurium in different food categories.
In addition, phage lysis profiles indicated that our isolated phages showed a high ability to lyse several
important serovars of Salmonella predominant in various sources and prevalent in different countries.
Microorganisms 2019, 7, 100                                                                                    16 of 18

Phages composed in our developed cocktail showed a rapid replication and effective release of new
phage particles from both S. Enteritidis and S. Typhimurium hosts as indicated by short latent period
and large burst size. The developed phage cocktail in this study showed to be highly effective for the
reduction of S. Enteritidis and S. Typhimurium in fresh foods, especially those that have been highly
related to Salmonella contamination and foodborne outbreaks.

Author Contributions: K.P., S.B., S.C., A.I.M.S., and K.V. designed the experiments. K.P. performed the
experiments and performed statistical analyses. K.P. and K.V. analysed data and wrote the manuscript.
Funding: Prince of Songkla University (AGR570552S to K.V). Supports from the TRF Distinguished Research
Professor Grant (to S.B.) and the Ph. D scholarship from Graduate School of Prince of Songkla University (to K.P.)
Acknowledgments: This project is funded by Prince of Songkla University (AGR570552S to K.V.). Supports from
the TRF Distinguished Research Professor Grant (to S.B.) and the Ph. D scholarship from Graduate School of
Prince of Songkla University (to K.P.) are also acknowledged.
Conflicts of Interest: The authors declare no conflict of interest.

References
1.    García, V.; Mandomando, I.; Ruiz, J.; Herrera-León, S.; Alonso, P.L.; Rodicio, M.R. Salmonella enterica serovars
      Typhimurium and Enteritidis causing mixed infections in febrile children in Mozambique. Infect. Drug Resist.
      2018, 11, 195–204. [CrossRef]
2.    Center for Disease Control and Prevention. Salmonella. Available online: https://www.cdc.gov/salmonella/
      index.html (accessed on 23 October 2018).
3.    Cummings, K.J.; Warnick, L.D.; Alexander, K.A.; Cripps, C.J.; Gröhn, Y.T.; James, K.L.; McDonough, P.L.;
      Reed, K.E. The duration of fecal Salmonella shedding following clinical disease among dairy cattle in the
      northeastern USA. Prev. Vet. Med. 2009, 92, 134–139. [CrossRef] [PubMed]
4.    Moreno Switt, A.I.; den Bakker, H.C.; Vongkamjan, K.; Hoelzer, K.; Warnick, L.D.; Cummings, K.J.;
      Wiedmann, M. Salmonella bacteriophage diversity reflects host diversity on dairy farms. Food Microbiol. 2013,
      36, 275–285.
5.    Shahzad, A.; Mahmood, M.Sh.; Hussain, I.; Siddique, F.; Abbas, R.Z. Prevalence of Salmonella species in hen
      eggs and egg storing-trays collected from poultry farms and marketing outlets of Faisalabad, Pakistan. Pak. J.
      Agric. Sci. 2012, 49, 565–568.
6.    United States Department of Agriculture. Serotypes Profile of Salmonella Isolates from Meat and Poultry
      Products January 1998 through December 2014. Available online: https://www.fsis.usda.gov/wps/wcm/
      connect/3866026a-582d-4f0e-a8ce-851b39c7390f/Salmonella-Serotype-Annual-2014.pdf?MOD=AJPERES
      (accessed on 23 October 2018).
7.    Reddy, S.P.; Wang, H.; Adams, J.K.; Feng, P.C.H. Prevalence and characteristics of Salmonella serotypes
      isolated from fresh produce marketed in the United States. J. Food Prot. 2016, 79, 6–16. [CrossRef]
8.    Ponce, E.; Khan, A.; Cheng, C.M.; Summage-West, C.; Cerniglia, C.E. Prevalence and characterization of
      Salmonella enterica serovar Weltevreden from imported seafood. Food Microbiol. 2008, 25, 29–35. [CrossRef]
9.    Shabarinath, S.; Sanath Kumar, H.; Khushiramani, R.; Karunasagar, I.; Karunasagar, I. Detection and
      characterization of Salmonella associated with tropical seafood. Int. J. Food Microbiol. 2007, 114, 227–233.
      [CrossRef]
10.   Espigares, E.; Bueno, A.; Espigares, M.; Gálvez, R. Isolation of Salmonella serotypes in wastewater and
      effluent: Effect of treatment and potential risk. Int. J. Hyg. Environ. Health 2006, 209, 103–107. [CrossRef]
      [PubMed]
11.   Bangtrakulnonth, A.; Pornreongwong, S.; Pulsrikarn, Ch.; Sawanpanyalert, P.; Hendriksen, S.R.; Wong, D.;
      Arestrupt, F.M. Salmonella serovars from humans and other sources in Thailand 1993–2003. Emerg. Infect. Dis.
      2004, 10, 131–135.
12.   Center for Disease Control and Prevention. Reports of Salmonella Outbreak Investigations from 2018.
      Available online: https://www.cdc.gov/salmonella/outbreaks-2018.html (accessed on 23 October 2018).
13.   Hanning, I.B.; Nutt, J.D.; Ricke, S.C. Salmonellosis outbreaks in the United States due to fresh produce:
      Sources and potential intervention measures. Food Pathog. Dis. 2009, 6, 635–648. [CrossRef]
14.   Clokie, M.R.; Millard, A.D.; Letarov, A.V.; Heaphy, S. Phages in nature. Bacteriophage 2011, 1, 31–45. [CrossRef]
Microorganisms 2019, 7, 100                                                                                    17 of 18

15.   Díaz-Muñoz, S.L.; Koskella, B. Bacteria–phage interactions in natural environments. Adv. Appl. Microbiol.
      2014, 89, 135–183.
16.   Kazi, M.; Annapure, U.S. Bacteriophage biocontrol of foodborne pathogens. J. Food Sci. Tech. 2016, 53,
      1355–1362. [CrossRef]
17.   Fister, S.; Robben, C.; Witte, A.K.; Schoder, D.; Wagner, M.; Rossmanith, P. Influence of environmental factors
      on phage-bacteria interaction and on the efficacy and infectivity of phage P100. Front. Microbiol. 2016, 7,
      1–13. [CrossRef]
18.   Thung, T.T.; Premarathne, K.; Chang, W.S.; Loo, Y.Y.; Chin, Y. Zh.; Kuan, Ch.H.; Tan, Ch.W.; Basri, D.F.;
      Jasimah, Ch.W.; Radu, S. Use of a lytic bacteriophage to control Salmonella Enteritidis in retail food. LWT-Food
      Sci. Technol. 2017, 78, 222–225. [CrossRef]
19.   Kocharunchitt, C.; Ross, T.; McNeil, D.L. Use of bacteriophages as biocontrol agents to control Salmonella
      associated with seed sprouts. Int. J. Food. Microbiol. 2009, 128, 453–459. [CrossRef]
20.   Spricigo, D.A.; Bardina, C.; Cortés, P.; Llagostera, M. Use of a bacteriophage cocktail to control Salmonella in
      food and the food industry. Int. J. Food Microbiol. 2013, 165, 169–174. [CrossRef]
21.   Padungtod, P.; Kaneene, J.B. Salmonella in food animals and humans in northern Thailand. Int. J. Food Microbiol.
      2006, 108, 346–354. [CrossRef]
22.   Vongkamjan, K.; Moreno Switt, A.I.; Den, H.C.; Fortes, E.D.; Wiedmann, M. Silage collected from
      dairy farms harbors an abundance of Listeria phages with considerable host range and genome size.
      Appl. Environ. Microbiol. 2012, 78, 8666–8675. [CrossRef] [PubMed]
23.   R Development Core Team. R: A Language and Environment for Statistical Computing. Available online:
      http://www.R.-project.org/ (accessed on 20 January 2019).
24.   Mirzaei, M.K.; Nilsson, A.S. Correction: isolation of phages for phage therapy: A comparison of spot tests
      and efficiency of plating analyses for determination of host range and efficacy. PLoS ONE 2015, 10, e0127606.
      [CrossRef]
25.   Bao, H.; Zhang, H.; Wang, R. Isolation and characterization of bacteriophages of Salmonella enterica serovar
      Pullorum. Poult. Sci. 2011, 90, 2370–2377. [CrossRef] [PubMed]
26.   Food and Agriculture Organization of the United Nations and World Health Organization. Joint FAO/WHO
      Food Standards Programme Codex Committee on Fish and Fishery Products, Discussion Paper on the Use of
      Chlorinated Water. 2000. CX/FFP 00/13. Available online: http://www.fao.org/tempref/codex/Meetings/
      CCCF/CCCF5/cf05_INF.pdf (accessed on 23 October 2018).
27.   Hungaro, M.H.; Santos Mendonca, R.C.; Gouvea, D.M.; Danatas Vanetti, M.C.; de Oliveira Pinto, C.L. Use of
      bacteriophages to reduce Salmonella in chicken skin in comparison with chemical agents. Food Res. Int. 2013,
      52, 75–81. [CrossRef]
28.   Callaway, T.R.; Edrington, T.S.; Brabban, A.; Kutter, E.; Karriker, L.; Stahl, C.; Wagstrom, E.; Anderson, R.C.;
      Genovese, K.; McReynolds, J.; et al. Occurrence of Salmonella-specific bacteriophages in swine feces collected
      from commercial farms. Foodborne Pathog. Dis. 2010, 7, 851e856. [CrossRef] [PubMed]
29.   McLaughlin, M.R.; Balaa, M.F.; Sims, J.; King, R. Isolation of Salmonella bacteriophages from swine effluent
      lagoons. J. Environ. Qual. 2006, 35, 522–528. [CrossRef] [PubMed]
30.   Shukla, K.S.; Hirpurkar, S.D.; Singh, S.K.; Rajoria, R. Isolation of phage from animal waste of different LSF
      and their utility in phage therapy. Int. J. Curr. Microbiol. Appl. Sci. 2014, 3, 205–210.
31.   Wongsuntornpoj, S.; Moreno Switt, A.I.; Bergholz, P.; Wiedmann, M.; Chaturongakul, S. Salmonella phages
      isolated from dairy farms in Thailand show wider host range than a comparable set of phages isolated from
      U.S. dairy farms. Vet. Microbiol. 2014, 172, 345–352. [CrossRef] [PubMed]
32.   Chibani-Chennoufi, S.; Bruttin, A.; Dillmann, M.L.; Brűssow, H. Phage-host interaction: An ecological
      perspective. J. Bacteriol. 2004, 186, 3677–3686. [CrossRef]
33.   Bailey, J.S.; Cosby, D.E. Salmonella prevalence in free-range and certified organic chickens. J. Food Prot. 2005,
      68, 245–2453. [CrossRef]
34.   Chaturongakul, S.; Ounjai, P. Phage-host interplay: Examples from tailed phages and Gram-negative
      bacterial pathogens. Front. Microbiol. 2014, 5, 442. [CrossRef] [PubMed]
35.   Saengthongpinit, C.;          Nane-Siri, D.;       Aparachita, P.;        Apiwannarat, P.;         Buakhao, P.;
      Bowornnantiwath, W.; Thengchaisri, N.; Songserm, T. Longitudinal study of Salmonella and Campylobacter
      species from two laying duckling flocks in the central region of Thailand. Thai J. Vet. Med. 2014, 44, 355–361.
You can also read