Madden-Julian Oscillation: Recent Evolution, Current Status and Predictions - Update prepared by the Climate Prediction Center - NOAA
←
→
Page content transcription
If your browser does not render page correctly, please read the page content below
Madden-Julian Oscillation:
Recent Evolution, Current Status and
Predictions

     Update prepared by the Climate Prediction Center
     Climate Prediction Center / NCEP
     20 May 2019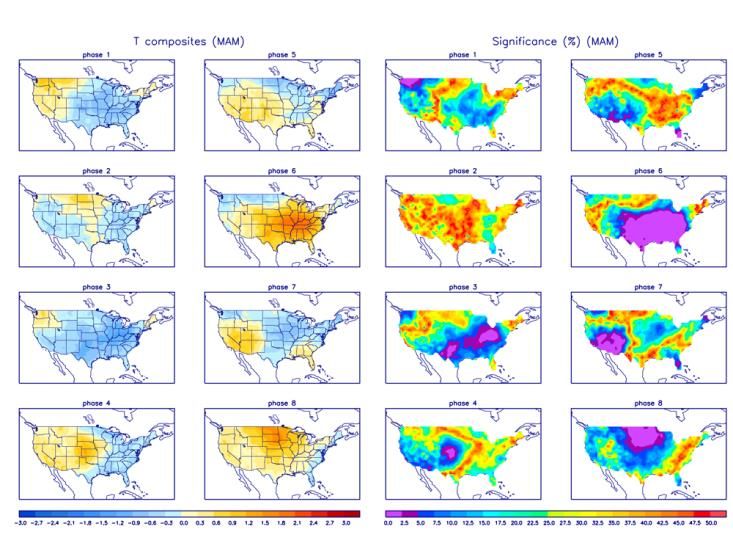
Overview
The enhanced convective phase of the MJO is noted over the Western Hemisphere this week, with
the primary convective envelope centered over the Central Pacific. The suppressed convective
phase has expanded from the Indian Ocean eastward across the Maritime Continent.
The ECMWF model predicts eastward propagation of the MJO signal across the Western
Hemisphere, Africa, and the western Indian Ocean over the next two weeks, with gradual de-
amplification of the signal during Week-2. The GEFS model predicts slower eastward propagation
across the Western Hemisphere and Africa during the ensuing two weeks, with considerable spread
apparent among ensemble members during Week-2.
Tropical cyclone development is possible over the East Pacific, Atlantic, and South Pacific basins
during the two-week period.
.
A discussion of potential impacts for the global tropics and those related to the U.S. are updated on Tuesday at:
http://www.cpc.ncep.noaa.gov/products/precip/CWlink/ghazards/index.php200-hPa Velocity Potential Anomalies
Green shades: Anomalous divergence (favorable for precipitation).
Brown shades: Anomalous convergence (unfavorable for precipitation).
• The MJO, which was consistently active throughout boreal fall and winter, weakened by early March.
• During March, the pattern has been dominated by low-frequency signals, with some modulation by Rossby
and Kelvin wave activity.
• Mid-April shows the beginning of a more coherent MJO with renewed eastward propagation during late April.
Recently, the enhanced phase of MJO shifted east over the Western Hemisphere and Africa, while the
suppressed phase shifted east over the Maritime Continent and western Pacific.200-hPa Wind Anomalies
Shading denotes the zonal wind anomaly. Blue shades: Anomalous easterlies. Red shades: Anomalous westerlies.
A
A
A
A
• As seen in the upper-level velocity potential field on the previous slide, the MJO became inactive during mid-
March, but showed signs of re-emerging by April.
• Upper-level wind anomalies have reversed across the Maritime Continent since late April, becoming easterly.
The latest observations show that westerly anomalies have re-emerged (at least temporarily) over the
western Maritime Continent.
• The subtropical jet remained enhanced over the northeast Pacific since the beginning of May.850-hPa Wind Anomalies
Shading denotes the zonal wind anomaly. Blue shades: Anomalous easterlies. Red shades: Anomalous westerlies.
• Anomalous westerlies tied to the MJO shifted from the Indian Ocean to over the Maritime Continent and
western Pacific from late April into mid-May.
• During the past five days, anomalous westerlies over the equatorial western Pacific have not shown much
eastward displacement. Anomalous easterlies remained over the equatorial Indian Ocean, which is favorable
for enhanced rainfall over eastern Africa.Outgoing Longwave Radiation (OLR) Anomalies
Blue shades: Anomalous convection (wetness). Red shades: Anomalous subsidence (dryness).
• The low-frequency enhancement of convection just west of the Date Line has been the most consistent
signal during 2019.
• The MJO has been apparent since at least mid-April, with noted equatorial Rossby wave (ERW) activity near
the Date Line and Indian Ocean.
• The enhanced phase of the MJO likely contributed to the development of tropical cyclones Lili and Ann in the
Southern Hemisphere during the first half of May.SSTs and Weekly Heat Content Evolution in the Equatorial Pacific
• SST anomalies remain above climatology across much of the equatorial Central and East Pacific, consistent
with the ongoing El Niño event.
• Some erosion of upper ocean heat content is apparent east of the Maritime Continent, but most noteworthy
is a westerly wind burst that recently developed near 160E. There is some question as to whether this will
trigger a downwelling oceanic Kelvin wave to help reinforce the warm water availability for the low frequency
state in the Pacific.MJO Index: Recent Evolution
• The RMM index shows the MJO propagating
eastward across the West Pacific during early to
mid-May, though now the signal has become
quasi-stationary during the past 7-days. This may
be related to ERW activity near the Date Line.
For more information on the RMM index and how to interpret its forecast please see:
https://www.cpc.ncep.noaa.gov/products/precip/CWlink/MJO/CPC_MJOinformation.pdfMJO Index: Forecast Evolution
GEFS Forecast ECMWF Forecast
• Model guidance diverges on the MJO evolution during Week-1. The GFS model maintains a very slow
eastward propagation over the Western Hemisphere while maintaining amplitude, whereas the ECMWF
model begins to weaken the signal abruptly as early as Week-1. This diverging model solutions lowers
forecast confidence on the longevity of the MJO in late May.MJO: GEFS Forecast Evolution Figures below show MJO associated OLR anomalies only (reconstructed from RMM1 and RMM2) and do not include contributions from other modes (i.e., ENSO, monsoons, etc.) • The GEFS indicates suppressed convection expanding east from the Indian Ocean to the western Pacific. The enhanced phase continues over the East Pacific, Central America, Africa, and northern parts of South America, through Week-2. Enhanced convective anomalies also begin to show up over the Western Indian Ocean by late May.
MJO: Constructed Analog Forecast Evolution
Figures below show MJO associated OLR anomalies only (reconstructed from RMM1 and RMM2) and do not include
contributions from other modes (i.e., ENSO, monsoons, etc.)

• The constructed analog forecast favors a
   relatively faster eastward propagation of the
   MJO compared to the dynamical models; with
   enhanced convection re-emerging over the
   Indian Ocean in the next few days.
MJO: Tropical Composite Maps by RMM Phase
      850-hPa Velocity Potential and
                                            Precipitation Anomalies
            Wind Anomalies
MJO: CONUS Composite Maps by RMM Phase - Temperature Left hand side plots show temperature anomalies by MJO phase for MJO events that have occurred over the three month period in the historical record. Blue (red) shades show negative (positive) anomalies respectively. Right hand side plots show a measure of significance for the left hand side anomalies. Purple shades indicate areas in which the anomalies are significant at the 95% or better confidence level. More information: http://www.cpc.ncep.noaa.gov/products/precip/CWlink/MJO/mjo.shtml
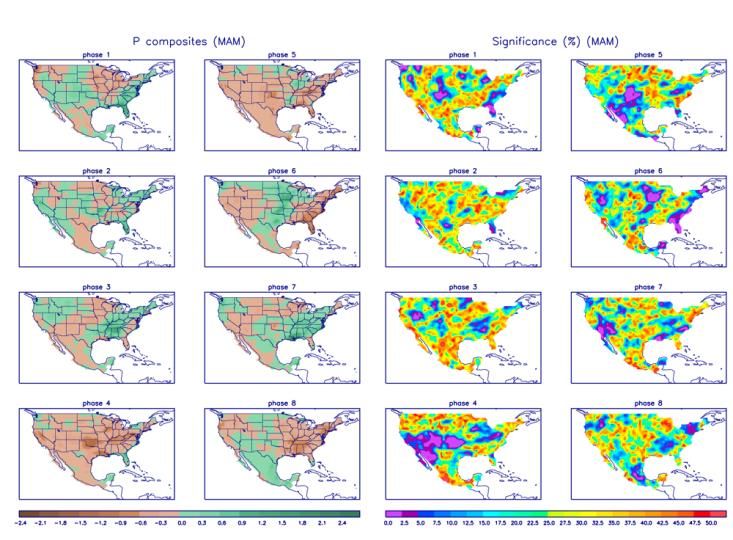
MJO: CONUS Composite Maps by RMM Phase - Temperature

 Left hand side plots show
 precipitation anomalies by MJO
 phase for MJO events that have
 occurred over the three month
 period in the historical record.
 Brown (green) shades show
 negative (positive) anomalies
 respectively.
 Right hand side plots show a
 measure of significance for the left
 hand side anomalies. Purple
 shades indicate areas in which the
 anomalies are significant at the
 95% or better confidence level.

More information: http://www.cpc.ncep.noaa.gov/products/precip/CWlink/MJO/mjo.shtml
You can also read