Maple Leaf Foods Q2 2021 Business & Financial Review
←
→
Page content transcription
If your browser does not render page correctly, please read the page content below

Maple
                                      Leaf Foods
                                                   Q2 2021 Business
All dollar amounts are presented in
CAD dollars unless otherwise noted.
                                                   & Financial Review
Forward-looking Statements and non-IFRS Measures
    This presentation contains “forward-looking information” within the meaning of applicable securities law. These statements are based on current expectations, estimates, forecasts,
    and projections about the industries in which the Company operates, as well as beliefs and assumptions made by the Management of the Company. The COVID-19 pandemic
    creates a very fluid situation with many uncertainties. Based on its experience to date, the Company has made certain assumptions about the implications of COVID-19 for its business,
    including:
    •   The shifting demand balance between retail and foodservice channels, product mix, productivity, supply chain disruptions, operating cost pressures and business continuity.
    •   The Company’s expectations with respect to future sales and returns associated with the anticipated growth of its plant protein business are based on a number of assumptions,
        estimates and projections, including but not limited to: the impact of COVID-19 (including expected increase in demand in foodservice channels in the back half of 2021), market
        growth assumptions, market share assumptions, new product innovation and commercialization, results of brand renovation initiatives, foreign exchange rates, supply chain
        effectiveness, customer and consumer behaviour and competition.
    •   The Company’s expectations with respect to the growth of its meat protein business, such as anticipated growth in sales, adjusted EBITDA margin and gross margin, are based on a
        number of assumptions, estimates and projections, including but not limited to: the impact of COVID-19 (including expected increase in demand in foodservice channels in the last
        half of 2021), commodity prices, hog and pork processor margins, demand for pork and access to export markets, poultry markets and supply management, foreign exchange
        rates, growth in demand for sustainable meats and branded products; supply chain effectiveness, customer and consumer behaviour and competition.
    •   The Company's assumptions about capital project expenditures and timing are based on a number of assumptions, including but not limited to: the impact of COVID-19,
        availability and cost of materials, labour, productivity levels, quality of estimating, weather conditions, and project scope.
    •   These statements are not guarantees of future performance and involve assumptions, risks and uncertainties that are difficult to predict. These assumptions have been derived from
        information currently available to the Company, including information obtained by the Company from third-party sources. These assumptions may prove to be incorrect in whole
        or in part. In addition, actual results may differ materially from those expressed, implied, or forecasted in such forward-looking information, which reflect the Company’s
        expectations only as of the date hereof. Please refer to the sections entitled “Risk Factors” and “Forward-Looking Statements” in the Company's Management Discussion and
        Analysis for the quarter ended June 30, 2021 and year ended December 31, 2020 for additional detail.
    In addition, this presentation contains the following non-IFRS measures:
    Adjusted Operating Earnings: Earnings before income taxes and interest expenses adjusted for items that are not considered representative of ongoing operational activities of the
    business, and items where the economic impact of the transactions will be reflected in earnings in future periods when the underlying asset is sold or transferred.
    Adjusted Earnings per Share: Defined as basic earnings per share adjusted for all items that are not considered representative of ongoing operational activities of the business, and
    items where the economic impact of the transactions will be reflected in earnings in future periods when the underlying asset is sold or transferred.
    Adjusted Earnings Before Interest, Taxes, Depreciation and Amortization: Defined as Adjusted Operating Earnings plus depreciation and intangible asset amortization, adjusted for
    items included in other expense that are not considered representative of ongoing operational activities. Adjusted EBITDA Margin is calculated as Adjusted EBITDA divided by sales.
    Net (Debt) Cash: Defined as cash and cash equivalents, less long-term debt and bank indebtedness.
    Construction Capital: Defined as investments and related financing charges in projects over $50.0 million that are related to longer-term strategic initiatives, with no returns expected
    for at least 12 months in the future and the asset will be re-categorized from Construction Capital once operational.

    Please refer to the Company’s Management and Discussion and Analysis for the quarter ended June 30, 2021 (as filed on SEDAR) for additional information on non-IFRS financial
    measures.
2                                                                                                                            MAPLE LEAF FOODS – Q2 2021 BUSINESS AND FINANCIAL REVIEW | AUGUST 5, 2021
Enroute to Becoming the Most Sustainable Protein Company on Earth

          13,500 employees
                                                        Total Sales (2020)           $4,304 million
                                                        Meat Protein Group                      Plant Protein Group
          32 manufacturing facilities*                                      2020 Adj.                                     2020
          prepared meats, fresh pork,
          fresh poultry and plant protein
                                                        12.4%               EBITDA
                                                                             Margin             19.5%                     Sales
                                                                                                                         Growth

          4M hogs processed annually                     Iconic
          (40% are raised in ~200                      National &
          company-operated barns with                   Regional
          leading animal care practices)                 Brand
                                                        Portfolio
          Largest producer of RWA
          pork in North America and
          poultry in Canada

          Leading presence in North
          American plant-based protein

    *Includes 5 feed mills and 3 chicken hatcheries.
3   Notes: RWA: raised without antibiotics.                MAPLE LEAF FOODS – Q2 2021 BUSINESS AND FINANCIAL REVIEW | AUGUST 5, 2021
The Maple Leaf Foods Blueprint

44                                    MAPLE LEAF FOODS – Q2 2021 BUSINESS AND FINANCIAL REVIEW | AUGUST 5, 2021

We Built a Profitable Base; Now We’re Focused on Profitable Growth
2010 Transformation 2014 2015 Brand-led Growth Today
Exited non-core businesses Expanding sustainable meats platform
Rothsay (2013)
Olivieri (2013)
Canada Bread (2014)
Renovated core brands
Transformed our supply chain
Established scale prepared meats network,
consolidating fragmented supply chain
Delivered significant efficiency and margin
improvements Establishing leadership in plant protein
Invested in technology
Deployed SAP
5 MAPLE LEAF FOODS – Q2 2021 BUSINESS AND FINANCIAL REVIEW | AUGUST 5, 2021
Well-defined Strategies and the Leading Brands to Support Them
                                                       Two businesses, with two distinct strategies
                                Meat Protein Group                                                 Plant Protein Group
                            Strategy: Drive profitable growth                                      Strategy: Invest for growth

      Our
     Brands

                Adjusted EBITDA Dollars & Margin                                   Sales
                (in millions; margin as % of sales)              $508              (in millions)

                                                                                                                            +20%             $211
    Financial
                                                      $393
      Track                                                      12.4%
                                                                                                   +27%             $176
                        $332
     Record
                                                      10.4%                                $139
                        9.9%

                        2018                          2019       2020                       2018                    2019                     2020

6                                                                                           MAPLE LEAF FOODS – Q2 2021 BUSINESS AND FINANCIAL REVIEW | AUGUST 5, 2021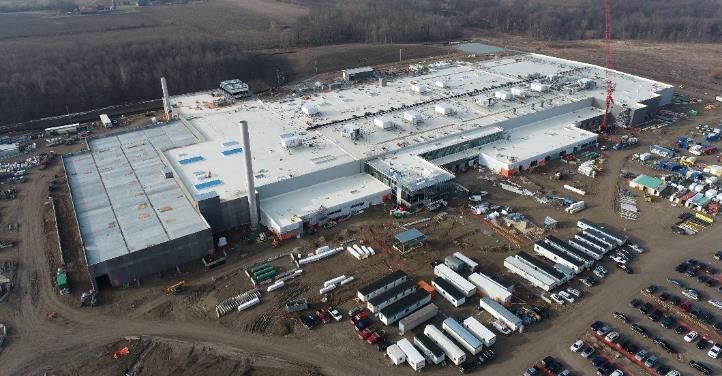
Built for Growth: 20% of Portfolio now Growing at 3-yr CAGR* >25%

    Percentage of Total Company Sales in Sustainable Meats and Plant-based Protein

                              ~10%                                                                                     ~20%

                                                                                                               2020
                                                                              High growth
                  2017
                      $3.5B                                                   Steady growth                    $4.3B

                              Deliberate repositioning of portfolio towards two high-growth categories,
                            now generating a compounded growth rate in excess of 25% in the last 3 years

     *CAGR = Compound annual growth rate; Calculated between 2017 and 2020.
7    Note: Sustainable meats includes RWA and organic sales in prepared meats, fresh poultry and fresh pork.       MAPLE LEAF FOODS – Q2 2021 BUSINESS AND FINANCIAL REVIEW | AUGUST 5, 2021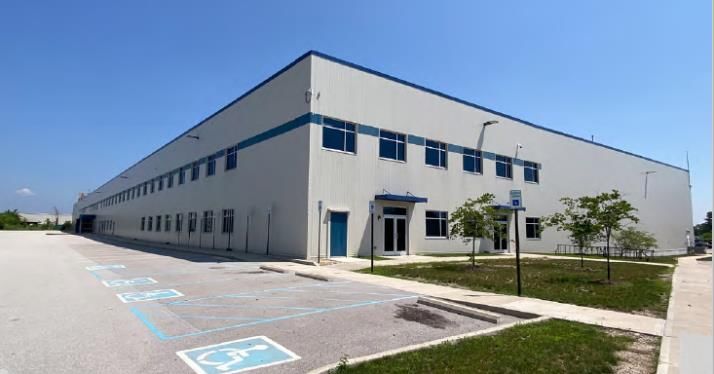
Q2 2021
    Results

8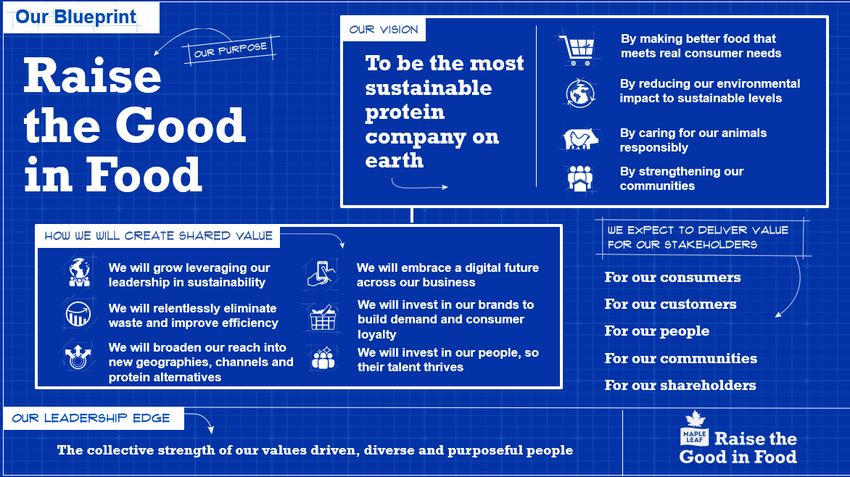
Key Highlights from Q2 2021
• Advanced strategic agenda despite transitory headwinds in Q2
Delivered another quarter of growth in sustainable meats, branded market share and U.S. sales
Efficient operating performance, demonstrating flexibility and resilience of Meat Protein supply chain
Completed Lightlife® brand renovation, launched new retail innovation and accelerated foodservice activity
• Meat Protein continues to deliver exceptional results
Strong sales growth (+7.4%) after lapping height of retail demand surge at outset of COVID-19
Healthy Adj. EBITDA margin of 11.6%, notwithstanding market headwinds and limited access to China
• Soft Plant Protein growth as expected, sales growth gaining momentum in H2
Q2 Sales down 10.4% in constant currency as industry laps height of retail demand surge at the outset of COVID-19
Revenue growth gaining momentum in the second half of 2021 as Renovation and New Product Innovation take hold,
COVID-19 impacts subside
• Meat Protein outlook unchanged; Plant Protein growth to accelerate in H2
Meat Protein: Mid-to-high single digit sales growth1, coupled with Adj. EBITDA margin expansion
Plant Protein: Sales growth for the back half of 2021 to be at least 30% in constant currency, supported by SG&A
investment broadly in-line with 2020 levels
1On a 52-week comparable basis. MAPLE LEAF FOODS – Q2 2021 BUSINESS AND FINANCIAL REVIEW | AUGUST 5, 2021
9
Looking toward the second half of 2021; Meat Protein momentum to
continue, Plant Protein growth to accelerate
Meat Protein Plant Protein
Mid-to-High single digit growth with progress toward Revenue growth drivers gaining momentum in
14-16% EBITDA Margin Target the second half of 2021
Continued proceeds of Brand Renovation of Lightlife & Field Roast
Renovation and market share brands now fully complete & in market
expansion
Core growth drivers in Lightlife
Sustainable Meats Platform, $600M+ Tempeh & Chao Cheese gaining
business growing double-digits with market share
long runway
Market leading pace & breadth of
Established growth in US market, Retail innovation
continuing to onboard new customers
& expand product distribution Established four innovative product
platforms in Food Service
Resiliency & operational efficiency of
supply chain demonstrated in COVID- Gaining distribution on shelf in Retail
19, ready for normalization & Club channels, adding new food
service customers
Transitory impacts of Q2 expected to
be behind us Business impacts of COVID-19 showing
10 signs of subsidingMeat Protein Group – Q2 2021 Strategic & Operational Highlights
Drive Profitable Growth by… Q2 2021 Highlights
• Expanded market share in prepared meats1, led by
Investing in our brands our Schneiders brand
to build demand & loyalty • Acceleration in foodservice volume growth
outpaced industry, supported by strength in
branded innovative products
Leveraging our leadership
in sustainable meats • Continued momentum in sustainable meats
portfolio with double-digit growth driven by Prime
RWA and Greenfield Brands
Broadening reach into new • Double-digit growth and market share expansion
geographies & channels
of Prime Raised Without Antibiotics (RWA) brand
• Continued double-digit growth in the U.S. market
• Announced exciting partnership with PepsiCo
Delivering operational
excellence
Foods to distribute Schneiders Pepperettes,
growing exposure in c-store and foodservice
channels
11 1 Nielsen Canada Nat+Nfld GB+DR+MM, 12 weeks ended 06/19/2021. MAPLE LEAF FOODS – Q2 2021 BUSINESS AND FINANCIAL REVIEW | AUGUST 5, 2021Meat Protein Group – Q2 2021 Key Financial Metrics
Q2 2021 vs. LY Drivers
• Higher fresh pork & poultry market prices and favourable
Sales $1,117.5 7.4% mix-shift towards branded & sustainable meats
• Partially offset by FX
Gross Profit $167.0 (5.4%) • Favourable mix-shift towards branded & sustainable meats
• Partially offset by limited access to China
Gross Margin 14.9% (210 bps) • Q2 2020 impacted by significant costs related to COVID-19
SG&A Expenses $81.2 (3.0%) • Lower variable compensation
• Partially offset by normalization of A&P spend
SG&A (as a % of sales) 7.3% (70 bps) • Other discretionary spending was similar to last year
Adj. Operating Earnings $85.9 (7.6%)
Adj. EBITDA $129.7 (6.2%)
Adj. EBITDA Margin 11.6% (170 bps)
Healthy Adj. EBITDA margins despite commodity inflation and softer market conditions
12 Note: All figures in millions, unless noted otherwise MAPLE LEAF FOODS – Q2 2021 BUSINESS AND FINANCIAL REVIEW | AUGUST 5, 2021Meat Protein Group – Putting the Q2 Pork Complex in Context
Hog Production Margins Pork Processor Margins Pork By-Product Markets
$40 $20 $8
$30 $15 $7
US/CWT
US/CWT
$10
US/CWT
$20 $6
5-yr avg.
$10 $5 $5
$0
$0 $4
-$5
-$10 Q1 Q2 Q3 Q4 Q1 Q2 Q3 Q4 $3 Q1 Q2 Q3 Q4
Hog production margins = live hog cost (CME) less Hog Raising Index Pork processor margins = pork cutout less live hog cost (CME) Notes: Figures shown represent USDA by-product drop value.
Source: Informa; CME Group. Source: USDA; CME Group. Source: USDA.
• Inflation in hog prices continued to outpace the • Higher hog prices also squeezed packer margins • Pork by-product markets remained strong in
lagged impact of rising feed costs, resulting in below seasonal averages for most of Q2 as pork Q2 due to sustained strong US exports in
sustained high hog production margins wholesale prices topped out China.
Market data suggest pork complex tailwinds … however, Maple Leaf experienced a
of 140 bps, primarily driven by continued moderate market headwind, due to forward hog
surge in live hog prices… sales and limited access to China
13 Note: 5-yr average represents smoothed trendline of 2016-2020 data for each metric. MAPLE LEAF FOODS – Q2 2021 BUSINESS AND FINANCIAL REVIEW | AUGUST 5, 2021Plant Protein Group – Q2 2021 Strategic & Operational Highlights
Invest for Growth by… Q2 2021 Highlights
• Industry laps height of initial COVID demand surge; sales
Entrenching prominent
market share position
growth gaining momentum in H2 as conditions normalize
U.S. plant protein retail market up 96% vs. Q2 2019, down 3% y/y due to
lapping Q2 2020 COVID demand
Excitement building for H2 as conditions normalize, stimulating retail and
Fostering & growing a
powerful portfolio of brands
foodservice demand
• Maintaining leading market position, with momentum in core
Greenleaf continues to hold #2 share position in U.S. refrigerated retail
Relentlessly pursuing
innovation
market with leading distribution1
Core product POS growth continued to outpace market sub-segment1, with
market share expansion in Field Roast™ Chao Cheese and Lightlife® Tempeh
Leveraging the full suite of
Maple Leaf capabilities
• Meanwhile, we are advancing our strategic agenda
Rolled out final phase of Lightlife® reformulated product, and have now
completed brand renovation work across both Lightlife® and Field Roast™
Driving efficiencies,
scale & stability
Launched exciting innovation: Lightlife Chicken tenders and fillets
Finalized agreements to add 25K+ incremental retail distribution points
New foodservice partnerships: Little Caesars, Boston Pizza, Pizzaiolo
1IRI/SPINS (US MULO + US Natural); refrigerated market only; 12 weeks ended 06/13/2021. MAPLE LEAF FOODS – Q2 2021 BUSINESS AND FINANCIAL REVIEW | AUGUST 5, 2021
14Focus Remains on Building Brands to Win at Retail
Market-Leading Innovation Pipeline
Renovation Work is Complete
in Early Stages of Gaining Distribution
Completely reformulated product line to Lightlife Chicken launched in Field Roast Stadium Dogs
deliver Clean & Simple ingredients, with Q2 with Sprouts; accepted in launched in Q2 at 3.5K+
new packaging 1.5K+ stores & growing stores; tie-ins with several
MLB stadiums
Amplified commitment to Bold Field Roast Pepperoni Chao Cheese innovations
Flavours & Indulgence, with new launched in Q2, accepted launched in Q4, accepted
packaging at 1.5K+ stores at +12.5K stores & growing
Revamped Creative Campaigns will support Rapidly Expanding Total Points of
brands in H2, 2021 Distribution in Retail Stores
Field Roast Chicken +10,000 +8,600 +4,000
Nugget in LA new TDP’s new TDP’s new TDP’s
Region (50 clubs)
16+ SKUs into +3,500 +1,750 +1,750
“Simple Ingredients for a Full Life” “Make Taste Happen” campaign distributor serving new TDP’s new TDP’s new TDP’s
campaign coming in Q3 2021 extending into Q3 & Q4 2.5K+ independents
15 MAPLE LEAF FOODS – Q2 2021 BUSINESS AND FINANCIAL REVIEW | AUGUST 5, 2021Foodservice Momentum Growing, Building Partnerships across Four
Key Food Platforms
Key Platforms Examples of Recent Wins
Field Roast™ Field Roast™
partners with Little named iconic
Field Roast™ plant-based
1 Pizza Pepperoni &
Caesars to become
the first pizza chain Dodgers Dog
Crumble to offer plant-based for LA and
pepperoni nationally rolling out to
(starting with 522 additional
outlets in July) MLB stadiums
Lightlife® Chicken
2 Chicken Tenders & Fillets
>
Field Roast™
3 Dogs Stadium Dog
Burgers, Lightlife® Burger Lightlife® Chicken 2.0 Lightlife® Chicken and
4 Grounds & Grounds,
Lightlife® Tempeh,
will be the sole plant-
based chicken supplier
Burgers launching at all 52
Field Roast™ Chao
Lightlife® Chicken
US outlets in Q3 available at all 41
& More Chao Cheese to all 575 Canadian Cheese added to the restaurants
restaurants starting July menu at all 245 US
locations
16 MAPLE LEAF FOODS – Q2 2021 BUSINESS AND FINANCIAL REVIEW | AUGUST 5, 2021Plant Protein Group – Q2 2021 Key Financial Metrics
Q2 2021 vs. LY Drivers
• Lower retail volumes as business lapped surge demand in
Sales $48.1 (10.4%) 2020 tied to COVID-19
(ex-FX)
• Partially offset by higher FS volume & Q4 pricing action
Gross Profit $0.3 (96.6%) • Strategic investments in capacity resulting in higher
overhead and transitory costs
Gross Margin 0.6% (1240 bps) • Lower sales volumes & higher trade spend also contributed
SG&A Expenses $29.8 (12.8%) • Decline primarily driven by impact of foreign exchange
• Lower variable compensation was almost entirely offset by
SG&A (as a % of sales) 61.9% +560 bps increased expenses related to organizational capacity
Adj. Operating Earnings ($29.5) nm
Adj. EBITDA ($25.9) nm
Lapping height of initial COVID demand surge weighing on growth
17 Note: All figures in millions, unless noted otherwise; nm = not meaningful MAPLE LEAF FOODS – Q2 2021 BUSINESS AND FINANCIAL REVIEW | AUGUST 5, 2021Total Company – Q2 2021 Key Financial Metrics
Q2 2021 vs. LY Drivers
Sales $1,158.9 +5.9% • Solid growth in Meat, partially offset by lower sales in Plant
Adj. Operating Earnings $56.4 (15.4%)
Adj. EBITDA $103.8 (10.3%)
Adj. EBITDA Margin 9.0% (160 bps)
Net earnings $8.8 (65.8%)
Adj. EPS $0.28 (20.0%)
Net Debt1 $1,068.2 +$461.5
Debt related to Construction Capital $703.5 +$478.6 • Increase in construction capital primarily related to the
London poultry facility
Capital Expenditure (YTD) $351.5 +$150.3
Construction Capital CapEx (YTD) $280.2 +$158.0
Healthy consolidated results, while maintaining financial flexibility for future growth
1Excludes $194.7 million in lease obligations.
18 Notes: All figures in millions, except per share amounts. MAPLE LEAF FOODS – Q2 2021 BUSINESS AND FINANCIAL REVIEW | AUGUST 5, 2021Summary of our Key Construction Capital Projects
London Poultry Facility Indianapolis Tempeh Facility
• Increases processing capacity for value-
• Cost effective and scalable approach to meet
Strategic added, higher margin poultry products Strategic burgeoning consumer demand for high-
Rationale • Gains operating efficiencies through lower Rationale growth, high-margin tempeh products
costs and consolidation of 3 sub-scale plants
• Existing 118K sq. ft. food facility
• Continued focus on paneling, mechanical,
• US$100M for acquisition & build-out of initial
plumbing and electrical work
Update • No change to budget ($720M) or Details capacity (4.5M kg/yr of tempeh production
beginning in H1/2022)
completion timing (mid-2022)
• Additional space for future growth opportunities
19 MAPLE LEAF FOODS – Q2 2021 BUSINESS AND FINANCIAL REVIEW | AUGUST 5, 20212021 &
Long-Term
Outlook
202021 Financial Outlook
Mid-to-high single digit sales growth on a 52-week comparable basis, driven by continued momentum in
Meat sustainable meats, leveraging brand renovation, and growth into the U.S. market.
Protein
Adj. EBITDA margin expansion, progressing towards the 2022 target of 14-16%, driven by mix-shift benefits in
Group prepared meats resulting from growth in sustainable meats and brand renovation, as well as operating efficiencies,
assuming pork complex conditions in-line with the 5-year average.
Sales growth in the back half of the year of at least 30%, excluding FX, in-line with our strategic target. Growth is
expected to be driven by continued momentum in the core product line, product innovation, improved velocities and
distribution in the fresh line and resurgence in foodservice activity which is largely tied to the abatement of COVID-19
restrictions. Growth is expected to accelerate as the year progresses. While the Company sees a gradual reopening of
Plant the economy in both key markets in North America, there is a lack of full visibility on the potential impact of a fourth
wave of COVID-19 on the recovery of the foodservice business.
Protein
Group Gross margin volatility in the near-term, as benefits from structural improvements in the supply chain may be
impacted by investment opportunities to drive sales growth in a rapidly evolving market, as well as COVID-19 effects.
SG&A expenses will be broadly in-line with 2020 levels, excluding FX, as the company leverages investments in
advertising, promotion and marketing to elevate its brand renovation, drive innovation and build scale in the business.
Capital expenditures in the range of $550 million to $650 million, with Construction Capital comprising
Capital approximately 75% of the spend. A significant portion of the Construction Capital is related to the London, Ontario
poultry facility, the acquisition and build-out of the plant protein facility in Indianapolis, Indiana and other projects to
21 add capacity and improve efficiency in our prepared meats business. MAPLE LEAF FOODS – Q2 2021 BUSINESS AND FINANCIAL REVIEW | AUGUST 5, 2021Reconfirming our Long-Term Outlook
2022 Adjusted EBITDA margin target of 14-16%, driven by:
Meat
Protein • Growth in sustainable meats • Mix-shift benefits from our brand
and food renovation work
Group • Cost and operational efficiencies
2029 ambitious goals for high-growth business:
Plant
Protein • Reach $3B in sales, in a $25B market • Grow into low double-digit SG&A rate
Group • Deliver approx. 30% gross margin • Adj. EBITDA margin above Meat Protein
Stakeholder Creating impactful points of difference in the market & society:
• Leverage carbon neutral position, while making • Advancing social impact through the Maple
Value progress towards our Science-Based Targets Leaf Centre for Action on Food Security
Creation • World-leading animal welfare standards • Strengthening sustainable meats leadership
22 MAPLE LEAF FOODS – Q2 2021 BUSINESS AND FINANCIAL REVIEW | AUGUST 5, 2021Appendix 23
Reconciliation of Non-IFRS Metrics – Adjusted EBITDA Margin

                                                                                         Three months ended June 30, 2021                                 Three months ended June 30, 2020
                                                                                     Meat                 Plant                                        Meat             Plant
     ($millions)(1)                                                                Protein              Protein               Non-                   Protein          Protein           Non-
     (Unaudited)                                                                    Group                Group          allocated(2)    Total         Group            Group      allocated(2)             Total
     Earnings (loss) before income taxes                                              $86.7                (29.6)             (42.9)    $14.2          $92.8            (26.3)           (29.3)             37.2
     Interest expense and other financing costs                                            —                    —               5.7       5.7              —                —               8.1              8.1
     Other expense (income)                                                             (2.0)                  0.1              5.5       3.6           (1.4)               —               4.1              2.7
     Restructuring and other related costs                                                1.2                   —                —        1.2             1.5               —                —               1.5
     Earnings (loss) from operations                                                  $85.9                (29.5)             (31.7)    $24.7          $92.9            (26.3)           (17.2)           $49.5
     Decrease (increase) in FV of biological assets                                        —                    —              51.9      51.9              —                —              26.7             26.7
     Unrealized loss (gain) on derivative contracts                                        —                    —            (20.2)    (20.2)              —                —             (9.5)            (9.5)
     Adjusted Operating Earnings                                                      $85.9                (29.5)                —      $56.4          $92.9            (26.3)               —            $66.7
     Depreciation and amortization                                                      45.8                   3.7               —       49.4            44.0              3.7               —              47.7
     Items included in other income (expense)
                                                                                        (1.9)               (0.1)                —      (2.0)             1.4               —                —               1.3
     representative of ongoing operations(3)
     Adjusted EBITDA                                                                 $129.7                (25.9)                —     $103.8         $138.2            (22.6)               —           $115.7
     Adjusted EBITDA margin                                                          11.6%              (53.9)%                 n/a     9.0%          13.3%          (37.2)%               N/A           10.6%

          1 Totals may not add due to rounding.
          2 Non-Allocated   includes eliminations of inter-segment sales and associated costs of goods sold, and non-
          allocated costs which are comprised of expenses not separately identifiable to reportable segments and
          are not part of the measures used by the Company when assessing a segment’s operating results.
          3 Primarily includes gain/loss on sale of long-term assets and miscellaneous expenses.
24                                                                                                                                          MAPLE LEAF FOODS – Q2 2021 BUSINESS AND FINANCIAL REVIEW | AUGUST 5, 2021
Reconciliation of Non-IFRS Metrics – Adjusted Earnings per Share
Three months ended June 30,
($ per share)
(Unaudited) 2021 2020
Basic earnings per share $0.07 0.21
Restructuring and other related costs(1) 0.01 0.01
Items included in other expense (income) not
0.02 0.03
considered representative of ongoing operations(2)
Change in the fair value of biological assets 0.31 0.16
Unrealized loss (gain) on derivative contracts (0.12) (0.06)
Adjusted Earnings per Share(3) $0.28 $0.35
1 Includesper share impact of restructuring and other related costs, net of tax.
2 Primarilyincludes legal fees and provisions and transaction related costs, net of tax.
3 Totals may not add due to rounding.
25 MAPLE LEAF FOODS – Q2 2021 BUSINESS AND FINANCIAL REVIEW | AUGUST 5, 2021Capital Allocation Priorities
Growth capacity and efficiency initiatives
1 Reinvest in the Business with a focus on returns metrics & timing
Capitalize on inorganic opportunities
2 Accretive Acquisitions with financial and strategic appeal
3 Dividend Appreciation Deliver consistent predictable growth
Opportunistic buybacks when return
4 Share Repurchases metrics exceed other alternatives
While maintaining a strong balance sheet with ample liquidity
26 MAPLE LEAF FOODS – Q2 2021 BUSINESS AND FINANCIAL REVIEW | AUGUST 5, 2021You can also read