MARCH 2019 INVESTOR PRESENTATION - CELSIUS HOLDINGS, INC.
←
→
Page content transcription
If your browser does not render page correctly, please read the page content below

CELSIUS HOLDINGS, INC.
MARCH 2019
INVESTOR PRESENTATION
This presentation may contain statements that are not historical facts and are considered forward-
looking within the meaning of the Private Securities Litigation Reform Act of 1995. These forward-
looking statements contain projections of Celsius Holdings’ future results of operations and/or
financial position, or state other forward-looking information. In some cases you can identify these
statements by forward-looking words such as “anticipate,” “believe,” “could,” “estimate,” “expect,”
“intend,” “may,” “should,” “will,” “would,” or similar words. You should not rely on forward-looking
statements since Celsius Holdings’ actual results may differ materially from those indicated by
forward-looking statements as a result of a number of important factors. These factors include, but
are not limited to: general economic and business conditions; our business strategy for expanding
our presence in our industry; anticipated trends in our financial condition and results of operation;
the impact of competition and technology change; existing and future regulations affecting our
business; and other risks and uncertainties discussed in the reports Celsius Holdings has filed
previously with the Securities and Exchange Commission. Celsius Holdings does not intend to and
undertakes no duty to update the information contained in this presentation.

This document includes certain non-GAAP financial measures. Management considers GAAP financial
measures as well as such non-GAAP financial information in its evaluation of the Company’s financial
statements and believes these non-GAAP measures provide useful supplemental information to
assess the Company’s operating performance and financial position. These measures should be
viewed in addition to, and not in lieu of, the Company’s diluted earnings per share, operating
performance and financial measures as calculated in accordance with GAAP.

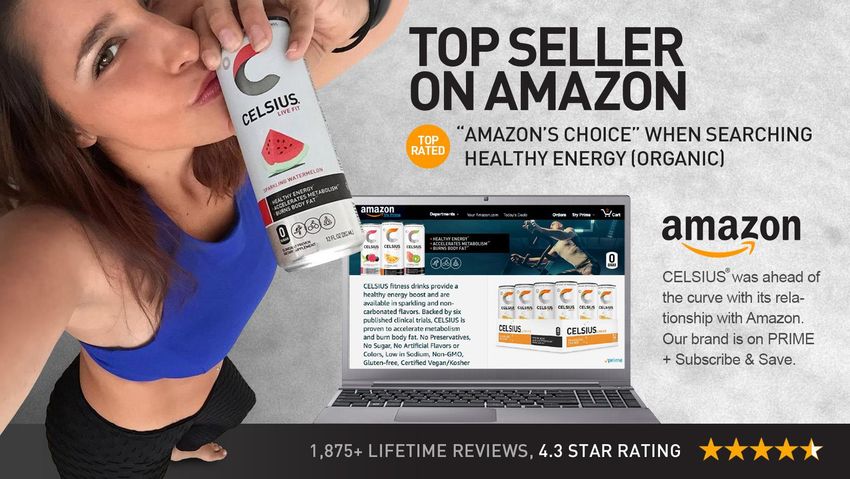
Celsius Holdings, Inc. (Nasdaq: CELH), founded
in April, 2004, is a global company, with a
proprietary, clinically proven formula for
flagship brand CELSIUS®.

Our mission - to become the global leader of a
branded portfolio which is proprietary, clinically
proven or innovative in its category, and offers
significant health benefits.
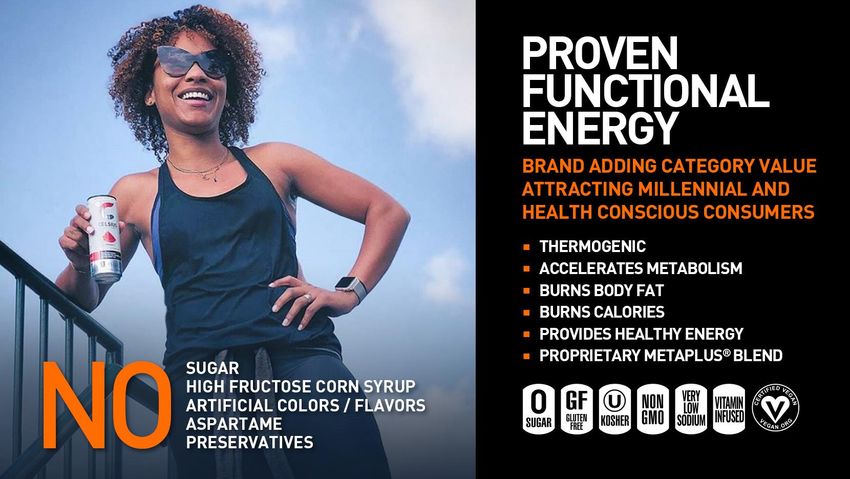
CELSIUS’® proprietary MetaPlus® formula,
including green tea with EGCG, ginger
and guarana seed, turns on
thermogenesis, a process that boosts
your body’s metabolic rate.†*

Drinking CELSIUS® prior to fitness
activities is proven to energize,
accelerate metabolism, burn body fat
and calories. †*
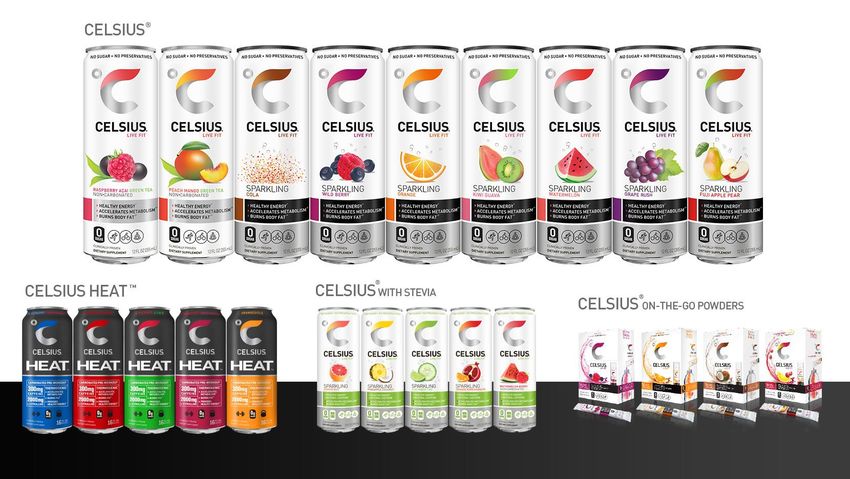

CELSIUS HEATTM is a Carbonated, Proven To
Perform, Thermogenic with METAPLUS®.

HEAT provides 100mg more caffeine than the
original line, + 2,000mg L-Citruline.
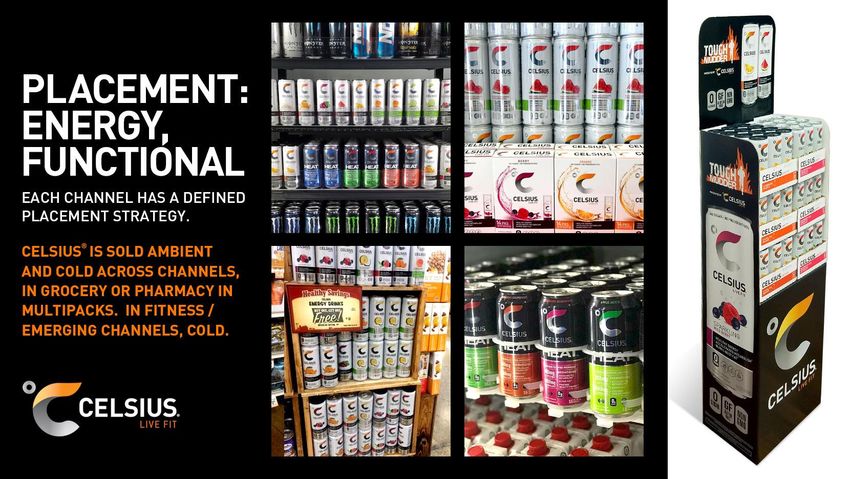
Engage and inspire consumers to
live an active healthy lifestyle and
to partner with our brands for all
facets of life!

Build brands consumers love in
emerging on-trend categories to
drive growth and shareholder
value.
• Tough Mudder – 23 cities, 161,000 attendees. 93% of attendees are sampled +15MM social media impressions

• Influencer Program: National reach to extend over 55MM followers and over 100MM impressions in 2019!

• Demos: Estimating to sample 175,000 consumers in 2019

• Media: Integrated targeted Digital and Social media campaigns
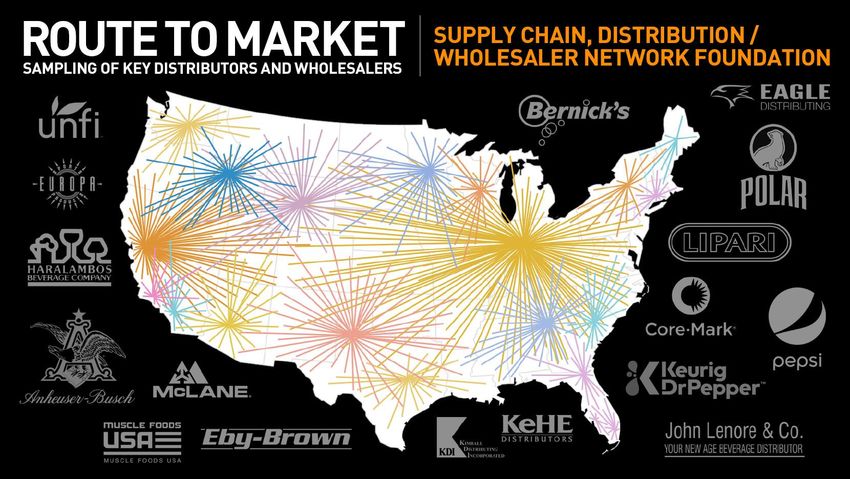
PARTNERS WITH DEFINED TERRITORIES WHICH CURRENTLY PROVIDE
MARKETING AND SALES SUPPORT WITHIN THEIR TERRITORY.

Established:
   • Sweden - Top selling FITNESS drink in Sweden
   • Finland expansion launched in 2016 adds incremental growth
   • Norway launch announced February of 2018

Additional international opportunities
with identified distribution partners
PARTNERS WITH DEFINED TERRITORIES WHICH CURRENTLY PROVIDE
MARKETING AND SALES SUPPORT WITHIN THEIR TERRITORY.

Established:
   • Hong Kong launched through A.S. Watson Water
     distributors in 2017
   • China market launched with nationwide distribution through
     partnership with Qifeng Food Technology (Beijing) Co. Ltd., A
     national wholesale distributor of foods and beverages in 2017
   • Effective January 1st 2019, a royalty license and repayment of
     investment agreement was established, creating a risk-mitigated
     method of capturing market share in China.

ADDITIONAL OPPORTUNITIES WITH IDENTIFIED DISTRIBUTION PARTNERS
GROWTH TRENDS IN REVENUE FULL COMPANY BY YEAR
Net Revenue by Year 2015-2018
$52.6m
60
$36.2m
50
40 $22.7m
In Millions
$17.2m
30
20
10
0
Total Company
2015 2016 2017 2018
- CAGR for 3 Years Total Company = >45%GROWTH TRENDS IN REVENUE BY REGION
Net Revenue by Year 2015-2018
60
50
In Millions
40
30
20
10
0
International
Domestic
2015 2016 2017 2018 Full Company
-Domestic CARG @ 64%
-International CARG @ 18%REVENUE BALANCE BY REGION
Net Revenue Year 2017 Net Revenue Year 2018
Intl 25%
Domestic Intl 33%
67% Domestic
75%
Intl Domestic Intl Domestic
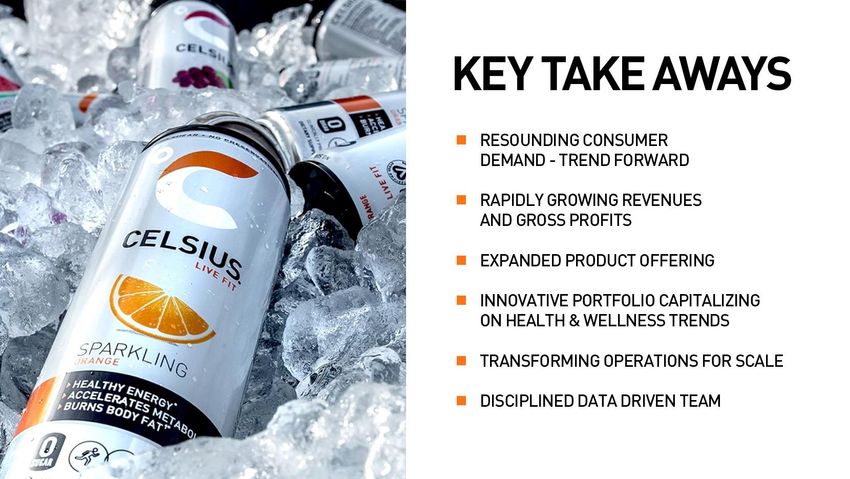
- Strong Growth in the US = > Capitalizing on Health & Wellness trends
- Driving penetration in all major market segmentsGROWTH TRENDS IN REVENUE BY QUARTER FULL COMPANY
18
Net Revenue by Quarter 2016-2018
16 16.565
14,680
14
12 12.059
10.236 10.785
10 9.140
9.298
8 6.171 6.657 6.252
6.000
6 3.678
4
2
0
2016 Q1 2016 Q2 2016 Q3 2016 Q4 2017 Q1 2017 Q2 2017 Q3 2017 Q4 2018 Q1 2018 Q2 2018 Q3 2018 Q4
- Despite some seasonality & Intl orders, business reflects an overall continued growth.GROSS PROFIT “NORMALIZATION” BY YEAR
51.8%
50.4%
50.0% 43.0%
40.0%
40.0%
30.0%
20.0%
10.0%
0.0%
2017
2018
As Reported W/O Freight
- Large competitors such as Monster exclude Out-Bound Freight as part of Cost of Sales
- When “Normalized” on a comparable basis = > Celsius Margins are north of 50%BALANCE SHEET DASHBOARD-Working Capital Components
DSO = > 39 Days w/o International DOH = > 107 Days
DSO (Daily Sales Outstanding) DOH (Days On Hand)Excludes E/O
DPO = > 57
DPO (Days Payable Outstanding) Working Capital Turns ~4
- DSO=>Includes Bill Backs=>To be Netted against Accrual - DPO=>Affected by lower Q4 vol & Inv Build
- DOH=>Reflects “Build-Up” Strategy - WC Turns=>~4 times=>Inv buildADJUSTED EBITDA COMPUTATION For the twelve Months Ended Dec 31
Twelve months ended Dec 31,
2018 2017
Net income (loss) available to common
(11,419,781) (8,606,578)
stockholders (GAAP measure)
Add back:
Depreciation and amortization expense 51,205 20,425
Net interest expense 174,409 160,616
Preferred stock dividend 213,133 365,995
Stock-based compensation 4,293,797 2,569,042
Loss on Debt Extinguishment 377,048
Non-GAAP Adjusted EBITDA (6,310,189) (5,490,500)
Non-recurring one-time charges:
Inventory write-down, Priority Testing & Label
183,042 194,040
artwork change fees
Label artwork change fees - 41,321
Recruiting fees 100,583 164,697
CEO retirement compensation - 422,659
Legal settlement 1,019,600 -
Total non-recurring one-time charges 1,303,225 822,717
Non-GAAP Adjusted EBITDA excluding one-time
(5,006,964) (4,667,783)
charges
Net Asia investment 7,192,928 7,340,980
Net Non-GAAP Adjusted EBITDA excluding net Asia
2,185,964 2,673,197
investment*
- By excluding “Non-Cash” items and non-recurring “One Timers” & China Investment business is delivering positive EbitdaHorizon Ventures: Former Founder and Celebrity & business investment arm of Chairman of ReXall mogul (several Mr. Li Ka-Shing. Asia’s Sundown Inc. which he companies), powerful wealthiest individual. built into the world’s brand builder & Assets include over leading nutritional influencer 15,000 health & beauty supplement supplier, sold retail locations for $1.8 billion in 2000
JOHN FIELDLY – PRESIDENT & CEO
John Fieldly joined Celsius in 2012 and brings extensive consumer goods and financial/operational experience with a track record of driving strong financial performance. Results Driven Executive with over 20
years of broad financial and operational experience with extensive consumer goods background. As Celsius Holdings CEO and former CFO, John has demonstrated a proven track record of driving strong business
results and shareholder value. His expertise stems from a strong background in financial leadership and operational expertise with a focus on process and procurement improvement strategies to maximize
resources to drive revenue and operational efficiencies. Prior to joining Celsius Holdings in 2012, Fieldly worked with Oragenics, Inc. (OGEN), the world leader in novel antibiotics against infectious disease and
proprietary OTC probiotics, specifically designed to enhance oral health for humans and pets. There, Fieldly held responsibility over all aspects of Oragenic’s finance functions, including financial planning, public
reporting requirements as well as optimizing operational efficiencies and implementing procurement strategies to maximize operations. Building upon his consumer and retailer experience, Mr. Fieldly has
previously held leadership roles at Lebhar-Friedman – the B2B leading media and marketing company servicing the retail industry, foodservice, healthcare, and targeted consumer markets for more than 90 years.
In that role, Fieldly was responsible for business planning, financial reporting, and overseeing financial operations. Fieldly began his career in retail within the food/drug/mass (FDM) channel through various
leadership roles with the Eckerd Corporation. His work included sales training, merchandising, impulse sales strategy and quality control. Fieldly supported the acquisition to CVS in 2004. At the time, Eckerd had
more than 2,800 stores nationwide. Mr. Fieldly is a Certified Public Accountant in Florida and a graduate of University of South Florida, where he earned his Bachelor of Science degree in Accounting.

EDWIN NEGRON-CARBALLO - CFO
Edwin Negron-Carballo brings over 30 years of financial and operational experience to the organization. His background includes domestic and international experience with work in standardization and
implementation of Six Sigma processes, in complex and dynamic environments. He is well versed in USGAAP and IFRS as a Certified Public Accountant and has significant experience in mergers and acquisitions.
His impressive and extensive career spans decades of senior financial management experience in major companies such as: Concurrent Manufacturing Solutions, Sodexo, S.A., Tyco Healthcare-Latin America,
Energizer Battery, Frito-Lay and K.P.M.G.-Peat Marwick. He was also a Member of the Board of Directors of BAS, S.A., as well as being named as a Top 25 Hispanic Business Corporate Elite. Mr. Negron-Carballo
earned an MBA from the John M. Olin School of Business at Washington University in St. Louis, Missouri, and prior, a Bachelor of Science Degree with a major in Accounting, from Louisiana State University in
Baton Rouge, LA.

MATT KAHN - EXECUTIVE VP OF MARKETING
Matt Kahn brings over 20 years of marketing experience to CELSIUS as their EVP of Marketing. Having served a majority of his career in the beverage industry, Matt has worked for companies such as The Coca-
Cola Co., Glacéau Vitaminwater®, Smartwater® and Heineken USA. From VP to CMO, Matt has held key marketing roles with each entity. His most recent title prior to joining CELSIUS in October of 2018 was that
of VP, Marketing for Save-A-Lot Food Stores. Matt began his beverage career at Coca-Cola in 1998 and in 2003 he joined Glacéau. In his leadership roles at Glacéau, Matt’s invaluable foresight strongly
contributed to Glaceau’s sale to The Coca-Cola Company for $4.1B. In 2007, Kahn served as VP, Marketing for Powerade; wherein he led the strategy to modify the formula to ION4 to differentiate it from
Gatorade – thereby introducing Powerade zero – the first zero-calorie sports drink. This bold move gained Powerade 13 share points in 2.5 years. When Matt was VP, Marketing for Heineken, he managed a
portfolio of five brands including Dos Equis, for which he led the development of a best-in-class video campaign featuring “The Most Interesting Man in the World,” garnering international appeal. Matt received
his MBA from The University of North Carolina at Chapel Hill and bachelor’s degree in Business Administration from Washington University in St. Louis.

JON MCKILLOP – SENIOR VICE PRESIDENT OF SALES – NORTH AMERICA
Jon McKillop has been recently promoted to Senior Vice President of Sales for North America, joining the CELH Executive team. Previously McKillop served as Vice President of Sales for the company’s non-
traditional channels of trade, to include Fitness, Military, Vending, Travel and Food Service. McKillop’s career has spanned over 15 years in beverage and consumer packaged goods in both traditional and
non-traditional channels of trade. Prior to his arrival at Celsius on May 3, 2016, McKillop served in a variety of management roles at Glanbia Performance Nutrition, a leading company in the branded
sports nutrition space, most recently as National Director of Sales for the organizations American Body Building brand. Before that, McKillop held management posts at large corporations Pepsi Americas,
Core-Mark International and Keurig. He holds an undergraduate degree in Marketing from Southern Oregon University.
William H. Milmoe                                       Kevin Harrington                            John Fieldly
CO-CHAIRMAN                                             DIRECTOR                                    DIRECTOR

  Finance and accounting                                  New product development                     Celsius CEO and prior CFO

  President CDS International Holdings                    TV show “Shark Tank” alumni                 Career includes roles with: Oragenics
                                                          Launched over 500 products                  leader in novel antibiotics and proprietary
  Financial career includes roles with:                                                               OTC probiotics, Lebhar-Friedman leader in
  Price Waterhouse, General Cinema                        “As seen on TV” infomercial pioneer
                                                                                                      B2B publishing, Eckerd Corporation
  Corp, Pepsi, independent bottler

Tony Lau                                  Nick Castaldo                          Thomas E. Lynch               Hal Kravitz
CO-CHAIRMAN                               DIRECTOR                               DIRECTOR                      DIRECTOR

 Horizons Ventures                          Consumer services business            Insurance                       Extensive CPG/Beverage career and
                                                                                                                  experience across all business functions
 Asian market expert                        Chain restaurant, banking and         Banking
                                            retailing                                                             Chairman, Board of Directors
 IB professional, M&A                                                             Public official                  Certified Management Group
                                            Equity Partner and member of                                          Former CEO AQUA Hydrate
                                            the founding management
                                            team of Anthony’s Coal Fired                                          30 Year career at the Coca-Cola Company,
                                                                                                                  most recently, President, Glaceau Division
                                            Pizza
CELSIUS HOLDINGS, INC.
C O M PA N Y C O N TA C T S I N V E S T O R R E L AT I O N S
John Fieldly, CEO Cameron Donahue, Partner
Celsius Holdings, Inc. Hayden IR
561.276.2239 651.653.1854
jfieldly@celsius.com cameron@haydenir.com
VISIT OUR NEW INVESTOR
Edwin Negron, C F O
WEBSITE:
Celsius Holdings, Inc.
CELSIUSHoldingsINC.COM
561.900.2351
enegron@celsius.comINCOME STATEMENT- Consolidated Statements of Operations
For the year
ended December 31,
2018 2017
Revenue $ 52,603,986 $ 36,164,064
Cost of revenue 31,543,608 20,733,387
Gross profit 21,060,378 15,430,677
Selling and marketing expenses 1 21,213,530 16,611,369
General and administrative expenses 10,487,592 6,899,275
Total operating expense 31,701,122 23,510,644
Loss from operations (10,640,744) (8,079,967)
Other Expense:
Interest expense (174,409) (160,616)
Loss on Debt Extinguishment (377,048) -
Amortization of Discount on Notes Payable (14,447) -
Total Other Expense (565,904) (160,616)
Net Loss (11,206,648) (8,240,583)
Preferred stock dividend – other (213,133) (365,995)
Net Loss available to common stockholders $(11,419,781) $ (8,606,578)
Weighted average shares outstanding 50,050,696 44,419,162
Loss per share, basic and diluted $ ($0.23) $ (0.19)BALANCE SHEET
December 31, December 31,
2018 2017
ASSETS
Current assets:
Cash $ 7,743,181 $ 14,186,624
Accounts receivable, net 12,980,396 6,375,658
Inventories, net 11,482,701 5,305,505
Prepaid expenses and other current assets 2,299,375 1,180,444
Total current assets 34,505,653 27,048,231
Property and equipment, net 121,854 62,642
Total Assets $ 34,627,507 $ 27,110,873
LIABILITIES AND STOCKHOLDERS’ EQUITY
Current liabilities:
Accounts payable and accrued expenses $ 14,845,211 $ 6,311,824
Accrued preferred dividend - 133,883
Other current liabilities 19,933 17,921
Total current liabilities 14,865,144 6,463,628
Long-term liabilities:
Revolving line of credit-note payable-related party 3,500,000 3,500,000
Note payables-related party 4,459,381 -
Total Liabilities 22,824,525 9,963,628
Stockholders’ Equity:
Preferred Stock, $0.001 par value; 2,500,000 shares authorized, zero and 6,760
shares issued and outstanding at December 31, 2018 and December 31, 2017,
respectively - 7
Common stock, $0.001 par value; 75,000,000 shares authorized, 57,002,508 and
45,701,593 shares issued and outstanding at December 31, 2018 and December 31,
2017, respectively 57,003 45,702
Additional paid-in capital 85,153,667 79,101,824
Accumulated other comprehensive loss (26,997) (39,378)
Accumulated deficit (73,380,691) (61,960,910)
Total Stockholders’ Equity 11,802,982 17,147,245
Total Liabilities and Stockholders’ Equity $ 34,627,507 $ 27,110,873You can also read