Marine Sectoral Overview - Galway City and County Economic and Industrial Baseline Study - Galway Dashboard
←
→
Page content transcription
If your browser does not render page correctly, please read the page content below

           Marine Sectoral
                 Overview
       Galway City and County Economic
           and Industrial Baseline Study

       MARINE SECTORAL OVERVIEW

             James Cunningham
               Brendan Dolan
                 David Kelly
                Chris Young

                  03/04/2015
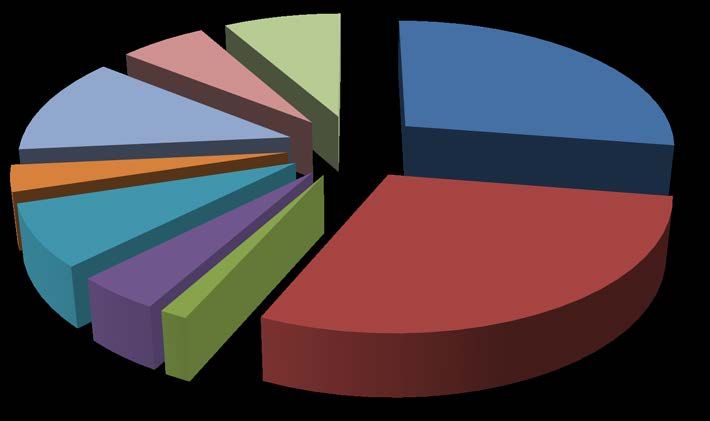
Table of Contents

Executive Summary Overview of the Marine Sector ........................................... 6


Global Overview of the Marine Sector ........................................................... 10


1
   Established Marine Activities ....................................................................... 10

       1.1
     Shipping and Shipbuilding ............................................................................. 10

       1.2
     Capture Fisheries .......................................................................................... 11

       1.3
     Traditional Maritime and Coastal Tourism ..................................................... 11

       1.4
     Port Facilities and Handling ........................................................................... 11


2
   Emerging Marine Activities........................................................................... 13

       2.1
     Off-shore Wind Industry ................................................................................ 13

       2.2
     Tidal and Wave Energy ................................................................................. 13

       2.3
     Deep-sea Oil and Gas Extraction .................................................................. 13

       2.4
     Marine Aquaculture ....................................................................................... 13

       2.5
     Marine Biotechnology .................................................................................... 14

       2.6
     Sea-Bed Metal and Mineral Mining ............................................................... 14

       2.7
     Tourism and Leisure ...................................................................................... 14

       2.8
     Ocean Monitoring Control and Surveillance .................................................. 15

       2.9
     EU Policy Objectives ..................................................................................... 15

       2.9.1
   Integrated Maritime Policy ............................................................................. 15

       2.9.2
   Common Fisheries Policy (CFP) ................................................................... 15

       2.9.3
   Ocean Energy Forum .................................................................................... 16

       2.9.4
   A European Strategy for more Growth and Jobs in Coastal and Maritime
       Tourism ..................................................................................................................... 16

       2.9.5
   LeaderSHIP 2020 .......................................................................................... 16


National Overview of the Marine Sector ........................................................ 17


3
   Established Marine Activities ....................................................................... 17

       3.1
     Shipping and Maritime Transport .................................................................. 18

       3.2
     Water-based Tourism and Leisure ................................................................ 19

       3.3
     National Cruise Industry ................................................................................ 19

       3.4
     Other Marine Services ................................................................................... 21

       3.5
     Sea Fisheries ................................................................................................ 21
       3.6
     Aquaculture ................................................................................................... 21

       3.7
     Seafood Processing ...................................................................................... 22

       3.8
     Oil and Gas Exploration and Production ....................................................... 22

       3.9
     Marine Manufacturing .................................................................................... 23


4
   Emerging Marine Activities........................................................................... 23

       4.1
     High Tech Marine Products and Services ..................................................... 24

       4.2
     Marine Commerce ......................................................................................... 24

       4.3
     Marine Biotechnology .................................................................................... 24

       4.4
     Marine Renewable Energy ............................................................................ 24

       4.5
     Integrated Marine Plan for Ireland ................................................................. 25


Regional and Local Overview of the Marine Sector ..................................... 26


5
   Established Marine Activities ....................................................................... 27

       5.1
     Aquaculture ................................................................................................... 27

       5.2
     Regional Cruise Industry ............................................................................... 28

       5.3
     Water-based Tourism and Leisure ................................................................ 29

       5.4
     Galway Fisheries ........................................................................................... 31

       5.5
     Seafood Processing ...................................................................................... 32

       5.1
     Oil & Gas Exploration and Production ........................................................... 33

       5.2
     Marine Manufacturing .................................................................................... 33


6
   Emerging Marine Activities........................................................................... 34

       6.1
     Marine Renewable Energy ............................................................................ 34

       6.2
     Marine Biotechnology .................................................................................... 35

       6.3
     Marine Commerce ......................................................................................... 35

       6.4
     Sea-bed Metal and Mineral Mining ................................................................ 35

       6.5
     Inland Waterways Development .................................................................... 36

       6.6
     Marine Transport and Cruises ....................................................................... 36

       6.7
     Research and Development Activities ........................................................... 37


7
   References ................................................................................................... 42
THE WHITAKER INSTITUTE


Acknowledgements
We wish to acknowledge the support of Liam Hanrahan, Patricia Philbin, Sharon Carroll, Niamh
Farrell of Galway City Council and Alan Farrell and Brian Barrett of Galway County Council in
preparing this sectoral review.

Our Approach1
Our approach in undertaking this overview of the marine sector was to take a global and
national perspective before focusing on the regional and local level. One of the main limitations
we faced preparing this sector review is the lack of quality and reliable data at the local level.
The framing of the global and national level overviews against publicly available local data
provides a basis and context to consider the future of the in Galway City and County.


1
  The information contained in this overview has been compiled from many sources that are not all controlled by the
Whitaker Institute. While all reasonable care has been taken in the compilation and publication of the contents of this
resource, Whitaker Institute makes no representations or warranties, whether express or implied, as to the accuracy or
suitability of the information or materials contained in this resource.

                                                                                                                                                    MARINE SECTORAL OVERVIEW                                                       5
THE WHITAKER INSTITUTE


Executive Summary Overview of the Marine
Sector

Global Overview
          $1.2 trillion is the estimated worldwide economic value of marine goods and
           services.

          The weakness of fisheries governance is considered to be the main problem
           behind overfishing and stock decline.

          It is estimated that 52% of global fisheries are being fished at their maximum
           limit, 24% are overfished, depleted or recovering.

          Marine and coastal tourism is one of the fastest growing areas within the global
           marine industry.

          Approximately 9.2 billion tonnes of goods were loaded into ports worldwide,
           crude oil, petroleum products and gas accounts for one third of these while two
           thirds are dry-cargo shipments fuelled by growing Asian demand for iron ore
           and coal.

          Off-shore Wind Industry is the most mature of the ocean based energy sources
           with a global installed capacity of over 6 GW with estimates of growth to 175
           GW by 2035.

          Tidal barrages and wave power are still at the demonstration stage.

          Oil is predicted to remain the dominant fuel through to 2035.

          Aquaculture, with extensive growth in Asia is expected to grow 33% to 79
           million metric tons by 2021 while capture fisheries are expected to grow by only
           3%.

          Marine Biotechnology industries are estimated at approximately $2.8 billion and
           expected to grow to $4.6 billion by 2017.


National Overview
          The latest estimated economic value of Ireland’s ocean economy as of 2007 is
           valued at €1.44 billion or 1% GDP, providing employment for 17,000 people.

                                                            MARINE SECTORAL OVERVIEW          6

THE WHITAKER INSTITUTE


             Emerging activities consist of renewable ocean energy, marine commerce,
              high-tech services and marine biotechnology.

             Some 99% of Ireland’s total imports and exports are transported by sea. Sea-
              based shipping is the second largest provider in terms of turnover, value added
              and employment within the established marine sector.

             Ireland’s water-based tourism and leisure industry generated €453 million gross
              value added to the economy, employing 5,800 people in 2007.

             190 cruise liners docked in Ireland carrying 162,797 passengers in 2012.

             2,125 registered fishing vessels currently on the Irish Fishing Boat Register
              representing 2% of the European fishing fleet.

             The volume and value of fish landed by Irish vessels in home ports for 2012
              amounts to 280,000 tonnes valued at €270 million.

             Ireland has the 7th largest aquaculture sector in the EU, producing 48,350 tons
              of aquaculture in 2007.

             The Irish seafood market is valued at €830 million with shellfish exports valued
              at €172 million due to an increasing demand for Irish oysters, crab and
              mussels.

             Oil and gas provide over 80% of Ireland’s primary energy supply with €1.5
              billion expected to be spent on oil and gas exploration over the next 3 years.

             In 2007 marine manufacturing accounted for approximately €265 million, with
              exports accounting for €12 million.

             High Tech Marine Products and Services had a turnover of €43.6 million in
              2007, employing 350 people.

             Marine Commerce produces the highest turnover within the emerging marine
              activities.

             Marine biotechnology accounted for a turnover of €18 million in 2007,
              employing 185 people.

             Due to the EU target of reducing CO2 emissions by 20% by 2020 the
              government has set a target of generating 40% of electricity from renewable
              sources.


                                                              MARINE SECTORAL OVERVIEW           7

THE WHITAKER INSTITUTE


Regional and Local Overview
          There are 114 agriculture, forestry and fishing industries in Galway city and
           county, employing 5908 people (2011 Census).

          In 2012, Galway produced 23% of the total nationwide production of salmon,
           and 33% of edulis oysters.

          8 cruise ships dock in Galway Harbour in 2014, with the same number expected
           to dock in Galway in 2015.

          Active water-based activities of Galway include sea angling, pleasure boating,
           windsurfing, scuba-diving, canoeing and water-skiing.

          There are currently 7 blue-flag beaches in Galway, with 2 in the City

          There were 35 companies involved in water based leisure activities in 2010 in
           Galway

          319 registered vessels on the Irish Boat Register are owned by people living in
           Galway, out of a total 2,125.

          17 aquaculture and fishing companies in Galway.

          In 2012, Galway produced 2742 tonnes of salmon of a total nationwide
           production of 12,000 tonnes, 1012 tonnes of rope mussels, and 15 tonnes of
           freshwater trout.

          Rossaveal is the main port in the west of Ireland (4kt per year, 31 vessels) and
           receives a mix of pelagic, demersal and shellfish species.

          In 2013, Rosaveel ranked 4th in the top 20 Irish ports in terms of monetary
           value of yearly haul.

          Bord Iascaigh Mhara lists 11 seafood processors in Galway County, with four of
           these based in Galway City.

          Galway has the best marine manufacturer to population ratio.

          The Corrib gas project has provided benefits to Galway, connecting four towns
           in Galway to the national gas network

          There are 10 angling clubs and related services in the City and County.

          There are 9 sailing clubs and related services in the City and County.

                                                            MARINE SECTORAL OVERVIEW          8
THE WHITAKER INSTITUTE


          A recent discovery of 61 tonnes of bullion from a British cargo ship that sank in
           1941, 300 miles off the coast of Galway, underlines the potential for deep sea
           exploration.

          A significant public research infrastructure exists in the City and County.


                                                             MARINE SECTORAL OVERVIEW          9

THE WHITAKER INSTITUTE


Global Overview of the Marine Sector

Global Overview

Introduction
The estimated worldwide economic value of marine goods and services is $1.2 trillion (World
Ocean Council, 2014). The ocean economy can be divided into established marine activities
and emerging marine activities.       Established activities include shipping and shipbuilding,
capture fisheries, traditional maritime and coastal tourism and port facilities and handling.
Emerging activities encompass off-shore wind, tidal and wave energy, deep-sea oil and gas
extraction, marine aquaculture, marine biotechnology, sea-bed metal and mineral mining,
tourism and leisure, ocean monitoring, control and surveillance (OECD, 2013).


1 Established Marine Activities
1.1 Shipping and Shipbuilding
China, the Republic of Korea and Japan together built 92% of the world’s new ships in 2013
(UNCTAD, 2013).      Although there are limited available efficiency improvement options for
existing ships, it has been forecasted that new built ships will adopt hull optimisation in order to
meet with the EEDI requirement in 2015. A projection of 7-8% new buildings will use smaller,
gas fuelled engines by 2020. It is estimated that due to the 0.1% limit in Emission Control
Areas (ECA) and the introduction of the global sulphur limit in 2020 the demand for marine
distillates could increase from 30 million tonnes to 200-250 million tonnes annually.             The
demand for liquid natural gas (LNG) will be 8-33 tonnes with more than 1 in 10 new built ships
having LNG fuelled engines. The demand for regulatory compliant, more cost effective ships
will increase by 2020 including tank, bulk and container vessels and scrubbers.           With the
ratification of The Ballast Water Management Convention (BWMC) new water treatment
systems will be installed on at least half of the world fleet (DNV report Shipping 2020, 2012).

The International Maritime Organisation’s global sulphur limit and Phase 2 of the EEDI to be
implemented in 2020 are the strongest drivers of change in the shipping industry.                 The
increasing cost of fuel will drive the demand for new energy efficient ships that use alternative
fuels such as LNG, power systems and light weight construction (DNV Report Shipping 2020,
2012).

                                                                MARINE SECTORAL OVERVIEW                10
THE WHITAKER INSTITUTE


1.2 Capture Fisheries
With the world’s population expected to grow to 9 billion by 2050 and the already over-exploited,
depleted or recovering from depletion wild fish stocks, the capture fisheries stocks are under
great pressure. As well as over fishing there are growing concerns of organic pollution, toxic
contamination, coastal degradation and climate change. Ensuring a sustainable global harvest
and the maintenance of the biodiversity of the marine ecosystem with the ability to adapt to
climate change is dependable on the fisheries governance, the national and international policy
and legal frameworks (Garcia & Rosenberg, 2010).

The weakness of fisheries governance is considered to be the main problem behind overfishing
and stock decline (Beddington et al. 2007). The implementation framework of the 1982 United
Nations Convention on the Law of the Sea (UNCLOS) in 1994 has begun to improve the issues
within the capture fisheries industry but governance of the high seas is still a major problem
(Garcia & Rosenberg, 2010).

It is estimated that 52% of global fisheries are being fished at their maximum limit, 24% are
overfished, depleted or recovering. Due to this, global fisheries’ production is projected to slow
to an average of 2.1% annual growth rate between 2005 and 2030. The effect on associated
businesses will be extensive (OECD, 2008).


1.3 Traditional Maritime and Coastal Tourism
Marine and coastal tourism is one of the fastest growing areas within the global marine industry.
It contributes significantly to national economy (Hall, 2001). Cruise tourism has increased 24-
fold since 1970 with an estimated 16 million people boarding ocean liners annually.           The
average annual passenger growth rates are approximately 7.5%. This industry has not reached
its maturity and will continue to grow due to rising incomes, ageing populations and increasing
leisure time. A challenge remains however, of resolving the conflict between the economic
benefits and the strains on the environment especially as the cruise industry expands to new
destinations like the Artic (OECD, 2013).


1.4 Port Facilities and Handling
International seaborne trade performed better than the world economy in 2012 with volumes
increasing by 4.3% (UNCTAD, 2013). Approximately 9.2 billion tonnes of goods were loaded
into ports worldwide. One third of these goods accounts for crude oil, petroleum products and

                                                              MARINE SECTORAL OVERVIEW               11
THE WHITAKER INSTITUTE


gas while two thirds are dry-cargo shipments fuelled by growing Asian demand for iron ore and
coal. The Panama Canal expansion to be completed by 2015 is driving port development in the
Americas. Nicaragua plans to build a canal three times longer than the Panama Canal within
50 years while the port sector in Peru will receive a $2 billion investment by 2015. The growth
of seaborne trade is greatly influenced by China’s domestic demand for raw materials and leads
the world in terms of port throughput (UNCTAD, 2013). Figure 1 illustrates the world seaborne
trade by geographical region. Asia dominates the main loading and unloading region. Africa’s
impact on shipping is the lowest but is poised to expand as it exploits its rich source of
resources. As almost 90% of the world’s merchandise and commodity trade is transported by
ships, ports are vital to the global economy. In order to handle the growth of this industry there
is a greater need for planning, asset management and investment. Infrastructure such as rail
and road must keep up to date with the growth of this industry. As a result ports are generally
government owned. This can allow for the constraint by political forces, governance issues and
regulatory risk. Privatisation in recent years is becoming more popular as many governments
are facing budget deficits. Privatisation allows for many ports to handle increasing trade, larger
vessels and port security (UNCTAD, 2013).

Figure 1:
World Seaborne Trade by Geographical Region, 2013

                                   60


                                   50


                                   40

        % share in world tonnage

                                   30


                                   20


                                   10


                                     0

                                             Asia
     Americas
     Europe
      Oceania
     Africa

          loaded
                            41
        22
           17
          11
          9

          unloaded
                          58
          15
          21
           1
          5


Adapted from (UNCTAD, 2014).

                                                                                    MARINE SECTORAL OVERVIEW           12
THE WHITAKER INSTITUTE


2 Emerging Marine Activities
2.1 Off-shore Wind Industry
This is the most mature of the ocean based energy sources with a global installed capacity of
over 6 GW with estimates of growth to 175 GW by 2035 (International Energy Agency, 2012).
Despite this projected growth the challenges of offshore wind technology include usage of
maritime space, planning restrictions, competition from other ocean activities, international
boundary issues and expensive high-voltage sub-sea cables and construction vessels
(International Energy Agency, 2012).


2.2 Tidal and Wave Energy
Tidal barrages and wave power are still at the demonstration stage. Only four tidal range power
plants exist in the world. A large plant is in operation in South Korea and another one in France
with two smaller plants in Canada and China. Other forms of wave energy include underwater
tidal turbines which are close to commercialisation, salinity gradient and floating wind
technologies (EY, 2013).


2.3 Deep-sea Oil and Gas Extraction
Until the development of renewable sources of energy, oil is predicted to remain the dominant
fuel through to 2035 (OECD 2012). The only growing segment of the industry accounting for a
third of gross oil production is offshore crude oil. It is estimated that almost half of the remaining
oil is in deep offshore fields (IEA, 2012). The Artic has a predicted 30% of the undiscovered
gas and 13% of the undiscovered oil.


2.4 Marine Aquaculture
As demand for fish increases and as capture fisheries remains static, growth will need to come
from aquaculture. Aquaculture, with extensive growth in Asia is expected to grow 33% to 79
million metric tons by 2021 while capture fisheries are expected to grow by only 3%
(OECD/FAO, 2012). The growth rate of aquaculture is expected to slow, from an average
annual of 5.8% to 2.4% coming 2021 due to water constraints, limited production locations and
increasing overheads. This is predicted to in turn drive up the price of fish and seafood as
demand exceeds supply. The majority of future aquaculture production will move off-shore and
will have to handle such challenges as issues with invasive species and fish disease

                                                                 MARINE SECTORAL OVERVIEW                13
THE WHITAKER INSTITUTE


(OECD/FAO, 2012). There is however a high global demand for finfish, oysters and mussels
(Department of Agriculture, Food and the Marine, 2014).


2.5 Marine Biotechnology
“Marine biotechnology, sometimes referred to as “blue biotechnology”, exploits the diversity
found in marine environments in terms of the form, structure, physiology and chemistry of
marine organisms in ways which enable new materials to be realised.” (Marine Institute, 2014).
This industry is estimated at approximately $2.8 billion and is expected to grow to $4.6 billion by
2017 (OECD, 2012). Marine microbes, like bacteria demonstrate a rich source of health drugs.
The marine ecosystem provides a relatively untapped resource for drug development. As well
as providing human health products, marine biotechnology can potentially develop sustainable
sources of alternative energy to gas and oil such as algal biofuels. Recent advances in marine
biotechnology as a new source of economic growth has enticed many governments to invest in
grants and development strategies in an effort to release the potential of this industry. The EU
has several programmes in operation to support marine biotechnology including the AMPERA,
MarinERA, MARIFISH and SEAS-ERA (OECD, 2013).


2.6 Sea-Bed Metal and Mineral Mining
Rising value and demand for minerals and metals such as copper, zinc, gold and silver and due
to the limited land-based resources; sea-bed mining is becoming more prevalent. Rare and
valuable elements such as yttrium, dysprosium and terbium, vital for electric vehicles, ICT
hardware and renewable energy resources can be mined at the sea-bed. Although deep-sea
mining for minerals is still exploratory in nature, coal has been harvested from the sea for
decades (Paul & Beckford, 2014).       Several countries have applied for sea-bed exploration
licences including New Zealand, The Cook Islands, Brazil, Germany, Britain, China, Japan and
South Korea. Technological and environmental issues are two of the principal hurdles within
this new sector (Goldenberg, 2014).

2.7 Tourism and Leisure
Prospects of new forms of ocean-related tourism include underwater hotels. Such hotels are in
operation and their success is generating interest with companies. The Utter Inn in Sweden
floats on the surface of Lake Mälaren. Although being a one room hotel it drew worldwide
attention on its opening in 2000. The world’s first underwater restaurant in the Maldives has
also generated great interest (Brady, 2014). The deep sea is becoming an emerging adventure

                                                               MARINE SECTORAL OVERVIEW               14
THE WHITAKER INSTITUTE


tourist destination.   Deep Ocean Expeditions LLC are currently taking tourists to depths of
17,000 feet, pushing the boundaries of marine tourism (Leary, 2007).


2.8 Ocean Monitoring Control and Surveillance
The control and surveillance of the ocean is necessary to help prevent such illegal activities as
piracy and poaching, the protection of conservation zones and the overall protection of the
marine ecosystem.      Scarce and expensive infrastructure is necessary to implement ocean
monitoring consisting of marine-security vessels, satellite sensing, submersible and fixed
platforms and in-situ sensors (OECD, 2012). New companies which provide high tech marine
products necessary for ocean monitoring have emerged since 2003 due to new marine
regulations (SEMRU, 2010).


2.9 EU Policy Objectives
2.9.1 Integrated Maritime Policy
The EU Integrated Maritime Policy seeks to provide a coherent approach to maritime issues,
with increased coordination between different policy areas, and emphasizes the following cross-
cutting policies: blue growth, marine data and knowledge, maritime spatial planning, integrated
maritime surveillance, and sea basin strategies. The objective is to coordinate all EU policies
with a marine dimension in order to safeguard environmental sustainability and quality of life in
coastal regions while promoting the growth potential of maritime industries. Examples of some
of the European Commission policy initiatives relating to the Irish marine sector are set out
below.


2.9.2 Common Fisheries Policy (CFP)
Most recently updated in January 2014, the CFP sets out procedures for managing European
fishing fleets and for conserving fish stocks, giving all European fishing fleets equal access to
EU waters and fishing grounds and allowing fishermen to compete fairly. The current policy
stipulates that between 2015 and 2020 catch limits should be set that are sustainable
and maintain fish stocks in the long term. Regulations are set on total allowable catches, fishing
licenses, boat capacity management, minimum fish and mesh sizes, design and use of gears,
closed areas or seasons, and reducing of environmental impact. For example, the European
Commission recently (January 2015) announced measures to avert the collapse of the declining
sea bass stock. Immediately effective emergency measures will place a ban on targeting the

                                                              MARINE SECTORAL OVERVIEW               15
THE WHITAKER INSTITUTE


fish stock by trawling while it is reproducing, during the spawning season, which runs until the
end of April.


2.9.3 Ocean Energy Forum
The European Commission has developed a two-step action plan to support the emerging
Ocean Energy Sector with the intention of bringing innovative new technologies to bear in wave
and tidal power generation through various collaborations. In the first phase (2014 – 2016),
an Ocean energy forum has been set up, with TiP Ocean, the Technology and Innovation
Platform for Ocean Energy, providing the technology work stream for the Forum. The outcomes
of this Forum will feed into a strategic roadmap, which will provide an agreed blueprint for action
in order to help the ocean energy sector move towards industrialisation. The second phase
(2017 – 2020), a European industrial initiative, will be a public-private partnership that brings
together industry, researchers, Member States and the Commission to set out and implement
clear and shared objectives over a specific timeframe.


2.9.4 A European Strategy for more Growth and Jobs in Coastal and
      Maritime Tourism
Launched on 20 February 2014, this document presented a new strategy to enhance coastal
and maritime tourism in Europe in order to unlock the potential of this promising sector. The
Commission has identified 14 actions which can help the sector grow sustainably and provide
added impetus to Europe's coastal regions. These include proposing to develop an online
guide to the main funding opportunities available for the sector (particularly SMEs), promotion of
ecotourism and strategies on waste prevention, management and marine litter, and contracting
a study on how to improve island connectivity and design innovative tourism strategies for
(remote) islands (European Commission, 2014).


2.9.5 LeaderSHIP 2020
The aim of the LeaderSHIP 2020 strategy is to increase the competitiveness of European
maritime technology and tackle the new challenges the EU shipbuilding sector is facing. The
strategy gives a fresh impetus to the ship and maritime building industry in the areas of
innovation, greening, application of new technologies and diversification into new emerging
markets, such as off-shore wind energy. The strategy’s recommendations range from the wider
use of EU instruments to foster new skills, competence and qualifications, to Public Private
Partnerships for new maritime research, EIB funding opportunities and smart specialisation
strategies in regional policy.


                                                               MARINE SECTORAL OVERVIEW               16
THE WHITAKER INSTITUTE


National Overview of the Marine Sector

National Overview

Introduction
The estimated economic value of Ireland’s ocean economy as of 2007 is valued at €1.44 billion
or 1% GDP, providing employment for 17,000 people (SEMRU, 2010).                 Ireland’s ocean
economy can be divided into established marine activities and emerging marine activities.
Established marine activities include shipping and maritime transport, water-based tourism and
leisure, seafood processing, fisheries, aquaculture, marine manufacturing, marine services and
oil and gas. Emerging activities consist of renewable ocean energy, marine commerce, high-
tech services and marine biotechnology (SEMRU, 2010).            NUI Galway’s Socio-Economic
Marine Research Unit (SEMRU) provides this report with data for 2007. The Taoiseach has
recently launched a plan to double Ireland’s ocean economy to €6.4 billion or 2.4% GDP by
2010 (Inter-Departmental Marine Coordination Group, 2012). There has been limited research
conducted on Ireland’s ocean economy, but the Marine Institute published Ireland’s first report
in 2005 analysing Ireland’s ocean economy.        In 2007, the government implemented ‘Sea
Change’ a marine knowledge R&I strategy for Ireland and then in 2010 with the SEMRU report.


3 Established Marine Activities
The established activities in the marine sector of Ireland had a turnover of €3.2 billion in 2007,
employing 16,340 people (SEMRU, 2010).          Employment within the fisheries sector alone
provide for 10,768 jobs (Department of Agriculture, Food and the Marine, 2014). Figure 2
illustrates the percentage turnover of national industries within the established marine sector.
Water based tourism and leisure and shipping and maritime transport account for 57% of the
national industry turnover.


                                                              MARINE SECTORAL OVERVIEW               17
THE WHITAKER INSTITUTE
Figure 2:
Percentage Turnover of National Industries within the Established Marine Sector
Marine
Shipping
&
Manufacturing
Mari�me
Oil
&
Gas
8%
Transport
6%
28%
Seafood
Processing
12%
Water-‐based
Tourism
&
Leisure
29%
Aquaculture
3%
Sea-‐Fisheries
8%
Other
Marine
Cruise
Serivces
2%
4%
(Adapted from SEMRU, 2010)
3.1 Shipping and Maritime Transport
Some 99% of Ireland’s total imports and exports are transported by sea. Sea-based shipping is
the second largest provider in terms of turnover, added value and employment within the
established marine sector (SEMRU, 2010). Most shipping activity in Ireland occurs around the
primary nine ports of Cork, Drogheda, Dublin, Dundalk, Dun Laoghaire, Galway, New Ross,
Foynes and Wicklow (SEMRU, 2010). The Port of Cork’s turnover increased by over 6% in
2013 (Ashmore, 2014). The smaller port of Warrenpoint in Co. Down also displayed turnover
enhancements by doubling its gross profits in 2013 (Ashmore, 2014). Figure 3 illustrates the
drop in imports and exports during the peak of Ireland’s recession, but also illustrates its current
recovery. Irish shipping and port activity rose 2% in 2nd quarter of 2014 (IMDO, 2014).
MARINE SECTORAL OVERVIEW 18
THE WHITAKER INSTITUTE


Figure 3:
Volume of Goods Handled by Irish Ports

                             60,000


                             50,000

       Tonnes
  (000)


                             40,000


                             30,000
                                                                                        Goods
  handled


                             20,000
                                                                                        Good
  Received


                                                                                                                             Goods
  Forwarded


                             10,000


                                    0

                                            2007
     2008
     2009
     2010
     2011
     2012
      2013

                                                                             Year


(Adapted from CSO, 2014).

3.2 Water-based Tourism and Leisure
Water-based tourism and leisure is the principal contributor in terms of turnover, value added
and employment within the established marine industries of Ireland.                                                       Ireland’s water-based
tourism and leisure industry generated €453 million gross value added to the economy,
employing 5,800 people in 2007 which is the most recent year for available data (SEMRU,
2010). Activities include angling, water sports such as sailing, surfing, kayaking and scuba
diving as well as resort trips like whale and dolphin watching.

3.3 National Cruise Industry
Although there are currently no cruise liners that embark from Irish ports, a total of 190 liners
docked carrying 162,797 passengers in 2012. The number of cruise ships visiting Ireland has
increased by over 200% in the last decade with over half of the cruise ships having capacity for
over 2000 passengers. It has been estimated by a Failte Ireland commissioned Red C report in
2010 that the average passenger who disembarks in Irish ports spends an average of €71,
while the average crew member spends an average of €48 generating an estimated €20.3
million (McCarthy, 2013). Figure 4 illustrates the cruise ship and passenger traffic into Irish
ports.


                                                                                                              MARINE SECTORAL OVERVIEW                    19
THE WHITAKER INSTITUTE


Figure 4:
Cruise Ships and Passenger Visits to Irish Ports

                                  2006     2007         2008     2009     2010     2011     2012
Bantry Bay
Cruise Ships Visits to Irish          5            1        7        5        9        3        7
Ports (Number)
Passenger Visits to Irish Ports    1,862     444         3,938    2,522    2,653     967     1,492
(Number)
Castletownbere
Cruise Ships Visits to Irish          ..           ..       ..       ..       ..       ..       1
Ports (Number)
Passenger Visits to Irish Ports       ..           ..       ..       ..       ..       ..      42
(Number)
Dublin
Cruise Ships Visits to Irish         75       40           83       76       85       85       87
Ports (Number)
Passenger Visits to Irish Ports   60,000   40,996       74,206   71,837   91,742   93,336   86,771
(Number)
Shannon Foynes
Cruise Ships Visits to Irish          3       63            1        3        4        4        4
Ports (Number)
Passenger Visits to Irish Ports    1,535   55,000         315     1,166    1,045    1,403    2,640
(Number)
Galway
Cruise Ships Visits to Irish          2            1        2        2        ..       3        6
Ports (Number)
Passenger Visits to Irish Ports     436      460          270      650        ..     737     2,023
(Number)
Killybegs
Cruise Ships Visits to Irish          3            7        8       14        5        6       12
Ports (Number)
Passenger Visits to Irish Ports    1,516    2,567        2,741    5,438    2,028    1,278    4,360
(Number)
Cork
Cruise Ships Visits to Irish         38            2       51       54       51       53       57
Ports (Number)
Passenger Visits to Irish Ports   32,826     800        59,716   71,557   70,409   70,431   59,898
(Number)
Tralee Fenit
Cruise Ships Visits to Irish          ..           ..       2        ..       ..       ..       ..
Ports (Number)
Passenger Visits to Irish Ports       ..           ..      30        ..       ..       ..       ..
(Number)
Waterford
Cruise Ships Visits to Irish         11       16           10       10       19       12       16
Ports (Number)
Passenger Visits to Irish Ports    7,573    5,458        4,629    6,296    8,885    3,850    5,571
(Number)
(Adapted from CSO, 2014b).


                                                                 MARINE SECTORAL OVERVIEW            20
THE WHITAKER INSTITUTE


3.4 Other Marine Services
Small and medium sized enterprises provide other marine services such as boat sales, ship
surveying and seafood sales to fishmongers. In 2007 there was a €140 million turnover in other
marine services, employing 570 individuals (SEMRU, 2010).


3.5 Sea Fisheries
There are 2,125 registered fishing vessels currently on the Irish Fishing Boat Register
representing 2% of the European fishing fleet (Department of Agriculture, Food and the Marine,
2014). Ireland also has valuable inshore fisheries, particularly shellfish, representing a very
important resource. The volume and value of fish landed by Irish vessels in home ports for
2012 amounts to 280,000 tonnes valued at €270 million (DAFM, 2014). Of the 2,125 currently
registered vessels on the Irish Fishing Boat Register, 319 are owned by people living in
Galway.2 The investment into Irish training for new entrants into sea fisheries include the
FETAC Certificate in Commercial Fishing and the Department of Transport Engineer Officer
Class 3 Certificate of Competency as well as the Department of Transport deck and engineer
officer fishing Certificates of Competency. This investment seeks to grow the sea fisheries
industry of Ireland (DAFM, 2014).


3.6                                              Aquaculture
Ireland has the 7th largest aquaculture sector in the EU, producing 48,350 tons of aquaculture
in 2007 (SEMRU, 2010). Ireland has the opportunity to contribute to the high global demand for
finfish, mussels and oysters but must overcome the regulatory issues of EU Environmental
Directives (Natura Directives) (DAFM, 2014).                                                                                                                                                                                       There is a backlog of aquaculture licence
applications due to Irish breaches of the EU Birds and Habitats Directives. 137 licences were
issued in 2013, representing a 19% increase for the previous year. Projections of a further 200
licences are estimated for 2014 (DAFM, 2014).                                                                                                                                                                                        The investment into aquaculture training
include the FETAC Certificate in Aquaculture as well as a number of specialist courses such as
a foundation in finfish and shellfish farming methods, seaweed on-growing techniques, power
boat handling, farmed fish welfare and safety skills (DAFM, 2014).


2
  For the full list of registered vessels, see
http://www.agriculture.gov.ie/fisheries/seafisheriesadministration/seafisheriesadministration/seaf
ishingfleetregister/

                                                                                                                                                                                                                                            MARINE SECTORAL OVERVIEW            21
THE WHITAKER INSTITUTE


3.7 Seafood Processing
The Irish seafood market is valued at €830 million. Due to a fall in the supply of salmon and
lower international market prices, salmon exports have decreased, but due to an increasing
demand for Irish oysters, crab and mussels, shellfish exports are increasing, valued at €172
million (DFM, 2014). EU exports have declined due to the on-going economic issues, whereas
exports to non-EU countries have grown to €151 million. Figure 5 represents the main export
destinations for Irish seafood, indicating France as being Ireland’s largest importer of seafood
generating €111 million, followed by Great Britain, Spain, Italy and Germany (DFM, 2014).

Figure 5:
Main Export Destinations for Irish Seafood, 2013

                   Asia
                                30

                Russia
                       20

         Cameroon
                             21

             Nigeria
                                                 40

       Netherlands
                     17

          Germany
                         21

                  Italy
                       23

                 Spain
                                                        51

       Great
  Britain
                                                                        69

                France
                                                                                                     111


                              0
     20
                    40
                  60
                  80
     100
       120


                                                          Export
  Value
  in
  €
  millions


(Adapted from (Department of Agriculture, Food and the Marine, 2014).

3.8 Oil and Gas Exploration and Production
The oil and gas industry of Ireland is composed of oil and gas exploration and the extraction
and production of gas. Ireland has sovereign rights to in excess of 900,000km2 of seabed
(SEMRU, 2010). This provides for huge potential for the exploration of oil, gas, minerals and
metals. Some €1.5 billion is expected to be spent on oil and gas exploration around Ireland
over the next 3 years (PWC, 2014). Oil and gas provide over 80% of Ireland’s primary energy
supply (Irish Academy of Engineering, 2013). In 2013 oil and gas imports were approximately
€6 billion illustrating the significance of this sector to Ireland as well as its overdependence on
imported energy (Oireachtas, 2014). An oil and gas exploration licence was awarded to Shell in

                                                                                                    MARINE SECTORAL OVERVIEW             22
THE WHITAKER INSTITUTE
2005 allowing them to pipe natural gas from the ocean off the west coast of Ireland and through
bog lands in County Mayo. The absence of a comprehensive Marine Spatial Planning (MSP)
process for integrated land and marine use planning has given rise to daily conflict in this
region. Oil and gas exploration and production turnover in 2007 was €193 million, employing
approximately 790 people (SEMRU, 2014).
3.9 Marine Manufacturing
Small and medium sized marine manufacturing companies, employing 10-30 staff are found
throughout Ireland. In 2007 this industry accounted for approximately €265 million, with exports
accounting for €12 million. These companies are involved in boat manufacturing and repairs,
sail and net making as well as marine instrumentation, aquaculture technology and water
construction (SEMRU, 2014).
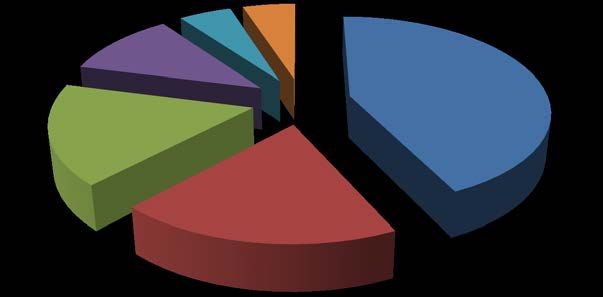
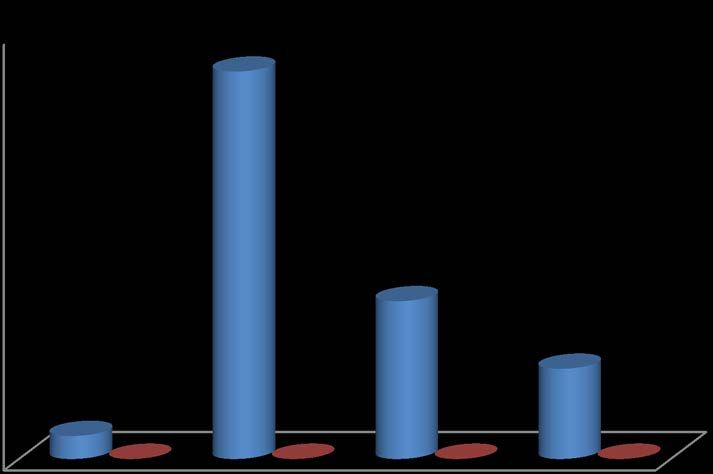
4 Emerging Marine Activities
The emerging marine sector consists of high tech marine products and services, marine
commerce, marine biotechnology and marine renewable energy. Figure 6 illustrates the
turnover percentages from each of the emerging industries.
Figure 6:
Percentage Turnover of Industries within Emerging Marine Sector
Marine
Marine
High
Tech
Marine
Biotechnology
Renewable
Products
&
11%
Energy
Services
4%
26%
Marine
Commerce
59%
(Adapted from SEMRU, 2010)
MARINE SECTORAL OVERVIEW 23
THE WHITAKER INSTITUTE


4.1 High Tech Marine Products and Services
This sector had a turnover of €55.9 million in 2010, employing 391 people (SEMRU, 2014).
Technology companies that supply high tech marine products and services are small to medium
sized and are mainly located within the larger cities of Ireland. They have strong capabilities in
the areas of information and communications.            Products include, wireless and fibre
communications platforms, in situ sensor networks, data management and visualisation and
forecast technologies (SEMRU, 2014).


4.2 Marine Commerce
Marine Commerce produces the highest turnover within the emerging marine activities
(SEMRU, 2010). It refers to legal services, banking services and insurance. In 2010, marine
commerce had a turnover of €66,594, employing 78 people.


4.3 Marine Biotechnology
Marine biotechnology accounted for a turnover of €29 million in 2010, employing 304 people.
The industry is comprised of seaweed harvesting and marine derived bio-products.             Irish
seaweed harvesting contributes to the manufacturing of medical devices, pharmaceuticals and
food products.    It contributes to the supply of other industries such as agriculture and
horticulture, cosmetics and biofuels (SEMRU, 2014).


4.4 Marine Renewable Energy
Marine renewable energy in Ireland is of major growth and has considerable development
opportunities (SEAI, 2014). Ireland is a prime location for marine renewable energy resources.
The centre for Marine Renewable Energy Ireland (MaREI) carries out world-leading research on
marine renewable energy (MaREI, 2014). The centre will receive investment funding of €19
million from the Department of jobs, Enterprise and Innovation through Science Foundation
Ireland (SFI) generating employment and acting as a catalyst for Ireland to produce a
sustainable and profitable energy supply. The offshore wind energy is primarily non-indigenous
and imports knowledge and equipment while the Irish wave and tidal energy industry is
indigenous to Ireland, consisting of a highly innovative group of companies focussed on the pre-
commercial development side (SEMRU, 2014).

One offshore wind farm generated a turnover of €6.2 million in 2007.             Wave and tidal
companies invested €50 million in 2007 for the development of renewable energy.

                                                              MARINE SECTORAL OVERVIEW               24
THE WHITAKER INSTITUTE


Due to the EU target of reducing CO2 emissions by 20% by 2020 the government targets of
generating 40% of electricity from renewable sources, investment into marine renewable
sources of energy is essential in Ireland (SEMRU, 2010).


4.5 Integrated Marine Plan for Ireland
In July 2012 the Government published the roadmap strategy document “Harnessing Our
Ocean Wealth - An Integrated Marine Plan for Ireland” with the goals of developing a thriving
maritime economy, healthy ecosystems and increased engagement with the sea.                                                                                                                                                        This
document resulted from the need for Ireland to develop an integrated system of policy and
programme planning for marine affairs. Some 39 actions were identified, with 15 of these to
form the basis of a strategic roadmap for the period 2012-2014. In 2014 the Government
published “Harnessing Our Ocean Wealth - First Review of Progress” which focuses on the
main activities carried out since the original publication and gives an overview of the plans for
2014, based around the areas of governance, maritime safety, security and surveillance, clean
green marine, business development, marketing and promotion, education, infrastructure, and
                                                                              3
international cooperation.


3
  These
  documents
  are
  available
  at
  http://www.ouroceanwealth.ie/


                                                                                                                                                                                             MARINE SECTORAL OVERVIEW                     25
THE WHITAKER INSTITUTE


Regional and Local Overview of the Marine
Sector

Regional and Local Overview

Introduction
The marine sector is an important sector for Galway city and county.          The river Shannon
provides tourism based leisure in Portumna, with the Galway port and its future plans providing
commercial and tourism opportunities for City and County. Galway is the location of the Marine
Institute that has developed an international reputation in marine research and is at the forefront
of marine research collaborating with a range of local, national and international stakeholders.
The Maritime Institute, headquartered in Galway provides R&D services, to help improve
economic development and protect the marine environment (Maritime Institute, 2014).           The
Ryan Institute at NUI Galway is one to the leading marine research institutes, focusing on
national and international, long-term, environmental, marine and energy research issues.

There are 114 agriculture, forestry and fishing industries in Galway City and County, with only 5
of these organisations based in Galway City (Geodirectory, 2014). There are 5,908 people
working in agriculture, forestry and fishing industries in Galway County and 168 people working
in Galway City (CSO Census 2011).

Table 1:
Breakdown of Agriculture, Forestry and Fishing Industries by Municipal District

                            Agriculture, Forestry and Fishing
Municipal Districts
                            Industries
Ballinasloe                                     19
Connemara                                             34
Loughrea                                              26
Oranmore                                              24
Tuam                                                   6
Galway City                                            5
(Adapted from CSO, 2011)

                                                               MARINE SECTORAL OVERVIEW               26
THE WHITAKER INSTITUTE


5 Established Marine Activities
5.1 Aquaculture
Data from the Geodirectory lists 17 aquaculture and fishing companies in Galway.                                                                                                                                                                        For
example, Connemara Abalone is an aquaculture company in Galway, which specialises in
growing the highly-prized shell-fish which is a delicacy in the Japanese market (Connemara
Abalone, 2014).

Bord Iascaigh Mhara (Irish Sea Fisheries Board, BIM) carried out an aquaculture survey in 2012
and found that Galway produced 2742 tonnes of salmon of a total nationwide production of
12,000 tonnes, 1012 tonnes of rope mussels, and 15 tonnes of freshwater trout. Galway also
produced 187 tonnes of gigas oysters, with the total production for Ireland of 7,313 tonnes, and
                                                                                                                                                                                                                                                         4
83 tonnes of edulis oysters, with the total edulis production amounting to 247 tonnes (33.6%).

BIM submitted for a license in 2012 to facilitate the development of a deep sea salmon farm in
Galway Bay, at two sites north of Inis Oirr. This proposed deep sea fish farm in Galway Bay
could produce up to 15,000 tonnes of organic salmon every year, worth €102 million annually,
and with a wage flow of about €14.5 million, directly into the local economy. This level of
production will help employ local people in long-term jobs. (BIM website)

Galway recently finished third in the 2013 IFA Aquaculture coastal league table confirming the
cleanliness of its coastal waters (see Table 2) (IFA, 2013).


4
  For more information see
http://www.bim.ie/media/bim/content/downloads/BIM%20Aquaculture%20Survey%202012.pdf

                                                                                                                                                                                                                                   MARINE SECTORAL OVERVIEW   27
THE WHITAKER INSTITUTE


Table 2:
IFA Aquaculture Coastal League Table 2013

       County      Total      Class         Class A   Class   Class    Points   Points diff       Weighted
       Council   Classified     A          Seasonal     B       C                2012/13           Points
                   Areas      2013           2013     2013    2013
Clare               11          7             1         3      0        29            3            0.88
Mayo                21         11             3         7      0        53            0            0.84
Galway              22          8             4        10      0        52            1            0.79
Cork                23          9             0        14      1        52            2            0.75
Louth                8          6             0         1      1        17            -4           0.71
Kerry                9          1             1         7      0        19            2            0.70
Donegal             18          3             2        13      1        36            -6           0.67
Sligo                7          0             0         7      0        14            0            0.67
Waterford            5          0             0         5      0        10            2            0.67
Limerick             2          0             0         2      0         4            0            0.67
Wexford              7          2             0         4      1        11            -2           0.52


5.2 Regional Cruise Industry
Galway has proposed a four stage development plan to expand its harbour, improving facilities
and capabilities necessary in handling large cruise vessels (McCarthy, 2013). In 2014, 8 cruise
ships docked in Galway Harbour, with the same number expected to dock in Galway Port in
2015. The luxury French cruise liner 'Le Boréal' visited Galway during 2014 on its maiden
voyage, carrying 264 passengers. The largest residential liner in the world ‘The World’ docked
in Galway in July. The number of ships and passengers docking in Galway is rising and the
development of Galway’s multi-million euro port at Galway harbour is critical to accommodate
this increase in tourism (Galway Harbour, 2014).

Figure 7:
Cruise Ships and Passenger Visits to Irish Ports

                                            2006 2007 2008 2009 2010 2011                          2012
Galway
Cruise Ships Visits to Irish                      2     1       2        2       ..           3        6
Ports (Number)
Passenger Visits to Irish                     436     460     270     650        ..        737 2,023
Ports (Number)
(CSO, 2012)


                                                                    MARINE SECTORAL OVERVIEW                 28
THE WHITAKER INSTITUTE


5.3 Water-based Tourism and Leisure
Galway’s water-based activities are a developing tourism and leisure location. Active water-
based activities of Galway include sea angling, pleasure boating, windsurfing, scuba-diving,
canoeing and water-skiing. The passive water-based activities include mammal watching, visits
to islands, beaches, cruise ships and marine archaeology. This industry is underdeveloped in
Galway with the exception of angling which is Galway’s most important water-based tourism
product.   This industry experiences low levels of marketing and investment (Water Based
Tourism, 2002).


Table 3:
The Range of Marine WBA in Counties Clare & Galway 2010

Activity                           Clare                           Galway
Adventure Centre                                1                                 2
Aquarium/Attraction                             2                                 1
Blue Flag Beaches                               8                                 9
Sea Cruises                                     0                                 1
Diving                                          4                                 3
Marinas                                         1                                 0
Sailing                                         3                                 4
Sea-Kayaking                                    0                                 1
Sea-Angling                                     4                                12
Surfing                                         6                                 0
Whale & Dolphin
                                                6                                 1
Watching
Wind Surfing                                    0                                 1
Total Number of
                                               35                                35
Companies
(Source: Morrissey and Moran, 2011)

There are currently seven blue-flag beaches in Galway, with two in the City. These beaches
are listed below, followed by the most recent figures on quality status of all bathing areas in the
county.


                                                               MARINE SECTORAL OVERVIEW               29
You can also read