Market Outlook Report- 10th MAR 2021 - Webflow
←
→
Page content transcription
If your browser does not render page correctly, please read the page content below
Market Outlook Report- 10th MAR 2021

                                Compiled by:
            CapitalVia Global Research Limited- Investment Advisor
903, B-1, 9th Floor, NRK Business Park, Scheme No. 54, P.U.-4,Vijay Nagar Square,
                               Indore-452010 (M.P.)

                     Head of Research - Gaurav Garg

             For feedback or queries, mail us at pr@capitalvia.com
                            Ph no.: (+91) 88273 92806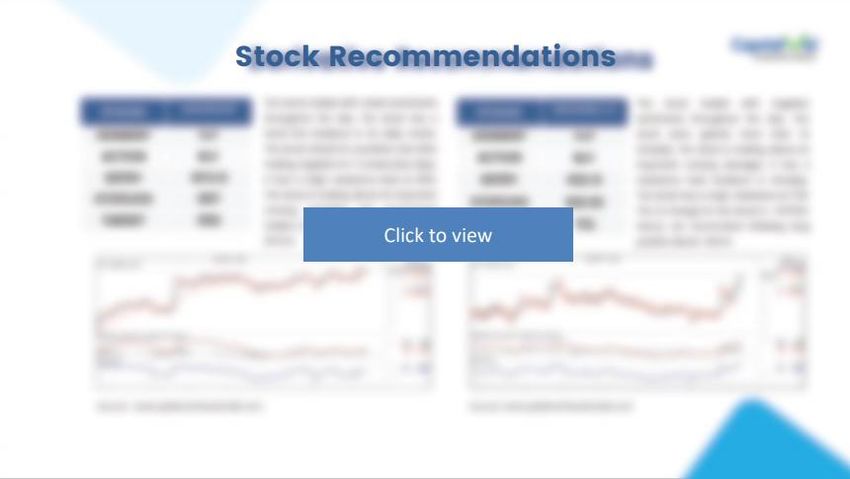
Indian Markets

            Index             Last             High               Low             Change           Change%

             Nifty          14956.20         15126.85          14925.45             142.20            0.95%

            Sensex          50441.07          51111.94         50396.10             584.41             1.16%

           Banknifty       35275.75          36077.80          35544.95             589.90             1.67%

           Nifty FUT       14969.00           15179.85         14953.25             176.00             1.18%

               Nifty opened with a gap-up after which tumbled below 14,950 but regained momentum in the
               late hours to close with an overall gain of around 0.95 percent as on 9th March 2021. Index
Overview

               witnessed a highly volatile session and rebounded from lower level. 14,900 would be the
               immediate support level for the index in the coming session with the resistance of 15,200 level.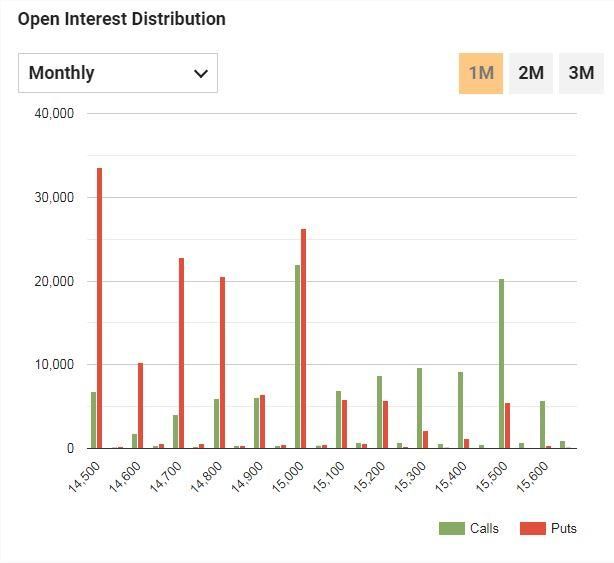
Global Markets

 Index          Last            High              Low             Change       Change%         ➢   U.S. Treasury yields have been advancing as investors price in higher
                                                                                                   inflation and more upbeat prospects for the U.S. economy as it emerges
Dow 30            31,802.44     32,148.04          31,512.15        +306.14           +0.97%
                                                                                                   from the coronavirus pandemic.On foreign exchange markets, the dollar
Nasdaq              12,609.16   13,001.00        12,599.23           -310.99          -2.41%       index held near a 3-1/2-month high against its rivals as expectations of a
                                                                                                   faster economic normalisation from the pandemic in the United States
 DAX              14,384.75     14,386.75        14,309.70            +3.84           +0.03%
                                                                                                   put the currency at an advantage.
FTSE 100            6,732.80    6,735.95          6,689.51            +13.67          +0.20%

                                                                                               ➢   European stock markets are seen opening a little lower Tuesday, as
                                                                                                   investors digest another leg down for tech stocks and disappointing
            Index               S1              Pivot Points           R1                          Japanese growth, even after further progress in the U.S. stimulus
                                                                                                   package.
           Dow 30                    31715.61        31859.58              31931.56

                                                                                               ➢   Asian stocks recovered from earlier losses on Tuesday, lifted by firmer
           Nasdaq                12878.77            12909.84           12948.36
                                                                                                   U.S. equity futures and central bank comments aimed at soothing fears
                                                                                                   about rising bond yields and inflation.
            DAX                  12878.77            12909.84           12948.36

           FTSE 100                  6578.17            6586.81            6650.17
Currency Outlook
➢ In early trade on Tuesday, the Indian rupee rose to 72.89 against the
US dollar, owing to rising domestic equities and continued foreign
fund inflows. Foreign portfolio investors (FPIs) were net buyers in the
capital market as they purchased shares worth Rs 1,876.60 crore on
Monday, as per exchange data. The dollar index fell 0.21% to 90.73.
➢ Given the quote's recent pullbacks from the 100-day EMA, combined
with a downward sloping RSI, USD/INR sellers may try to reclaim the
previous resistance line from November 04, which is currently at
72.80.
➢ Any more weakness above 72.80, however, could lead to a retest of
February's low, which was also the lowest since March 2020, at 72.17.
Meanwhile, an upside break of the 100-day EMA level of 73.34 would
need confirmation from the 74.00 threshold before the USD/INR bulls
can target the 74.10 and 74.20 tops set in late 2020 and February 2021,
Chart : Zerodha.com
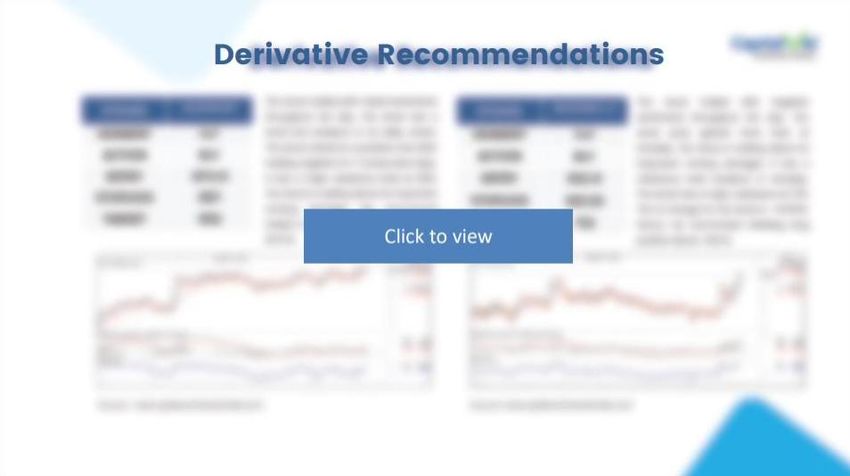
respectively.Derivative Outlook
⮚ Market indices plunged down below 14,950 level after a gap-up opening but rebounded from lower level in the
late hours as on Tuesday, 9th March. Nifty witnessed sluggish movement and settled with an overall gain of
around 0.95 percent. On the sectoral front except Banks, FMCG and IT, all other sectoral indices ended lower.
⮚ In the coming trading session on Wednesday, 10th March market may remain volatile amid weekly contract
expiry. 14,900 would be the immediate support level for Nifty whereas resistance zone could be in the range of
15,200 to 15,250. Nifty may remain range-bound until and unless a breakout above the 15,100 level is sustained by
the index.
⮚ Highest Daily Nifty Call OI-15,000
⮚ Highest Daily Nifty Put OI-14,500
Long built-up:
Scrip Name Closing price Change in price Change in OI
RBLBANK 246.25 0.43% 6.80%
HCLTECH 982.05 1.72% 5.76%
RECLTD 144.95 1.08% 5.83%Short built-up:
Scrip Name Closing price Change in price Change in OI
BPCL 445.00 -5.05% 101.90%
IDEA 10.15 -3.79% 1.38%
VEDL 225.55 -0.24% 4.18%
Short covering:
Scrip Name Closing price Change in price Change in OI
BHEL 55.50 2.12% -1.45%
HDFCBANK 1564.75 2.61% -2.74%
ADANIPORTS 752.80 0.26% -1.17%
Long Unwinding:
Scrip Name Closing price Change in price Change in OI
PNB 40.10 -1.23% -0.67%
BANKBARODA 81.45 -1.75% -0.74%
ITC 208.75 -0.19% -0.59%Nifty Option Chain
Analysis :
⮚ Nifty ends the day with a gain of around 0.95 percent as on
Tuesday, 9th March. The options data indicates immediate trading
range of the Nifty is likely to be 14,800 – 15,500. Maximum Put open
interest was at 14,500 followed by 15,000 strike, while maximum Call
open interest was at 15,000 followed by 15,500 strike. Call writing
was seen at 15,000 and 15,100 strikes while Put writing was seen at
14,900 and 14,800 strikes. IndiaVIX declined 8.83 percent and close
at 22.50.
Source: www.bloombergquint.comNifty Option Chain
Analysis :
➢ As per monthly option data , Nifty should trade in the range of
9000-10000 . Maximum Put writing can be seen at 9000 and
Maximum call writing can be seen at 10000
➢ Nifty closed with gains on Wednesday,6th May. We expect Nifty to
be range bound , Volatility is most likely to increase in the coming
trading session. Indecisiveness can be seen in the market as
trading range of Nifty is getting smaller. As per weekly option data,
nearest support can be seen at 9200 and on the higher side,
resistance can be seen at 9400.
Source: www.bloombergquint.comGlobal Markets
Index Last High Low Change Change%
Dow 30 23783.44 24054.59 23782.28 -99.65 -0.42% ➢ U.S. stocks opened higher on hopes of a pickup in business activity
with states easing Coronavirus-induced curbs, while investors
Nasdaq 8825.55 8913.85 8819.37 17.76 0.20%
looked past a stunning 20 million plunge in U.S. private payrolls last
DAX 10615.73 10771.68 10604.90 -111.74 -1.08% month.
FTSE 100 5850.80 5898.33 5838.70 0.88 0.02%
➢ European stock markets traded slightly lower on Wednesday amid
weak economic data, while better than expected earnings helped
the U.K. to outperform.
Index S1 Pivot Points R1
➢ German factory orders slumped 15.6% in March to their lowest level
Dow 30 23760.10 23906.82 23996.82
since records began in 1991, while IHS Markit's final Composite
Nasdaq 8840.29 8876.96 8901.71 Purchasing Managers' Index for the euro zone, seen as a good
indicator of economic health, plummeted to 13.6 in April from
DAX 10624.80 10676.20 10704.30
March's already dire 29.7, easily its lowest reading since the survey
FTSE 100 5850.41 5874.37 5889.24 began in 1998.Disclosure
➢ CapitalVia Global Research Limited (hereinafter referred as “CapitalVia”) shall not be liable for any misrepresentation, falsification, and deception or for any lack of availability of
services through the website, even if the same are advertised for, on the website.
➢ Customers to take a note: We touch base with our customers and prospects using the phone no.series
+91 7313 816 000 to +91 7313 816 299, +91 7316 736 100 to +91 7316 736 499 & +91 731 677 4001 (Kindly note that CapitalVia serves all it customers only from the above mentioned
numbers. Thus any call from number other than mentioned above, claiming to be from CapitalVia, shall be completely ignored.) Please beware of spoof calls and report such case on
our hotline number +91 8085 999 333
➢ CapitalVia confirms that no employee of ours can engage in (directly or indirectly) any trade or business in capital market.We do not allow any of our employees to participate in
trading business.W also restrict our people from getting into any related business or otherwise for ensuring unbiased services to the clients of CapitalVia.
➢ In compliance to SEBI (Investment Advisers) Regulation 2013, all our Research Analysts are certified by the National Institute of Securities Market (NISM) with an experience of more
than 5000 Hours and its still adding.
➢ The track record of the services offered by CapitalVia is published on a day+1 basis to its websites, i.e. www.capitalvia.com/dashboard.
➢ CapitalVia categorically states that different types of investments involve varying degrees of risk, and there can be no assurance that the future performance of any specific
investment or investment strategy (including those undertaken or recommended by the CapitalVia), will be profitable or equal any historical performance level(s).
➢ Your KYC and RPM formalities need to be complete before you can use any service from CapitalVia. Even if the subscription fee is paid, no service would be rendered to any customer
before completion of KYC and RPM formalities. For completing the KYC formalities, we proceed with the information mentioned on the PAN Card Number only.
➢ The service offered to any customer depends on his/her Risk Profile Management. CapitalVia offers only those service to the customers which are either of the same risk category or
less. In all the other cases, CapitalVia offers no services and the subscription fee is returned.
➢ The website contains features of the services that are currently being offered by CapitalVia and those intended to be offered in the future. CapitalVia intends to launch the services,
confirming with the features listed on the website in total, however, due to business need and regulatory requirement the final launch may contain variables. Notwithstanding
anything contained in the website regarding the services, CapitalVia may decide to postpone the offering of the services or may even decide to withdraw the offering or even a
currently offered service altogether.
➢ Any alliances, partnership co-branding that we have doesn't guaranty or assure free gifts, profit etc. This partnerships are meant for providing additional benefits to our subscribers
during festive season or special occasions while they are subscribing our services. These offers by no means designed or presented to lure our prospects towards subscribing our
services.
➢ CapitalVia is not engaged in any kind of execution services - directly or indirectly. Its alliances with TradeSmart which is engaged in execution services, are restricted to mutually
beneficial marketing activities wherein both CapitalVia and the TradeSmart shall display each other’s products at discounted price, to their own customers, permission based leads
and opportunities. As a business, we DO NOT offer or are involved in any direct or indirect execution services. Our services are limited to providing research based trading
recommendations.
➢ CapitalVia reserve the right to modify/ alter/ change the content of its website. Clients are advised to update themselves from time to time.
➢ Clarification on the news published on 28th June 17 on the13th Page of Indore Times of India. Click Here
➢ Investments in securities are subject to market risks, which includes price fluctuation risk. There is no assurance or guarantee that the objectives of any of the products mentioned in
this document or on this site will be achieved.
➢ As a business, we offer stock recommendations based on technical research ONLY to our subscribers. We have not authorised any organisation or firm to represent us and offer stock
recommendations on our behalf.
➢ As a business, we DO NOT offer or involved in any direct or indirect execution services. Our services are limited to providing research based trading signals.
➢ Methodology of maintaining track record of recommendations Click Here
➢ Police advisory for investors who taking services of financial advisors. Click HereYou can also read