Market Outlook Report- 20th Oct 2020 Compiled by: Webflow
←
→
Page content transcription
If your browser does not render page correctly, please read the page content below
Market Outlook Report- 20th Oct 2020

                                Compiled by:
            CapitalVia Global Research Limited- Investment Advisor
903, B-1, 9th Floor, NRK Business Park, Scheme No. 54, P.U.-4,Vijay Nagar Square,
                               Indore-452010 (M.P.)

                     Head of Research - Gaurav Garg

              For feedback or queries, mail us at pr@capitalvia.com
                             Ph no.: (+91) 88273 92806
Indian Markets

            Index           Last         High            Low            Change        Change%

             Nifty        11873.05      11898.25       11820.40           110.60         0.94%

            Sensex        40431.60      40125.71       39669.42          254.57          0.64%

           Banknifty      40318.57     40519.48        40211.22          448.62           1.12%

           Nifty FUT      11892.50      11898.90       11818.50           127.35         1.08%

               Nifty opened with a gap up on 19th October and remained range bound within
               the range of 11800-11900. The level of 11900 is playing a crucial role and is
Overview

               holding ground above 11800, nifty is expected to reach 12000 once it breaches
               and sustains the level of 11900.Investors may buy on dips and sell at the levels
               of 11950-12000.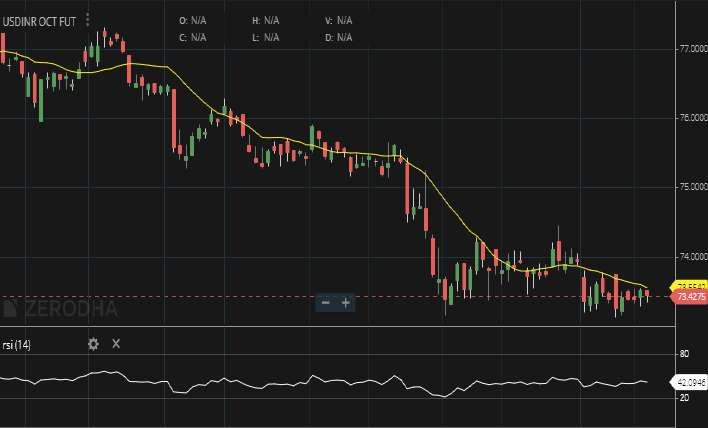
Global Markets
Index Last High Low Change Change%
Dow 30 28,606.31 28,842.90 28,570.72 +0.39% +112.11 Global shares rose on Friday while safe-havens such as the
dollar softened as investors welcomed news that drugmaker
Nasdaq 11,671.56 11,827.42 11,648.53 -0.36% -42.31
Pfizer Inc (NYSE: PFE ) PFE.N could have a coronavirus vaccine
12,945.35 ready in the United States by the end of this year..
DAX 13,028.45 12,925.80 +0.29% +39.91
European stocks rallied on Monday as rising hopes of a
FTSE 100 5,925.12 5,959.55 5,918.55 +0.10% +6.26
coronavirus vaccine by the end of the year and a U.S. fiscal
package before elections offset concern over record daily
Index S1 Pivot Points R1
infections in the region..
Dow 30 28550.91 28665.41 28727.36
Asian markets advanced toward a recent 2-1/2-year peak on
Nasdaq 11605.79 11691.28 11734.03 Monday powered by hopes of a U.S. fiscal package and
expectations of a coronavirus vaccine by the end of this year,
DAX 12922.34 12946.87 12967.94 though gains were held back by weaker-than-expected Chinese
economic data.
FTSE 100 5918.11 5929.43 5937.81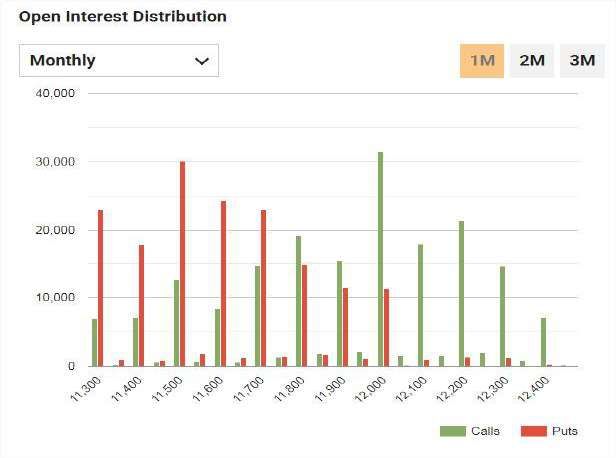
Currency Outlook
USDINR October Future had a flat opening at 73.41 on Monday and
traded in moderately positive momentum in morning session
session where it made a High at 73.48 and then had a sharp sell-
off post European session and closed on a negative note at 73.37.
Overall, USDINR spot has traded in moderately bearish trend.
USD/INR Future has closed below Resistance-line of 15-SMA on
hourly chart placed at 73.41 which will be immediate resistance
level for USDINR in next session, whereas 73.33 would be strong
support for pair. The USDINR future closed below 21-SMA placed at
73.51 on daily chart. The momentum indicator is ranging around 40
on daily chart which indicates positive momentum in pair if it
breaks above resistance levels.
As per current market action, USDINR future is likely have flat
opening around 73.35 on Tuesday and if it breaks above resistance
level then we may expect more bullish momentum towards 73.60.
The trading range for pair is likely to be in between 73.30 – 73.45 in
Chart : Zerodha.com upcoming session.
Derivative Outlook
⮚ After giving a gap-up opening, Nifty remains range-bound throughout the session on Monday, 19th

   October. Nifty traded in the range of 11,800 to 11,900 and ends with the gain of around 0.94 percent.
   Among sectors, banking being the top gainer which ends with a gain of more than 3 percent, with
   pharma and IT ending in red with a loss of 1.67 and 0.68 percent, respectively.
⮚ In the coming trading session on Tuesday, 20th October, market is expected to remain volatile. A

   doji candle formation is observed in the daily chart of Nifty, which signifies situation of indecision
   among buyers and sellers in the market. Nifty is expected to maintain a resistance of 12,000 with
   support remaining at 11,650.
⮚ Highest Daily Nifty Call OI-12,000

⮚ Highest Daily Nifty Put OI-11,500

                                          Long built-up:

                    Scrip Name         Closing price   Change in price     Change in OI

                       SBIN              204.75             4.17%             13.40%

                   FEDERALBNK             56.40             7.63%             15.60%

                    AXISBANK             493.70             4.18%             9.30%
Short built-up:
Scrip Name Closing price Change in price Change in OI
AMBUJACEM 247.75 -0.36% 33.36%
BHARTIARTL 397.75 -1.33% 2.09%
GMRINFRA 23.70 -0.63% 3.54%
Short covering:
Scrip Name Closing price Change in price Change in OI
IOC 77.50 3.96% -2.82%
PNB 28.15 1.62% -1.88%
SAIL 34.75 2.66% -2.42%
Long Unwinding:
Scrip Name Closing price Change in price Change in OI
IDEA 7.95 -1.85% -1.25%
AUROPHARMA 799.70 -1.14% -0.22%
PVR 1159.00 -1.11% -1.26%Nifty Option Chain
Analysis :
⮚ Nifty ends the day with a gain of 0.94 percent on Monday,
19th October. The options data indicates immediate trading
range of the Nifty is likely to be 11,650 - 12,000. Maximum Put
open interest was at 11,500 followed by 11,600 strike, while
maximum Call open interest was at 12,000 followed by
12,200 strike. Call writing was seen at 11,900 and 11,850 strikes
while Put writing was seen at 11,800 then 11,700 strike.
IndiaVIX gained 0.80 percent and close at 21.82.
Source: www.bloombergquint.comNifty Option Chain
Analysis :
As per monthly option data , Nifty should trade in the range of
9000-10000 . Maximum Put writing can be seen at 9000 and
Maximum call writing can be seen at 10000
Nifty closed with gains on Wednesday,6th May. We expect Nifty to
be range bound , Volatility is most likely to increase in the coming
trading session. Indecisiveness can be seen in the market as
trading range of Nifty is getting smaller. As per weekly option data,
nearest support can be seen at 9200 and on the higher side,
resistance can be seen at 9400.
Source: www.bloombergquint.comGlobal Markets
Index Last High Low Change Change%
Dow 30 23783.44 24054.59 23782.28 -99.65 -0.42% U.S. stocks opened higher on hopes of a pickup in business activity
with states easing Coronavirus-induced curbs, while investors
Nasdaq 8825.55 8913.85 8819.37 17.76 0.20%
looked past a stunning 20 million plunge in U.S. private payrolls last
DAX 10615.73 10771.68 10604.90 -111.74 -1.08% month.
FTSE 100 5850.80 5898.33 5838.70 0.88 0.02%
European stock markets traded slightly lower on Wednesday amid
weak economic data, while better than expected earnings helped
the U.K. to outperform.
Index S1 Pivot Points R1
German factory orders slumped 15.6% in March to their lowest level
Dow 30 23760.10 23906.82 23996.82
since records began in 1991, while IHS Markit's final Composite
Nasdaq 8840.29 8876.96 8901.71 Purchasing Managers' Index for the euro zone, seen as a good
indicator of economic health, plummeted to 13.6 in April from
DAX 10624.80 10676.20 10704.30
March's already dire 29.7, easily its lowest reading since the survey
FTSE 100 5850.41 5874.37 5889.24 began in 1998.Disclosure
⮚ CapitalVia Global Research Limited (hereinafter referred as “CapitalVia”) shall not be liable for any misrepresentation, falsification, and deception or for any lack of availability of
services through the website, even if the same are advertised for, on the website.
⮚ Customers to take a note: We touch base with our customers and prospects using the phone no.series
+91 7313 816 000 to +91 7313 816 299, +91 7316 736 100 to +91 7316 736 499 & +91 731 677 4001 (Kindly note that CapitalVia serves all it customers only from the above mentioned
numbers. Thus any call from number other than mentioned above, claiming to be from CapitalVia, shall be completely ignored.) Please beware of spoof calls and report such case on
our hotline number +91 8085 999 333
⮚ CapitalVia confirms that no employee of ours can engage in (directly or indirectly) any trade or business in capital market.We do not allow any of our employees to participate in
trading business.W also restrict our people from getting into any related business or otherwise for ensuring unbiased services to the clients of CapitalVia.
⮚ In compliance to SEBI (Investment Advisers) Regulation 2013, all our Research Analysts are certified by the National Institute of Securities Market (NISM) with an experience of more
than 5000 Hours and its still adding.
⮚ The track record of the services offered by CapitalVia is published on a day+1 basis to its websites, i.e. www.capitalvia.com/dashboard.
⮚ CapitalVia categorically states that different types of investments involve varying degrees of risk, and there can be no assurance that the future performance of any specific
investment or investment strategy (including those undertaken or recommended by the CapitalVia), will be profitable or equal any historical performance level(s).
⮚ Your KYC and RPM formalities need to be complete before you can use any service from CapitalVia. Even if the subscription fee is paid, no service would be rendered to any customer
before completion of KYC and RPM formalities. For completing the KYC formalities, we proceed with the information mentioned on the PAN Card Number only.
⮚ The service offered to any customer depends on his/her Risk Profile Management. CapitalVia offers only those service to the customers which are either of the same risk category or
less. In all the other cases, CapitalVia offers no services and the subscription fee is returned.
⮚ The website contains features of the services that are currently being offered by CapitalVia and those intended to be offered in the future. CapitalVia intends to launch the services,
confirming with the features listed on the website in total, however, due to business need and regulatory requirement the final launch may contain variables. Notwithstanding
anything contained in the website regarding the services, CapitalVia may decide to postpone the offering of the services or may even decide to withdraw the offering or even a
currently offered service altogether.
⮚ Any alliances, partnership co-branding that we have doesn't guaranty or assure free gifts, profit etc. This partnerships are meant for providing additional benefits to our subscribers
during festive season or special occasions while they are subscribing our services. These offers by no means designed or presented to lure our prospects towards subscribing our
services.
⮚ CapitalVia is not engaged in any kind of execution services - directly or indirectly. Its alliances with TradeSmart which is engaged in execution services, are restricted to mutually
beneficial marketing activities wherein both CapitalVia and the TradeSmart shall display each other’s products at discounted price, to their own customers, permission based leads
and opportunities. As a business, we DO NOT offer or are involved in any direct or indirect execution services. Our services are limited to providing research based trading
recommendations.
⮚ CapitalVia reserve the right to modify/ alter/ change the content of its website. Clients are advised to update themselves from time to time.
⮚ Clarification on the news published on 28th June 17 on the13th Page of Indore Times of India. Click Here
⮚ Investments in securities are subject to market risks, which includes price fluctuation risk. There is no assurance or guarantee that the objectives of any of the products mentioned in
this document or on this site will be achieved.
⮚ As a business, we offer stock recommendations based on technical research ONLY to our subscribers. We have not authorised any organisation or firm to represent us and offer stock
recommendations on our behalf.
⮚ As a business, we DO NOT offer or involved in any direct or indirect execution services. Our services are limited to providing research based trading signals.
⮚ Methodology of maintaining track record of recommendations Click Here
⮚ Police advisory for investors who taking services of financial advisors. Click HereYou can also read