MASS BALANCE OF "VESPER" GLACIER, WASHINGTON, D.S.A.
←
→
Page content transcription
If your browser does not render page correctly, please read the page content below
Journal of Glaciology, VD!. 27, No. g6, IgB I

    MASS BALANCE OF "VESPER" GLACIER, WASHINGTON,
                        D.S.A.

                                    By   DAVID   P.   DETHIER*   and JAN E. FREDERICK*
(Department of Geological Sciences, University of Washington, Seattle, Washington 98195,
                                                           V.S.A.)

           ABSTRACT. During 1974-75 glaciologic and geologic studies were conducted on a small (0.'7 km')
      avalanche-nourished glacier in the North Cascade Range of Washington. The approximate equilibrium-line
      alti tude (ELA) for this ice body, informally called "Vesper" glacier, lies at I 475 m, some 300 m below the
      regional ELA value. Estimated annual accumulation was 6 100 ± 675 mm during the two years of study;
      15 to 30% of this flux resulted from avalanche and wind-transported snow. Average annual ablation during
      the period was 5 350 mm, giving a total net balance of + I 600 mm for the two-year study period. "Vesper"
      glacier persists well below the regional snow-line because of excessive local precipitation, substantial avalanche
      contributions, and a favourable north-facing aspect.
           Neoglacial moraines indicate that maximum ELA lowering in this period was approximately 165 m and
      occurred prior to A.D. 1670. Minor re-advances occurred during the nineteenth century. These recon-
      naissance measurements are cons isten t with the sparse geologic d ata reported from other glaciers in the
      Cascade R ange. While the relationship between regional lowering of snow-line and avalanche activity is
      uncertain at present, these data suggest that avalanche-nourished glaciers provide a useful record of climatic
      fluctuations.
           RESUME. Bilan de masse du "Vesper" glacier, Washington, U.S.A . En 1974-75, des etudes glaciologiques et
      geologiques ont ete conduites sur un petit glacier (0, 17 km') nourri par les avalanches dans la North Cascade
      Range, Washington. L'altitude approximative de la ligne d'equilibre (ELA) pour cet appareil glaciaire,
      officieusement baptise "Vesper" glacier, se situe a I 475 m, quelques 300 m en-dessous de la valeur de
      I'ELA dans cette region. L'accumulation annuelle estimee etait de 6 100 ± 675 mm pendant les deux
      ans de l'etude; 15 a 10% de cet apport resulte de I'avalanche et de la neige transportee par le vent. L'ablation
      annuelle moyenne durant cette periode a ete de 5 350 mm, donnant un bilan net total de plus de I 600 mm
      pour la periode de deux ans etudiee. Le "Vesp er" glacier subsiste b ien en dessous de la li gne de neve de la
      region a cause d'un exd~s local de precipitations, de contributions substantielles des avalanches et d'une
      exposition Nord favorable.
           Les moraines neoglaciaires indiquent que le maximum d'abaissement de l'ELA dans cette periode etai t
      approximativement de 165 m et survint avant A.D. 1670. De faibles avancees survinrent au cours du 1ge
      siecle. Ces mesures d'identification sont coherentes avec les donnees geologiques dispersees rapportees de
      l'observation d'autres glaciers de la Cascade R ange. Bien que la relation entre l'abaissement local de la
      ligne des neiges et l'activite des avalanches soit pour le moment incertaine, ces donnees fo nt pens er que les
      glaciers nourris par les avalanches peuvent etre un utile enregistreur des fluctuations climatiques.
           ZUSAMMENFASSUNG. Massenbilanz des "Vesper" Gletseher, Washington, U.S.A . An einem kleinen (0,'7 km'),
      lawinengespeisten Gletscher in der North Cascade Range von Washington wurden in den J ahren 1974
      und 75 glaziologische und geologische Untersuchungen durchgefuhrt. Die ungefahre Hbhe der Gleich-
      gewichtslinie auf diesem Eiskbrper, der informell "Vesper" Gletscher heisst, liegt bei I 475 m, etwa 300 m
      unter der regionalen Gleichgewichtslinie. Die jahrliche Akkumulation wahrend der beiden Studienjahre
      lasst sich auf 6 IOo ± 675 mm abschatzen; 15 bis 30 % dieses Zuwachses stammen von Lawinen und
      Schneedrift. Die mittlere Jahresablation wahrend der Untersuchungsperiode betrugt 5350 mm, was auf
      eine Netto-Gesamtbilanz von + I 600 mm fur die Zweijahresperiode fuhrt. D er "Vesper" Gletscher erhalt
      sich sehr gut unterhalb der regionalen Schneegrenze infolge des ubermassigen lokalen Niederschlages, des
      wesentlichen Zutrages durch Lawinen und seiner gunstigen Exposition nach Norden.
           Jungglaziale Moranen weisen darauf hin, dass die Gleichgewichtslini e maximal urn 165 m abgesunken
      ist, und zwar vor A.D. 1670. Kleinere Vorstbsse erfolgten im 19. Jahrhundert. Die Erkundungsmessungen
      st immen gut m it den sparlichen geologischen Daten von anderen G letschern in der Cascade Range uberein.
      Obwohl die Beziehung zwischen dem regionalen Absinken der Schneegrenze und der Lawinenhaufigkeit
      derzeit noch unbekannt ist, lass en diese Daten vermuten, dass lawinengespeiste Gletscher nutzliche
      Indikatoren von Klimaschwankungen sind.

I NTRODUCTION

    Small alpine glaciers in temperate regions respond rapidly to climate change. Geologic
features such as moraines, trimlines, and ou twash trains result from the response of glaciers to
climatic fluctuations, but there is no simple r elationship between climate and the formation
of these p ersistent geologic features (Meier, 1965 ). Mass-balance measurements on a glacier
   * Present address: U.S. Geological Survey, Suite 125, 1107 N.E. 45th Street, Seattle, Washington 98105,
U.S.A.
JOURNAL        OF GLACIOLOGY

provide useful indications .o f climate change long before response at the glacier terminus, and
are essential to research on the dynamics of glaciers. These dynamics must be understood
before geologic evidence can be safely used to infer past climates.
    A reconnaissance study of small alpine glaciers can provide substantial information on the
response of these ice bodies to changes in mass balance. Many of these small glaciers are
nourished in part or entirely by avalanches (Meier, 1973), complicating the measurement of
mass balance. Thus, it is important to understand the limitations on climate interpretation
imposed by measurements from such glaciers. We report data collected during 1974 and 1975
on "Vesper" glacier (informal name), a small avalanche-nourished glacier located in the
North Cascade Range of Washington. The locations ofmoraines are utilized to infer local and
regional snow-line lowering which resulted in more positive mass balance and Neoglacial
advances of the glacier.

LOCATION

    "Vesper" glacier is the larger of two small ice bodies located immediately north of Vesper
Peak (1 894 m), in the southern part of Washington's North Cascade Range (Fig. 1). Figure 2
indicates local relationships; the glacier covers approximately o. I 7 km2 of the 5.2 km2 Copper
Lake basin, and has a mean altitude of 1 475 m. The terminus of this small valley glacier,
located at an elevation of 1 110 m, is among the lowest in the conterminous United States
(Post and others, 197 I). Field observations, discussed below, suggest that active ice extends
only to 1 250 m. Below this elevation, the "glacier" is largely a snow-field.
    "Vesper" glacier lies in a narrow slot cut into quartz diorite of early Oligocene age; its
orientation coincides with the principal joint set in the area (Dungan, unpublished). Topo-
graphy in the area is rugged; local relief approaches 1 000 m. The lake and glacier are
surrounded by cliffs and gullies which shed snow and debris onto the glacier and cirque floor.
More than 85 % of the area is affected by avalanches; as a result, vegetation is generally sparse
in this sub-alpine and alpine basin. Copper Lake occupies the floor of a cirque last filled with

                                                                         ~:NORTH CASCADE
                                                                         I:                RANGE
                                                                     {
                                                                     .:;~t,·                          SOUTH
                                                                         ":"'"" ''/'' ~              CASCADE
                                                                                   r
                                                                                   t:
                                                                                                           •
                                                                                                      GLACIER
                                                                                  ,.':
                                                                                  t~~ESPE~
                                                                                         - 1.GLACIER
                                                                                            .,.
                                                                                            t
                                                                                           I'
                                                                   S[ATTLE                i:
                                                                                         ~ "-...:.   " ",."."

                                     47"

                                                     WASHINGTON

                       Fig.   I.   Location map if the North Cascade Range, Washington.
MASS BALANCE            OF "VESPER"             GLACIER                              273

                    COPPER LAKE BASIN, NORTH
                     CASCADE RANGE, WASHINGTON

                                                                                  EXPLANATION
                                                                                    r
                                                                                    ~    NEOGLACIAL MORAINE

                                                                                    ..   ABLATION STAKE

                                                                                   •     PRECIPITATION STATION

                                                                                                 100 METERS

                       BASIN LOCATION
                                                    SCALE IN METERS
                                                o      200
                                                 • .o~           000

        Fig.   2.   Map of Copper Lake catchment showing the location   of sampling sites and Neoglacial moraines.

ice during late stages of the Fraser (latest Wisconsin an) Glaciation. The lake forms the
headwaters of Williamson Creek, which flows 10 km down-stream to Spada Lake, drinking-
water supply for some 250 000 residents of nearby Snohomish and King Counties. Moraines
flanking "Vesper" glacier (Fig. 2), numerous nivation hollows, and several moraine-like
features attest to extensive Neoglacial activity.
    Field studies commenced in April 1974 and continued until early November, encom-
passing the ablation season; data were collected from late May until late October during the
1975 ablation season as well. Results and interpretation of our mass-balance studies are
discussed in the following sections.

DETERMINATION OF MASS BALANCE

   Field studies were primarily concerned with defining the water budget for "Vesper"
glacier and the Copper Lake basin. Conservation of mass for glaciers on an annual basis may
be stated as (Mayo and others, 1972):
274                                    JOURNAL OF        GLACIOLOGY

                                       tlS = Ca-Aa                                       (I)
where tlS is the change in glacier storage, Ca the total measured accumulation from direct
precipitation and snow transported by avalanche or wind, a nd Aa the total ablation, including
snow melt and evaporation, all expressed in water equivalent.
   For the entire Copper Lake basin, re-a rranging and expanding Equation ( I) gives:
                                         R = P-E±tlS                                      (2)
where R is the annual run-off averaged over the basin, P the annual precipitation averaged
over the basin, E the annual evapotranspiration averaged over the basin, and tlS the annual
change in ice and ground-water storage averaged over the basin, all expressed as an equivalent
thickness of water.
    Calculation of water balance for the glacier and catchment requires data for: precipitation
influx, ablation on the glacier, run-off from Copper Lake, evapotranspiration, and changes in
water storage. Mass-balance data collected during 1974 and 1975 are summarized in Table I.
Measurement techniques, measurements, and estimated values for these p a rameters are
discussed below.

       TABLE I. SUMMARY OF MASS BALANCE FOR COPPER LAKE BASIN AND "VESPER" GLACIER FOR
                                        1974 AND 1975
                                                            Total
                                                        precipitation                   Ablation
                             Period                   (snow and rain )   Run-off    (H Vesper" glacier)
                                                            mm            mm               mm
              I O ctober    1973-30 April 1974             47 00 *       I 200t             5 60 +
                  I May     1974-20 June 1974               5 20 *       1510t            I 100+
                21 June     1974-30 June 1974                 60           3 70             23 0
                   I July   1974-3 1 July 1974              260          109 0            12 5 0
               I August     1974-3 1 August 1974             80            760            145 0
         I   September      1974-30 September 1974          120            47 0             85 0

           I O ctober       1973-30 September 1974         5740          5400             5440
             October
             I              1974-3 I October 1974            155            35t             3 10
         I November         1974-30 April 1975             3 28 5*       2 120t             610+
               I May        1975-23 May 1975                 28 5          53 0 t           255+
             24 May         1975-6 July 1975                 30 5          7 2 5t         I 110
                7 July      1975- 19 July 1975                70             90 t           4 00
              20 July       1975-22 August 1975               70           19 0 t         1500
           23 August        1975- 13 September 1975          275            80t             65 0
        14 September        1975-30 September 1975            35              lOt           45 0
             I O ctober 1974-30 September 1975             44 80          379 0           5 28 5
          * Estimated after Schermerhorn (1967) and from the 1974-75 relation between Olney Pass
       and Copper Lake area precipitation.
          t Estimated from Wall ace River run-off; run-off from 13 September 1975 to 25 O ctober
       1975 is estimated from ablation and precipitation during the period.
          :\: Estimated from detailed snow-course measu rements (Soil Conservation Service) at
       Stevens Pass (I 300 m), Washington (45 km south-east of "Vesper" glacier).

Precipitation
     At elevations above 900 m in the North Cascades, more than 80 % of annual precipitation
falls as snow; amounts range from 2 000 to more than 4 000 mm (Rasmussen and Tangborn,
1976). In the study area, winter ( I October to 30 April) precipitation accounts for 80 % of the
annual total. Precipitation influx to the Copper Lake area was measured by several non-
recording gages and one continuous-recording gage during the summer and fall of 1974;
during 1975 the recording gage was moved to lower elevations along WilIiamson Creek.
Water content of the snow-pack a t 1000 m was determined in early April 1974, and in late
May 1975.
MASS       BALANCE OF                      "VESPER"               GLACIER              275
    The Everett Water Department maintains a weather station at Olney Pass, located some
15 km west of Copper Lake; additional nearby weather stations are shown in Figure 3.
Monthly precipitation measured at Copper Lake during the study period was highly correlated
with, and averaged 1.3 times, precipitation amounts measured at Olney Pass. Measurements
were made only during the summer and fall, so this relationship is based on less than 20% of
annual precipitation. Yearly precipitation can also be estimated using the effective-elevation
technique suggested by Schermerhorn (1967). Figure 4 shows the relationship for precipita-
tion stations near Copper Lake; the Copper Lake value, calculated from 1974-75 measure-
ments, appears consistent with the other data, and with the regional gradient shown by
Rasmussen and Tangborn (1976).
    Precipitation at Olney Pass from I October to 30 September in 1974 and 1975 amounted
to 4335 and 3380 mm, respectively; mean annual precipitation (1965-75) is 3700 mm.
Utilizing these values and Figure 4, annual precipitation on "Vesper" glacier is calculated as
4700 mm; influx in 1974 was 5 635 mm, while in 1975 it was 4395 mm.

                                       o
                                       LOCATION MAP

                                                      10
                                                                                    •   WEATHER   STATION
                                                                                         T: TEMPORAR Y

                                             5                    20
                                                 KILOMETERS

                             Fig. 3. Meteorological stations in the viciniV' of Copper Lake basin.
                               ~OOO r----,----,----,-----,,-----,
                                                                                                  ..COPPER
                                                                                                     LAKE

                               4000
                      MEAN

                      ANNUAL

                               3000
                    PR Eel PITATION
                             (MM)

                               2000
                                                           I   STARTUP
                                                                                •   AFTER   SCHERMERHORN
                                                                                                    (1967)
                                              MONROE
                                1000                                            .. ESTIMATED FROM
                                        EvrRETT                                    1974-7~ MEASUREMENTS

                                    °0L---~~OO~--~10~0~0---I~~~OO~-~2~OO~0---~
                                                    EFFECTIVE            ELEVATION (M)
Fig. 4. Effective elevation/precipitation gradient in the viciniV' qf Copper Lake basin (after Schermerhorn, 1967). The mean
     and la value for each point were calculated from precipitation records for the stations: Everett (r916-75); Monroe
     (1938-75); Startup (1952-75) ; Verlot (1947-78) ; Silverton (1953-68 ); Big Four (1928-42, missing months);
     Olney Pass (1965-75); and Copper Lake (1974-75, partial records).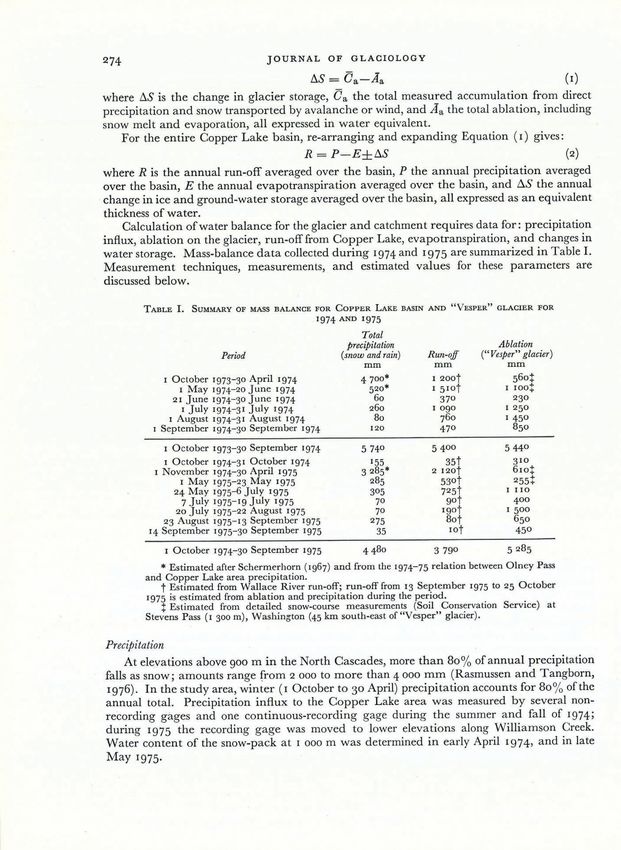
JOURNAL OF GLACIOLOGY

Ablation
     Ablation, the loss of snow and ice, primarily by melt, occurs at significant rates from late
April or early M ay until October on glaciers in the North Cascades. NIeier (1962) has termed
this the "ablation season". Melt was measured during most of this period on "Vesper"
glacier in 1974 and 1975. However, snow melt also takes place during the accumulation
season when warm storms sweep off the Pacific Ocean, and during infrequent sunny, warm
periods of early spring. These "losses" occur while the Copper Lake area is inaccessible.
Estimation of this ablation requires data from a nearby snow course.
     Ablation on "Vesper" glacier was measured from 20 June to 2 November 1974, and from
23 May to 25 October 1975 by means of wooden snow stakes at elevations of I 140, I 260,
I 430, and I 560 m. Considering the size of the glacier, our array is thought to be adequate.
Stakes were read at three-day intervals in the summer of 1974, and less frequently during the
fall of that year and in 1975. Snow density, measured in snow pits, averaged 0.55 Mg m- 3
during the summer of both years; values were slightly higher in the fall, and lower (~0.40)
in the spring months. Measured ablation in 1974 was 3780 mm, while a loss of 4420 mm
was recorded in 1975. Losses recorded at each stake during individual periods were erratic,
but summer ablation at the stake with the highest elevation (I 560 m) was approximately
20% lower than that recorded at I 140 m.
    Ablation during periods when "Vesper" glacier is inaccessible can be estimated from snow-
course measurements at Stevens Pass (I 300 m), 45 km to the south-east of the glacier.
     Ablation before the measurement period equals the cumulative precipitation before the
measurement period, minus the water content of the snow pack at the beginning of the
measurement period. Calculation of pre-measurement ablation at Stevens Pass during the
two study years suggests that substantial ablation occurred during the early spring of each
year. It is also likely that a series of very warm storms resulted in winter ablation during
January 1974. Ablation estimates for "Vesper" glacier during the spring of 1974 appear high
(Table II ), but the weather was unusually sunny and warm during late May and early June.
The ablation estimate from 30 April to 20 June 1974 agrees well with the 1 200 mm of
ablation measured at a snow pit immediately north of Copper Lake from 13 April to 20 June
1974 (Fig. 2). It is more difficult to evaluate the accuracy of estimates for the other two periods
(Table II). If most of this estimated ablation occurred between March and June of each year,
an ablation rate of approximately 10 mm d- I is required. Estimated rates averaged 10 to
15 mm d- I during April 1974 and nearly 20 mm d- I in May at the Copper Lake snow pit.
W. V. Tangborn (personal communication in 1978) has measured comparable rates for two-
week periods at higher altitude on the South Cascade Glacier during early May. Thus, use of
snow-course data from Stevens Pass to estimate unmeasured ablation on "Vesper" glacier
seems reasonable.

                           TABLE H. ESTIMATED ABLATION DURING PERIODS
                              WHEN "VESPER" GLACIER WAS INACCESSIBLE

                                       Period                   Ablation
                                                                  mm
                             I October 1973-29 April 1974          560
                               30 April 1974-20 June 1974        I 100
                            , November 1974-23 May '975            865

    Taking the estimates in Table II plus the measured values (Table I) gives total ablation
of 5 440 mm in 1974 and 5285 mm in 1975. The accuracy of these figures is difficult to
evaluate; direct ablation measurements are subject to a variety of errors (see Meier and
Tangborn, 1965; Muller and Keeler, 1969), but they are not likely to introduce errors of more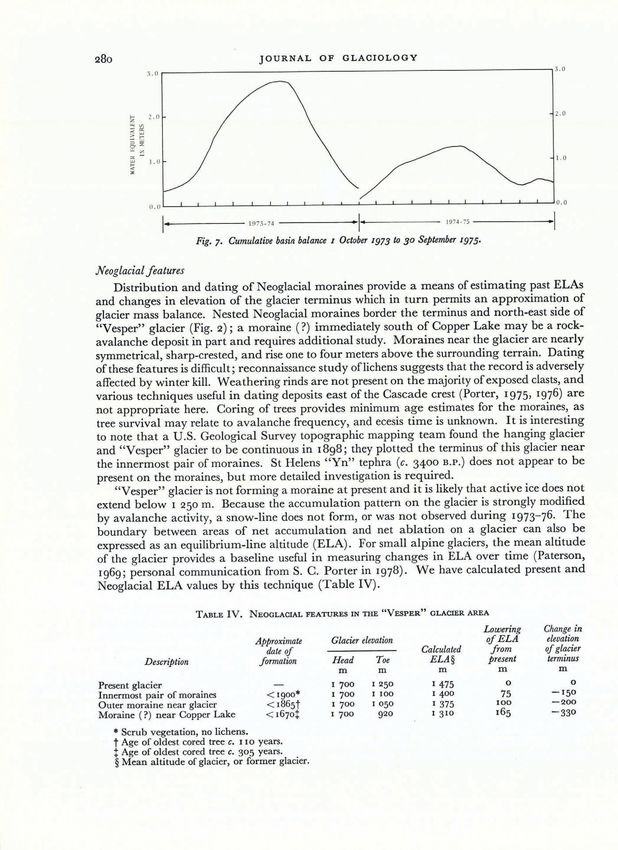
MASS   BALANCE     OF   "VESPER"    GLACIER

than 5 to 10% in measured figures. Estimated ablation for each year may bein error by as much
as 200 to 300 mm. Finally, integration of point measurements over the surface of the glacier
doubtless introduces some error, but the density of stakes (I per 0.04 km2) seems adequate.
    The yearly pattern of ablation rates is similar to temperature patterns recorded at Olney
Pass (Fig. 5) where July and early August temperatures average 14°C. On "Vesper" glacier,
temperatures during peak ablation periods averaged 8.S oC, and were closely related to
temperatures recorded at Olney Pass. Five-day ablation rates measured on the glacier during
1974 are highly correlated (N = 15, T2 = 0.84) with Olney Pass temperature during the
summer and fall; highest measured rates occurred in the warmest period of the summer, and
averaged 79 mm d- I over a five-day period. During sunny, warm periods, ablation is
primarily a function of the net radiation balance, which is highly correlated with mean air
temperature. A reasonable estimate of summer ablation on "Vesper" glacier can thus be
obtained from temperature measured some 15 km away.
    Ablation rates and total ablation are remarkably high on "Vesper" glacier; comparable snow
melt has been reported at the Blue Glacier and in other maritime zones (LaChapelle, 1959).

Run-off
    Snow melt is the principal component of run-off from alpine and sub-alpine zones;
highest flows in the Cascades generally occur during the summer months. Discharge from
Copper Lake basin was monitored in 1974 from mid-June to early November by a continuous
recording gage installed at the north-west end of the lake. The lake gage was destroyed by an
avalanche in early 1975, and discharge measurements were made on a reconnaissance basis
during the 1975 ablation season.
    Monthly run-off for the 1975 water year was estimated from discharge measured on the
Wallace River, located 20 km south of Copper Lake. The Wallace catchment receives about
30% less precipitation than the Copper Lake area. However, Dethier (unpublished) has
demonstrated that daily and monthly discharge on the Wall ace River is highly correlated with
that measured on Williamson Creek, which drains Copper Lake. Monthly run-off from
Copper Lake catchment was taken as 1.4 times Wall ace River run-off. As a rough check on
these estimates, measured ablation rates were applied to the average monthly snow cover in the
basin. Monthly run-off then equalled this volume plus precipitation during the period. Run-off
calculated by this method was within 15 % of that estimated from Wallace River run-off.
    Discharge measurements during 1974 are thought to be accurate to within 10 to 15 % for
most periods. Estimated run-off before June in 1974 and during 1975 is dependent on
correlation with Wall ace River records, precipitation amount, area snow cover, and snow-
melt rates. Listed values are probably accurate within 25 % and may be substantially better,
but the error is difficult to evaluate. Run-off in 1973-74 was approximately 5 400 mm, while
in 1974-75 it was about 3 800 mm ; measured peak discharge was 5.2 m 3 S - I. Mean annual
run-off from the entire Sultan River basin (193 km2) down-stream from Copper Lake is
3700 mm (Rasmussen and Tangborn, 1976). This basin includes considerable forested low-
land area, so it is reasonable to calculate upland contributions as more than four meters.

Storage
    Water may be stored in alpine catchments as ground water, as snow or ice, or as liquid
water within glaciers. Ground-water storage in the study area is minor because thin surficial
deposits and impermeable bedrock dominate the basin, run-off is rapid, and there is little
available storage. Annual I1S for ground water can be considered equal to zero. Net evapora-
tion from Copper Lake basin is probably close to 100 mm (Puget Sound Task Force, 1970);
thus we can assume E ~ 0, also.
    At the close of the ablation season, the volume of the new firn covering older firn or ice
(minus the measured ice ablation where ice is exposed) provides an accurate measure of I1S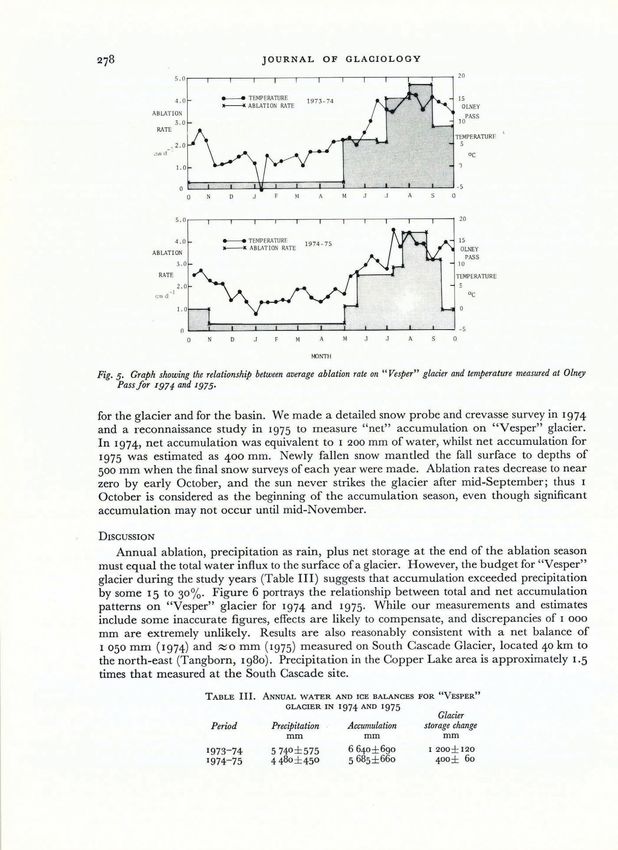
JOURNAL            OF       GLACIOLOGY

                           5.0 r-~----;-----;----'--'--'--'--'------r-~-~----'                            20

                                     _ _ THIPERA11JRE
                           4.0                                   1973- 74
                                     lI------iC. ABLATION RATE
             ABLATION
                   3.0
               RATE
                                                                                                        TEMPERATURF
                                                                                                          5
              .;,nd
                                                                                                                QC
                           1.0

                           5.0r-~----;-----;----'--'--'--'--'------r-~-~----'                             20

                           4.0       ....--.... TEMPERATURE                                               15
                                                                 1974-75
                                     .-------. ABLATION RATE                                               OLNEY
             ABLATION
                                                                                                               PASS
                           3.0                                                                            10
               RATE                                                                                     TEMPERATURE
                           2.0
                      ·1
              cm d

                           1. 0

                            o L-Jt==~~==~~==~==L--L                                  __L--L__~~ _5
                              o              A

Fig. 5. Graph showing the relationship between average ablation rate on "Vesper" glacier and temperature measured at Olney
     Pass for I974 and 1975·

for the glacier and for the basin. We made a detailed snow probe and crevasse survey in 1974
and a reconnaissance study in 1975 to measure "net" accumulation on "Vesper" glacier.
In 1974, net accumulation was equivalent to I 200 mm of water, whilst net accumulation for
1975 was estimated as 400 mm. Newly fallen snow mantled the fall surface to depths of
500 mm when the final snow surveys of each year were made. Ablation rates decrease to near
zero by early October, and the sun never strikes the glacier after mid-September; thus I
October is considered as the beginning of the accumulation season, even though significant
accumulation may not occur until mid-November.

DISCUSSION
    Annual ablation, precipitation as rain, plus net storage at the end of the ablation season
must equal the total water influx to the surface ofa glacier. However, the budget for "Vesper"
glacier during the study years (Table In) suggests that accumulation exceeded precipitation
by some 15 to 30 % . Figure 6 portrays the relationship between total and net accumulation
patterns on "Vesper" glacier for 1974 and 1975. While our measurements and estimates
include some inaccurate figures, effects are likely to compensate, and discrepancies of I 000
mm are extremely unlikely. Results are also reasonably consistent with a net balance of
1050 mm (1974) and ~o mm (1975) measured on South Cascade Glacier, located 40 km to
the north-east (Tangborn, 1980). Precipitation in the Copper Lake area is approximately 1.5
times that measured at the South Cascade site.
                                  TABLE    Ill.   ANNUAL WATER AND ICE BALANCES FOR "VESPER"
                                                          GLACIER IN        1974   AND   1975
                                                                                                    Glacier
                                  Period             Precipitation           Accumulation       storage change
                                                          mm                       mm                mm
                                                     5740 ± 575               6640 ±690          1200 ± 120
                                                     448o ±45 0               5 68 5±660          400 ± 60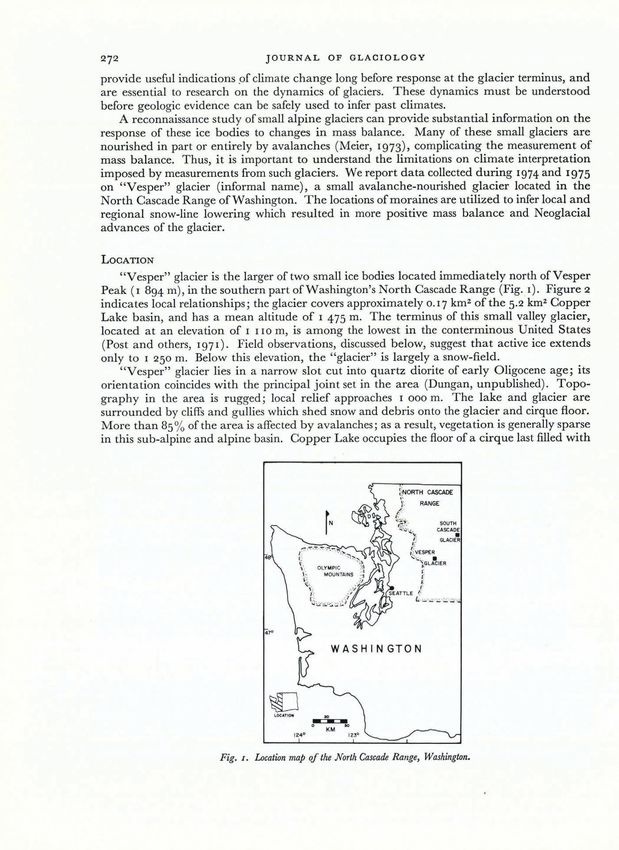
MASS BALANCE                             OF        "VESPER"                     GLACIER                                  279
                                                                            197:;- ""l~

                                                                                              GLACIER ARb\, l :-i SQUARE KILOMETERS
                                                                                          o     .01.02 .n.:; .O~ .05.06
                         1800                                                                                                                   1800

                         1700                                                                                                                   17{)0

                         1600                                                                                                                   IhlHl

                         1500                                                  ,~('                                                             1SUO

                    co   1400                                                                                                                   14()(J
                    f'
                    ~    1300                                                                                                                   1301l
                    <

                         1200                                                Old                                                                1200
                                                                             F i rn

                                     7 -,L
                         1100 L - -,'::- 6 -'~
                                             5-    , '-
                                                     4-     , '-
                                                              3-   ' '::-
                                                                      2-      '-'--1--=--'---'-----'----'----'-'---'----'---' 110U
                                                          I\O\TJ;R EQUI\·Al.nrr , I\: :IITI.J(S

                                                                             1974-75

                                                                                          CIACIER AREA ,    IN SQUAR I: Kll.mlETERS
                                                                                                ,01   .02   .n:;    ,(J4   ,OS   , Oh
                         1800                                                                                                           JHUU

                         1700                                                                                                           l iOO

                    "-
                    ~ 1600                                                                                                              1bO(J

                    ;    1500                                                  l ee                                                     1500

                    ~    14 00                                                                                                          14UO

                    f'                                                      O ld
                    S 1300                                                  Fi rn
                                                                                                                                        1300
                    <
                         1200                                                                                                           1200

                         1100 "---'-_-'---'-_"---'-_-'-----'-_-=L..L_-'-----'_-'----'-'----'----l 1 100
                                  -7  -6   -5  -4     -3     -2     -1
                                                  1\'AT Elt EQtJ IVAI.[~T , I\: : !ETEltS

Fig. 6. Net balance bn total accumulation         C. and total ablation A. as functions                            of altitude and glacier and basin area-altitude
     distribution.

    Two sources of the "excess" accumulation are wind-blown snow and avalanche-
transported snow. It is likely that the lower 300 m of the glacier is actually a permanent
snow-field fed by avalanches that travel down the glacier. A lack of crevasses below I 250 m
supports this observation. While the upper three ablation stakes displayed as much as 40 m
of down-slope motion, the lowest snow stake did not move in 1974 or 1975, and the stake
installed in 1974 melted out of avalanche debris in early fall 1975 within a few meters of the
position in which it was first placed in 1974. Avalanches (and perhaps wind-blown snow)
thus play a central role in the pattern of accumulation on "Vesper" glacier and contribute 15
to 30 % of the total mass influx to the glacier. Tangborn and others (1977) suggest that these
processes contribute as much as 35 % of the yearly accumulation on South Cascade Glacier.
    The mass balance for the Copper Lake catchment, neglecting the minor effects of
evapotranspiration and storage changes, suggest that run-off was approximately equal to
precipitation in 1974. Figure 7 shows the water balance for the Copper Lake catchment
during 1974 and 1975. The two years are separated because run-off data for 1975 are only
approximate. Estimated run-off in 1975 is about 700 mm less than the precipitation for that
period, an error of some 17 % . The error is likely to be a result of yearly differences in precipi-
tation for the Copper Lake and Wall ace River areas, inaccurate estimates of snow cover, and
difficulties inherent in applying ablation rates measured on the glacier to the entire basin.
Given these uncertainties, the error does not seem unreasonable.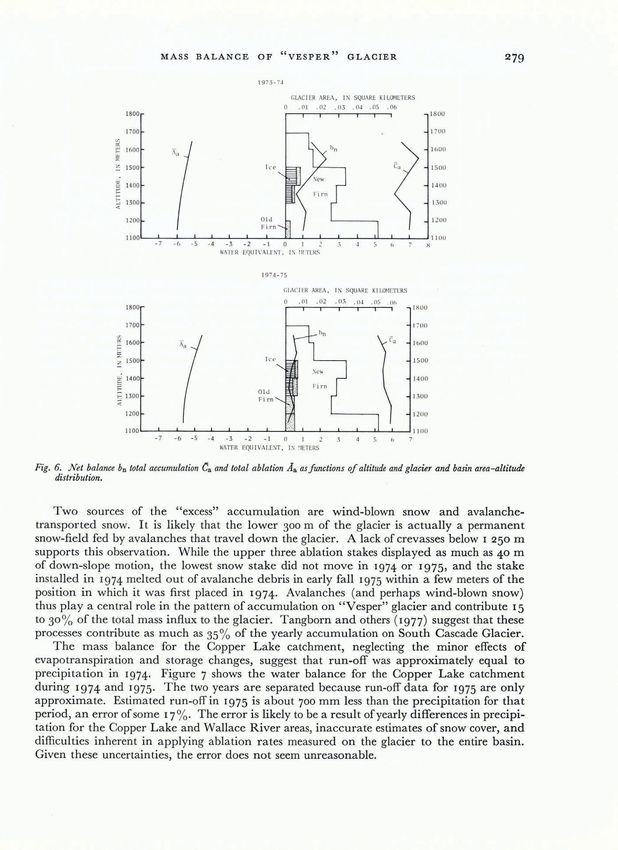
280                                     JOURNAL         OF       GLACIOLOGY
            3.0 . - - - - - - - - - - - - - - - - - - - - - - - - - - - - - - - - - - - - , 3.0

            2.0                                                                                                      2.0

            1. 0                                                                                                     1.0

            0.0 '---'--_'---'-----''-----'--_-'---'--_'---'--_-'---'-_'----'--_-'----'-_-'--'-_-'----'-_-'----'----' 0.0

                   1. . ------       1973-74   -------·1.·------
                                                         .                               197'·75   --------·1
                        Fig. 7. Cumulative basin balance I October I973 to 30 September I975.

Neoglacial features
    Distribution and dating of Neoglacial moraines provide a means of estimating past ELAs
and changes in elevation of the glacier terminus which in turn permits an approximation of
glacier mass balance. Nested Neoglacial moraines border the terminus and north-east side of
"Vesper" glacier (Fig. 2) ; a moraine ( ?) immediately south of Copper Lake may be a rock-
avalanche deposit in part and requires additional study. Moraines near the glacier are nearly
symmetrical, sharp-crested, and rise one to four meters above the surrounding terrain. Dating
of these features is difficult; reconnaissance study oflichens suggests that the record is adversely
affected by winter kill. Weathering rinds are not present on the majority of exposed clasts, and
various techniques useful in dating deposits east of the Cascade crest (Porter, 1975,1976) are
not appropriate here. Coring of trees provides minimum age estimates for the moraines, as
tree survival may relate to avalanche frequency, and ecesis time is unknown. It is interesting
to note that a U.S. Geological Survey topographic mapping team found the hanging glacier
and "Vesper" glacier to be continuous in 1898; they plotted the terminus of this glacier near
the innermost pair of moraines. St Helens "Yn" tephra (c . 3400 B.P. ) does not appear to be
present on the moraines, but more detailed investigation is required.
    "Vesper" glacier is not forming a moraine at present and it is likely that active ice does not
extend below I 250 m. Because the accumulation pattern on the glacier is strongly modified
by avalanche activity, a snow-line does not form, or was not observed during 1973-76. The
boundary between areas of net accumulation and net ablation on a glacier can also be
expressed as an equilibrium-line altitude (ELA). For small alpine glaciers, the mean altitude
of the glacier provides a baseline useful in measuring changes in ELA over time (Paterson,
1969; personal communication from S. C . Porter in 1978). We have calculated present and
Neoglacial ELA values by this technique (Table IV).

                        TABLE IV.    NEOGLACIAL FEATURES IN THE "VESPER" GLACIER AREA

                                                                                                   Lowering      Change in
                                      Approximate         Glacier elevation                         of EL A       elevation
                                         date of                                 Calculated          from        of glacier
          Description                  formation          Head        Toe         ELA§              present       terminus
                                                             m        ID             m                m             m
Present glacier                                           1 700      12 50          1475                0              0
Innermost pair of moraines               < 1 900 *        1700       1 100          1400              75           -150
Outer moraine near glacier               < 1865t          1 700      10 50          1 375            100           -200
Moraine (?) near Copper Lake             < 167°:::       1700         920           13 1O            16 5          -33 0
   * Scrub vegetation, no lichens.
   t   Age of oldest cored tree c. I 10 years.
   ::: Age of oldest cored tree C. 305 years.
    § Mean altitude of glacier, or former glacier.
MASS BALANCE OF "VESPER" GLACIER
The current ELA for "Vesper" glacier is approximately I 475 m (regional value c.
I 800 m), and moraines formed in the last 150 years suggest an ELA depression of approxi-
mately 100 m. If the pre-I7oo feature is a moraine, it was formed by "Vesper" glacier, the
hanging glacier, and smaller contributing ice bodies. The area of the glacier is thus uncertain,
and the calculated ELA depression of 165 m must be regarded as tentative. Limited data
from other North Cascade sites (Miller, 1969; Crandell, 1969; Crandell and Miller, 1974;
Porter, 1976) indicate that regional ELA depression amounted to 100 to 200 m (personal
communication from S. C. Porter in 1978), and these figures are consistent with observations
by Scott (1977) for the Cascades of Oregon.
"Excess" accumulation from avalanches and substantial local precipitation result in the
persistence of "Vesper" glacier at an elevation 250 to 400 m below that of other North
Cascade ice bodies. Preliminary data indicate that the pattern of Holocene fluctuations on
"Vesper" glacier is compatible with measurements made on other North Cascade glaciers.
Thus glaciers which receive a substantial proportion of their accumulation from wind-blown
or avalanche-transported snow may be useful as climatic indicators. This hypothesis implies
that the accumulation of avalanche deposits and drifted snow are functions of total precipita-
tion; increased precipitation apparently results in increased accumulation on the glacier
surface and surrounding slopes. However, the processes which link total snow-fall and
avalanche activity are not well-documented at present and observations must remain
qualitative. The depressed regional snow-line which characterized the mid- to late-nineteenth
century resulted in positive net balances on "Vesper" glacier; additional investigation of the
dynamics of small glaciers may help to separate the effects of decreased ablation from increases
in total accumulation (Tangborn, 1980).
SUMMARY
"Vesper" glacier persists 300 m below the regional threshold of glaciation (Porter, 1977)
as a result of excessive local precipitation and the accumulation of transported snow on the
glacier surface. Precipitation amounted to 5635 and 4480 m in 1974 and 1975 (estimated
average, 4 700 mm), respectively, while ablation in these years averaged 5 350 mm. Accumu-
lation in excess of precipitation, largely from avalanches, resulted in net accumulation equal
to I 200 mm in 1974, and 400 mm in 1975; net balance figures compare favorably with those
measured at nearby South Cascade Glacier.
Moraines near the terminus of "Vesper" glacier reflect advances in the past 3400 years,
probably in the last 500 years. Snow-line lowering of approximately 165 m apparently
occurred during the most extensive advance. The Neoglacial chronology and relative ELA
depression at "Vesper" glacier correspond with sparse data from other glaciers in the North
Cascade Range. Changes in the position of the terminus and moraine formation are
apparently systematic, which suggests that avalanche-nourished bodies like "Vesper" glacier
are useful for climatic reconstruction.
ACKNOWLEDGEMENTS
Members of the U.S. Geological Survey Glaciology Project (Tacoma, Washington),
notably Wend ell Tangborn and Mark Meier, encouraged this work, provided gaging and
probing equipment, and gave generously of their time and expertise. The financial support of
the Explorers Club of New York is gratefully acknowledged. Tom Eckels provided moun-
taineering skills, an uncanny ability with instruments, and humor that helped us persist in the
fog and rain characteristic of the North Cascade Range.
MS. received 21 August 1979 and in revisedform 26 February 1980JOURNAL OF GLACIOLOGY
REFERENCES
Crandell, D. R. 1969. Surficial geology of Mount Rainier National Park, Washington. U .S. Geological Survey.
Bulletin 1288.
Crandell, D. R., and Miller, R. D. 1974. Quaternary stratigraphy and extent of glaciation in the Mount Rainier
region, Washington. U.S. Geological Survey. Professional Paper 847.
Dethier, D. P. Unpublished. Geochemistry of Williamson Creek, Snohomish County, vVashington. [Ph.D.
thesis, University of Washington, 1977.]
Dungan, M. A. Unpublished. Ultramafic and mafic rocks of the East Stillaguamish area, North Cascades,
Snohomish County, Washington. [Ph.D. thesis, University of Washington, 1974.]
LaChapelle, E. R . 1959. Annual mass and energy exchange on the Blue Glacier. Journal of Geophysical Research,
Vo!. 64, No. 4, p. 433-49·
Mayo, L. R., and others. 1972. A system to combine stratigraphic and annual mass-balance systems: a contribution
to the International Hydrological Decade, by L. R. Mayo, M. F . Meier, and W. V. Tangborn. Journal of
Glaciology, Vo!. 11, No. 61, p . 3-14.
Meier, M . F . 1962. Proposed definitions for glacier mass budget terms. J ournal of Glaciology, Vo!. 4, No. 33,
P·25 2- 6 3·
Meier, M. F. 1965. Glaciers and climate. (In Wright, H. E.,jr, and Frey, D. G., ed. The Quaternary of the United
States. Prince ton, N.]., Princeton University Press, p. 795-805.)
Meier, M . F. 1973. Hydraulics and hydrology of glaciers. (In [International Hydrological Decade.] The role
of snow and ice in hydrology. Proceedings of the BarifJ symposia, September I 97 2. Paris, UNESCO; Geneva, WMO;
Budapest, IAHS, Vo!. I, p. 353-70. (Publication No. 107 de l'Association Interna tionale d'Hydrologie
Scientifique. )
Meier, M . F., and Tangborn, W. V. 1965. Net budget and flow of South Cascade Glacier, Washington. Journal
of Glaciology, Vo!. 5, No. 41 , p. 547-66.
Miller, C. D. 1969. Chronology of neoglacial moraines in the Dome Peak area, North Cascade R ange, Washing-
ton. Arctic and Alpine R esearch, Vo!. I, No. I, p. 49-65.
Muller, F., and Keeler, C. M. 1969. Errors in short-term ablation measurements on melting ice surfaces. Journal
of Glaciology, Vo!. 8, No. 52, p. 91-105.
Paterson, W . S. B. 1969. The physics of glaciers. Oxford, etc., Pergamon Press. (The Commonwealth and
International Library. Geophysics Division.)
Porter, S. C . 1975. Weathering rinds as a relative-age criterion: application to subdivision of glacial deposits in
the Cascade Range. Geology, Vo!. 3, No. 3, p . 101-04.
Porter, S. C. 1976. Pleistocene glaciation in the southern part of the North Cascade Range, Washington.
Geological Society of America. Bulletin, Vo!. 87, No. I , p. 61-75.
Porter, S. C . 1977. Present and past glaciation threshold in the Cascade Range, Washington, U .S.A. : topographic
and climatic controls, and paleoclimatic implications. Journal of Glaciology, Vo!. 18, No. 78, p . 101-16.
Post, A. S., and others. 197 I. G laciers in the United States. Inventory of glaciers in the North Cascades, Washing-
ton, by A . [S.] Post, D. Richardson, W. V. Tangborn, and F. L. Rosselot. U.S. Geological Survey. Professional
Paper 705-A.
Puget Sound Task Force. 1970. Comprehensive study of water and related land resources, Puget Sound and adjacent waters,
State of Washington. Appendix XIV. Watershed management. [No place], Pacific Northwest River Basins
Commission.
R asmussen, L. A., and Tangborn, W. V. 1976. Hydrology of the North Cascades region, Washington. I. Runoff,
precipitation, and storage characteristics. Water Resources Research, Vo!. 12, No. 2, p. 187-202.
Schermerhorn, V. 1967. R elations between topography and annual precipitation in western Oregon and
Washington. Water R esources R esearch, Vo!. 3, No. 3, p. 707-1 I.
Scott, W . E. 1977. Quaternary glaciation and volcanism, Metolius River area, Oregon. Geological Society of
America . Bulletin, Vo!. 88, No. I , p. 11 3-24.
T angborn, W. V. 1980. Two models for estimating climate-glacier relationships in the North Cascades,
Washington, U.S.A. Journal of Glaciology, Vo!. 25, No. 91, p. 3-2 1.
Tangborn, W . V., and Rasmussen, L. A. 1976. Hydrology of the North Cascades region, Washington. 2. A
proposed hydrometeorological streamflow prediction method. Water Resources Research, Vo!. 12, No. 2,
p. 20 3- 16.
T angborn, W. V ., and others. 1977. Ice and water balances at selected glaciers in the United States. Combined
ice and water balances of Maclure Glacier, California, South Cascade Glacier, Washington, and Wolverine
and Gulkana Glaciers, Alaska, 1967 hydrologic year, by W. V. Tangborn, L. R. Mayo, D. R . Scully, and
R. M. Krimme!. U.S. Geological Survey. Professional Paper 715-B.You can also read