MASTER PLAN UPDATE Aviation Demand Forecasts - Leibowitz & Horton AMC JUB Engineers, Inc - Port of Bellingham
←
→
Page content transcription
If your browser does not render page correctly, please read the page content below
BELLINGHAM INTERNATIONAL AIRPORT
MASTER PLAN UPDATE
Chapter 3
Aviation Demand Forecasts

Prepared by:

Leibowitz & Horton AMC
JUB Engineers, Inc.
3
                                                                  3   FORECAST OF DEMAND

3.1        INTRODUCTION
The purpose of this chapter is to prepare updated forecasts of
aviation demand for Bellingham International Airport (BLI).
Forecasting is a key element in the planning process. Information
contained in the forecasts is essential for determining future airport
requirements, analyzing alternative development plans, assessing
possible environmental effects of proposed plans, and determining
the economic implications of future growth and development.

Forecasts of activity presented in this chapter are to be used as
guidelines for the formulation of the long-range development
program for the airport. Implementation of the various facility
improvement projects recommended as an outgrowth of these
forecasts should be based on activity reaching the demand levels
related to the associated facilities and not on adherence to the
timetable (yearly dates) presented as part of the forecasts. The
timeline is presented only as a possible model of the logical
progression of activity as it increases with time.

Forecast Time Frame and Base Year
Updated aeronautical activity estimates for BLI were prepared for
the short, intermediate, long-range, and extended range time
frames which equate to 2003 - 2007, 2008 – 2012, 2013 - 2022,
and 2050 respectively. The year 2000 will be used as the basis for
comparing BLI forecasts with the FAA Terminal Area Forecast
(TAF). Year 2003 has been selected as the first year of the

Bellingham International Airport Master Plan Update – June 2004

                                                                                       3-1
Chapter 3: Forecast of Demand
forecast in order to provide the Port with a full 5-year, detailed
Capital Improvement Program (CIP) upon completion of the Plan,
which is anticipated for the end of 2002.
3.2 DEMAND ELEMENTS
There are numerous kinds of activity occurring on an airport on a
daily, monthly, and yearly basis. The level and kind of activity
depends on many factors and usually reflects the services available
to passengers and aircraft, meteorological conditions under which
the airport operates (daily and seasonally), and businesses located
on the airport facility or within the community the airport serves.
Activities that are forecast for BLI include passengers, based
aircraft, aircraft operations, and aircraft types. These are general
forecast categories. Several additional forecasts have been derived
from these. Specifically, forecasts were prepared for the
following:
• Airline Activity
• Passenger enplanements
• Passenger deplanements
• Aircraft load factor
• Aircraft operational fleet mix
• Aircraft operations
• Peaking characteristics
• General Aviation Activity
• Aircraft operations
• Aircraft operational peaking
• Based aircraft
• Based aircraft fleet mix
• Military Activity
• Aircraft operations
Bellingham International Airport Master Plan Update – June 2004
3-2Chapter 3: Forecast of Demand
• Total Airfield Aircraft Operational Activity
• Itinerant, local, and total aircraft operations
• Airfield peaking characteristics
• Aircraft operational fleet mix
• Critical Aircraft and Operations Activity
• The Critical Aircraft
• Critical Aircraft Operations
3.3 SUMMARY
Exhibit 3-1, shown on the following page, presents and compares
the master plan forecast with the FAA Terminal Area Forecast
(TAF), a task which is part of FAA requirements for preparation of
the master plan update forecast. It is important to note that the
comparison shown in Exhibit 3-1 is between the forecast contained
in this chapter (prepared based on 1999 TAF data with some
calendar year 2000 data from BLI records), and 2000 TAF data.
Consequently, some activity categories shown in Exhibit 3-1
(based on 2000 TAF) will vary slightly from data presented
throughout the chapter (based on 1999 TAF).
Bellingham International Airport Master Plan Update – June 2004
3-3Chapter 3: Forecast of Demand
Exhibit 3-1: Forecast Summary and Comparison
Forecast Element Year Historical FAA MP/TAF FAA TAF MPU MPU
for 2000 TAF (% 15 Yr Avg 15 Yr Avg 50 Yr Avg
& MPU Difference) Ann’l Growth Ann’l Growth Ann’l Growth
Forecast Rate 2 Rate 3 Rate 3
Enplanements - Air Carrier
Base Year (Historical) 2000 19,737 19,737 100.0%
Base yr. + 15 Years 1 2015 13,036 19,737 66.0% 0.0% -2.73%
Base yr. + 50 Years 2050 54,649 2.1%
Enplanements – Commuter/Air Taxi
Base Year (Historical) 2000 92,208 92,208 100.0%
Base yr. + 15 Years 1 2015 117,613 120,547 97.6% 1.8% 1.64%
Base yr. + 50 Years 2050 220,427 1.8%
Enplanements- TOTAL
Base Year (Historical) 2000 111,945 111,945 100.0%
Base yr. + 15 Years 1 2015 130,649 140,284 93.1% 1.5% 1.04%
Base yr. + 50 Years 2050 275,076 1.8%
Commercial Ops. - Air Carrier
Base Year (Historical) 2000 510 510 100.0%
Base yr. + 15 Years 1 2015 1,191 510 233.5% 0.0% 5.82%
Base yr. + 50 Years 2050 4,084 4.2%
Commercial Ops. – Commuter/Air Taxi
Base Year (Historical) 2000 22,086 22,086 100.0%
Base yr. + 15 Years 1 2015 9,799 25,641 38.2% 1.0% -5.27%
Base yr. + 50 Years 2050 9,722 -1.6%
Air Carrier & Commuter/Air Taxi
TOTAL COMMERCIAL OPS.
Base Year (Historical) 2000 22,596 22,596 100.0%
Base yr. + 15 Years 1 2015 10,990 26,151 42.0% 1.0% -4.69%
Base yr. + 50 Years 2050 13,806 -1.0%
GA Itinerant Operations
Base Year (Historical) 2000 36,696 36,696 100.0%
Base yr. + 15 Years 1 2015 50,200 47,955 104.7% 1.8% 2.11%
Base yr. + 50 Years 2050 75,449 1.5%
GA Local Operations
Base Year (Historical) 2000 26,636 26,636 100.0%
Base yr. + 15 Years 1 2015 30,768 34,808 88.4% 1.8% 0.97%
Base yr. + 50 Years 2050 46,243 1.1%
GA TOTAL Itinerant and Local
Operations
Base Year (Historical) 2000 63,332 63,332 100.0%
Base yr. + 15 Years 1 2015 80,967 82,763 97.8% 1.8% 1.65%
Base yr. + 50 Years 2050 121,692 1.3%
Commercial / GA / Military/Cargo
- TOTAL OPERATIONS
Base Year (Historical) 2000 87,273 87,273 100.0%
Base yr. + 15 Years 1 2015 100,175 100,259 90.9% 1.6% 0.92%
Base yr. + 50 Years 2050 152,817 1.1%
Bellingham International Airport Master Plan Update – June 2004
3-4Chapter 3: Forecast of Demand
Exhibit 3-1 (cont.): Forecast Summary and Comparison
Forecast Element Year Historical FAA MP/TAF FAA TAF MPU MPU
for 2000 TAF (% 15 Yr Avg 15 Yr Avg 50 Yr Avg
& MPU Difference) Ann’l Growth Ann’l Growth Ann’l Growth
Forecast Rate 2 Rate 3 Rate 3
Based Aircraft
Base Year (Historical) 2000 175 137 127.7%
Base yr. + 15 Years 1 2015 197 167 118.0% 1.3% 0.79%
Base yr. + 50 Years 2050 243 0.7%
1997 MPU
1997 MPU vs.
Cargo Operations 4 Historical Forecast Historical
Base Year 2000 3,378 3,195 94.6%
Base yr. + 15 Years 2015 6,871 4,500 65.5% NA 2.31%
Base yr. + 50 Years 2050 Not Avail. NA
1997 MPU
1997 MPU vs.
Cargo Tons 4 Historical Forecast Historical
Base Year 2000 1,257 6,872 546.7%
Base yr. + 15 Years 2015 4,089 13,160 321.8% NA 4.43%
Base yr. + 50 Years 2050 Not Avail. NA
1
FAA will typically find a master plan forecast generally acceptable if the forecast levels in the last year common to the airport forecast and the
TAF (usually 15 years in the future) come within 10% of the TAF forecast.
2
TAF base year is 2000 (no interpolation required)
3
TAF base year is 2000 (no interpolation required)
4
Forecast data from Bellingham International Airport, Master Plan Update, Port of Bellingham, 1997
3.4 HISTORICAL ACTIVITY
3.4.1 Summary
The previous Master Plan Update for Bellingham International
Airport was completed in mid-1997, with forecasts based on
activity data from 1988 through 1995. Since completion of the
Plan Update, the Airport has experienced fluctuations in both
passenger traffic and aircraft operations with both sharp declines
and significant rebounds. To gain a better perspective on the
long-term trends at the Airport, a longer than usual historical
period has been selected as a basis for this analysis. The historical
reporting period selected this master plan update extends from
1985 through year-end 2000, the last year for which data was
available. Passenger and operations levels for this period are
discussed on the following pages.
Bellingham International Airport Master Plan Update – June 2004
3-5Chapter 3: Forecast of Demand
3.4.2 Enplaned Passengers
Historically, enplaned passengers at BLI have shown considerable
160,000
140,000
fluctuation on a year-by year basis. However, the overall long-
120,000
100,000
term trend in enplaned passengers is positive. During the period
80,000
between 1985 and 2000, annual enplaned passenger levels at BLI
60,000
40,000 grew from approximately 33,700 in 1985 to 114,000 in 2000. This
represents more than a 300 percent increase overall and an average
20,000
1985 1990 1995 2000
BLI Enplaned Passenger compound annual compound growth rate of 7.9 percent. In fact, enplaned
annual growth 1985 to 2000 averaged passengers reached a high of nearly 152,000 in 1993 before pulling
7.9 percent per year.
back to under 92,000 by 1999. Enplaned passengers rebounded in
2000 to 114,00 at the close of the reporting period.
Between 1985 and 2000, enplaned passengers at the national level
grew at an average annual compound growth rate of 3.1 percent,
while passengers within the FAA’s Northwest Mountain Region
(ANM) grew at a 3.8 percent rate. As a result, even with the wide
fluctuations in enplaned passengers at BLI, the average rate of
growth was more than double the national and regional rates as
shown below:
10.0%
• 1985 – 2000 Historical Per Annum Growth Rates
8.0%
− 7.9 percent for BLI
6.0%
− 3.1 percent for the nation
4.0%
− 3.8 percent for the ANM
2.0%
Note: The 2000 through 2015 FAA Terminal Area Forecast
0.0% of enplanements for BLI projects a 1.56-% per annual growth rate.
National ANM BLI
Comparison of Average Annual The reasons for the wide swings in enplaned passengers at BLI are
Enplaned Passenger Growth Rates
believed to be related to the pricing and availability of air service
1985 to 2000
to the community rather than to specific local socio-economic
factors. Due to the complexity of this issue, a separate discussion
has been prepared under Section 3.5 – Historical Air Service
Perspective.
Bellingham International Airport Master Plan Update – June 2004
3-6Chapter 3: Forecast of Demand
Exhibit 3-2 on the following page summarizes a 15-year history of
passenger and operations activity at BLI from 1985 through
year-end 2000.
Bellingham International Airport Master Plan Update – June 2004
3-7Chapter 3: Forecast of Demand
Exhibit 3-2: Summary of Historical Activity
Enplaned Passengers Operations
Air Air Taxi/ Air Air Taxi/ General
Year Total Military Total
Carrier Commuter Carrier Commuter Aviation
1
1985 3,000 30,698 33,698 -- 12,000 48,553 842 61,395
19861 40,827 23,637 64,464 1,800 12,600 32,432 203 47,035
19871 63,490 18,380 81,870 1,889 12,779 34,409 203 49,280
19881 88,431 19,942 108,373 1,978 20,000 51,000 350 73,328
19891 81,647 5,729 87,376 2,789 18,487 63,663 753 85,692
19901 85,261 24,735 109,996 3,994 13,869 56,903 722 75,488
19911 63,199 65,013 128,212 2,713 15,587 57,972 721 76,993
19921 42,729 76,142 118,871 1,469 19,793 63,146 790 85,198
19931 46,459 105,259 151,718 1,083 19,016 58,894 1,031 80,024
19941 25,125 108,506 133,631 813 19,398 63,316 1,472 84,999
19951 22,015 104,022 126,037 1,026 20,489 58,216 1,777 81,508
19961 28,178 94,887 123,065 671 23,190 59,317 1,373 84,551
19971 24,433 87,125 111,558 705 20,682 57,827 1,647 80,861
19981 9,732 84,352 94,084 402 20,709 47,637 1,848 70,596
19991 2,711 88,953 91,664 137 22,008 57,384 1,347 80,876
20002 -- -- 113,925 479 22,347 65,489 1,415 89,730
Sources: 1FAA TAF Database. Fiscal Years 2000 to 2015, FAA-APO-00-7, December 2000
2
Based on Bellingham International Airport records. Only total for enplaned passenger is shown due
to differences in classification between BLI and FAA of air carrier and air taxi/commuter activities.
Historical Enplanements Historical Operations
100,000
160,000
140,000 80,000
120,000
60,000
100,000
80,000
40,000
60,000
40,000 20,000
20,000
- -
1985 1990 1995 2000
1985 1990 1995 2000
Air Carrier Air Taxi/Commuter Air Carrier Air Taxi/Commuter General Aviation Military
Bellingham International Airport Master Plan Update – June 2004
3-8Chapter 3: Forecast of Demand
3.4.3 Aircraft Activity
Understanding the character and extent of operations at BLI is
important to determining long-term facility requirements at the
airport. Total annual operations are presented in Exhibit 3-2,
shown above, according to the following categories:
100,000
90,000
• Air Carrier 80,000
70,000
• Air Taxi/Commuter 60,000
50,000
• General Aviation 40,000
30,000
Military.
20,000
• 10,000
0
1985 1990 1995 2000
The FAA defines an aircraft operation as either a takeoff or a Total operations fluctuated within a
landing. An air carrier operation is considered to be a takeoff or narrow range throughout the mid-
landing by a commercial scheduled air carrier aircraft with a 1990’s. Overall 1985 to 2000
operations growth averaged 2.3
seating capacity of 60 or more seats. Charter operations with percent annually.
aircraft with seating of greater than 60 are also included in the air
carrier category, for the purposes of this study. Commuter
operations include takeoffs and landings by scheduled commercial
flights with 60 or fewer seats. Air taxi operations include takeoffs
and landings of commercial aircraft of 60 or fewer seats on a non-
scheduled or for-hire (charter) basis. General aviation operations
are those takeoffs or landings not classified as commercial or
military.
Later, in the demand forecasts, general aviation and military
operations will be further divided into local and itinerant
operations. Local operations are defined as aircraft activity
remaining within the airport traffic pattern, within sight of the
airport, or known to remain within a 25-mile radius of the airport.
All activity not classified as local is considered itinerant.
Differences between FAA and airport definitions or classification
systems can make traffic data collected by the FAA appear
inconsistent with data collected by the airport. For example, an
operation by a commercial airline commonly considered a
Bellingham International Airport Master Plan Update – June 2004
3-9Chapter 3: Forecast of Demand
“regional carrier” within the market place would be categorized as
an "air carrier” operation if flown by an aircraft with more than 60
seats. Consequently, Horizon Air, a regional carrier currently
operating the 60+ seat Dash 8-400 aircraft would be classified as
an air carrier operation by FAA while the airport activity reports
might record the same activity as an air taxi/commuter operation.
A Horizon Air flight using a Dash 8/200 would be classified by
FAA as air taxi/commuter. Consequently, two operations by the
same carrier could be attributed to separate operations categories.
To the extent possible, this Master Plan Update uses FAA
operations and forecast data contained within the most current
Terminal Area Forecasts for BLI. The FAA data is being used
because of the consistent historical record it provides in addition to
long-term forecasts for comparison purposes.
Overall, annual operations fluctuated within a narrow range
throughout the mid-1990s with larger swings in activity early and
late in the period. Historical averages show that general aviation
has contributed approximately 72 percent of total operations at
BLI, followed by air taxi/commuter operations (24 percent), air
carrier operations (2 percent) and military (1 percent).
Air Carrier Activity
4,500
Air carrier operations peaked in 1990 – 1991, and after exhibiting a
sharp drop-off between 1992 and 1994, have continued a slower
4,000
3,500
3,000
2,500 decline through year 2000. The overall long-term trend for air
2,000
1,500 carrier activity is an average 8.5 percent per year decline over the
1,000
500
0
reporting period (see Exhibit 3-2). While enplaned passengers
1985 1990 1995 2000
experienced a 1990 to 1991 “spike” at the same time as air carrier
Air carrier operations exhibited an operations, passenger levels have continued to grow over time in
average 8.5 percent per year decline contrast to generally declining air carrier operations.
between 1985 and Year 2000.
In addition, air taxi/commuter operations showed peaks both
immediately preceding and following the air carrier 1990 – 1991
peak (see Air Taxi/Commuter Activity discussion below), with air
Bellingham International Airport Master Plan Update – June 2004
3-10Chapter 3: Forecast of Demand
taxi/commuter operations dipping in 1990 – 1991. From this it
may be inferred that, as passenger levels continued to grow,
changes occurred in the size of aircraft used by the carriers, with
larger aircraft in use during the 1990 – 1991 time frame.
Air Taxi/Commuter Activity
Since 1985, air taxi/commuter operations at BLI have averaged 25,000
nearly 4 percent annual growth. Operations nearly doubled over 20,000
the reporting period as air taxi/commuter takeoffs and landings 15,000
have comprised approximately 25 percent of total annual 10,000
operations. 5,000
0
1985 1990 1995 2000
As noted under the air carrier operations discussion above, air Air taxi/commuter operations nearly
taxi/commuter operations have, to a degree, appeared to move doubled, averaging 4 percent per
contrary to air carrier activity, i.e., dropping as air carrier activity year growth between 1985 and Year
2000.
increases and then resuming upward movement as air carrier
operations dropped off.
General Aviation Activity
Combined General Aviation (GA) itinerant and local operations 70,000
increased slightly more than 30 percent between 1985 and 2000 60,000
50,000
representing a compound annual growth rate of 1.8 percent. GA 40,000
30,000
operations rapidly expanded between 1987 and 1990 followed by 20,000
an extended period of minor increases and decreases. Activity 10,000
0
dipped between 1998 and 1999, but rebounded again in 2000. 1985 1990 1995 2000
General aviation total operations
During the 1985 to 2000 reporting period, GA operations averaged grew at an average annual rate of
1.8 percent while constituting 72
72 percent of total operations at BLI. Itinerant GA Operations percent of total BLI operations.
averaged 65 percent of total GA activity with the remaining 35
percent of GA operations classified as local.
An important component of GA activity is the fleet mix of aircraft
based at the airport. Exhibit 3-3 presents a recent history of the
based aircraft fleet mix for BLI.
Bellingham International Airport Master Plan Update – June 2004
3-11Chapter 3: Forecast of Demand
Exhibit 3-3: Historical Based Aircraft
Type 19971 19982 19992 20003
Single-Engine 129 129 157 163
Multi-Engine/Turboprop 5 -- 5 7
Turbo Fan -- 3 3 3
Rotor 3 3 5 2
Ultralight 1 1 -- --
Total 138 136 170 175
1
Sources: Washington State Aviation System Plan, WSDOT Aviation Div., 1998
2
Bellingham International Airport Records
3
Current FAA form 5010
Military Activity
Between 1985 and 2000, military operations increased 60 percent
from 842 to 1,347. Operations peaked in 1998 with nearly 1,850
2,000
1,800
1,600
1,400
1,200
takeoffs and landings before declining to current levels. Even so,
1,000
800 the average annual growth rate for military operations through the
600
400
200
end of the reporting period was approximately 3 percent.
-
1985 1990 1995 2000
As with GA, military activity is classified as itinerant or local
Military operations increased
nearly 60 percent and grew at an depending on the nature of the operation. Itinerant operations
average annual rate of 3 percent. constituted, on average, 68 percent of the total military operations
logged at the airport. However, although total military operations
increased over time, the relative percentage of itinerant operations
showed a clear decline. This suggests a trend to increased local
military training activity over flight operations beyond the airport
area.
Air Charter Activity
The classification system used by the FAA in its Terminal Area
Forecasts aggregates air charter activity into the air taxi/commuter
category for aircraft of 60 seats or less. The FAA does not have a
category for charter operations by larger aircraft of more than 60
seats. At BLI, Casino Express operates charter flights to gambling
destinations using Boeing 737-series aircraft.
Bellingham International Airport Master Plan Update – June 2004
3-12Chapter 3: Forecast of Demand
In year 2000, Casino Express carried over 15 percent of the
enplaned BLI passengers making it the third largest passenger
carrier at the airport ranked only behind Horizon Air and United
Express/Skywest. Over the past five years, Casino Express has
carried an average of 4.5 percent of the enplaned passengers at the
airport. As a result, enplaned passenger and operations forecasts
for BLI must take into account the contribution to activity by the
large destination-charter operators at the airport.
3.4.4 Freight and Mail
Based on the most recent activity data available from BLI, in the
five-year period since 1996, 15 separate carriers have, at various
times, engaged in providing freight and mail service. Six of those
carriers are dedicated freight operators, the remaining are
passenger and air taxi service providers carrying freight in the
cargo compartment of the passenger aircraft. By 2000, nearly 85
percent of all enplaned and deplaned freight was carried by three
carriers, Empire Airlines/FedEx, Ameriflight Inc., and Horizon
Air. Overall, 60 percent of freight moved on dedicated freight
carrier aircraft while approximately 40 percent moved on
passenger aircraft. Over the past five years, freight volumes have
declined slightly, particularly in 1998 and 1999; however, volumes
began to recover again in 2000. Total enplaned/deplaned freight
volumes are presented in Exhibit 3-4.
During the past five years, a single carrier, Horizon Air,
transported all enplaned and deplaned mail. In contrast to the
decline in freight, mail volumes increased sharply in 1997 and
1998. By 1998, mail volumes were 66 percent higher than 1996
levels. However, they declined rapidly and by 2000, showed a net
increase of approximately 20.0 percent over 1996 levels for a
compound annual growth rate of approximately 4.0 percent.
Bellingham International Airport Master Plan Update – June 2004
3-13Chapter 3: Forecast of Demand
Exhibit 3-4: Historical Freight and Mail by Carrier Type (in pounds)
1996 1997 1998 1999 2000
Enplaned/Deplaned Freight
Passenger Carriers 1,989,788 1,704,443 1,161,859 1,271,434 1,524,971
Cargo/Freight Carriers 2,252,656 2,355,246 2,480,166 2,351,544 2,299,021
Total Enplaned/Deplaned Freight 4,242,444 4,059,689 3,642,025 3,622,978 3,823,992
Enplaned/Deplaned Mail
Passenger Carriers 21,241 29,847 35,276 30,183 25,788
Cargo/Freight Carriers 0 0 0 0 0
Total Enplaned/Deplaned Mail 21,241 29,847 35,276 30,183 25,788
Source: Bellingham International Airport Records
3.4.5 Socioeconomic Trends
The Bellingham/Whatcom County area offers a diverse economy
able to capitalize upon its location situated between the
Seattle/Puget Sound region and Vancouver, British Columbia.
According to figures published by the Washington State Office of
Financial Management/Forecasting, between 1990, and 2000,
Whatcom County population increased 28 percent from
approximately 128,000 to 164,000, for a compound annual growth
rate of over 2 percent per year. The Bellingham & Whatcom
County Economic Development Council reports over 2 million
people currently live within a 50-mile radius of the county.
Bellingham and Whatcom County offer a well-educated work
force with three institutions of higher learning including Western
Washington University, the State’s third largest university,
Whatcom Community College and Bellingham Technical College.
Student enrollment at the three institutions is approximately
21,000.
The Bellingham/Whatcom County area offers a variety of
transportation options. Interstate highway access via I-5
(north/south) runs through the area and major east/west highways
are accessible immediately north of the U.S./Canada border and
via Highway 2 and I-90 to the south. Air transportation service is
Bellingham International Airport Master Plan Update – June 2004
3-14Chapter 3: Forecast of Demand
available locally at BLI, as well as at major air carrier airports in
Seattle and Vancouver, B.C. Water transportation is available by
the Port of Bellingham’s link to the Alaska Marine Highway
system, other Port facilities, as well as the ports of Seattle and
Vancouver, B.C. Lastly, rail carriers serving the community
include Amtrak passenger service, Burlington-Northern, Santa Fe,
and, Canadian Pacific and Canada Rail across the U.S./Canada
border.
The local economy consists of older mature industries such as
agriculture, timber and fishing, combined with rapidly growing
new industries including:
• Engineering, research and related services
• Electronic equipment and components
• Computer equipment and software
• Transportation equipment
• Measuring and controlling devices
• Transportation services and distribution
• Communications
• Sports and recreation products
• Business services
• Educational services
• Health services
Bellingham/Whatcom County employment, by industry type, is
presented in Exhibit 3-5. As is apparent from the information,
retail trade employs the highest percentage of the area workforce at
over 24 percent. This is consistent with the high level of retail
activity in the area resulting from Canadian shoppers traveling
from the Vancouver, B.C. area to take advantage of local U.S.
retail outlets.
Bellingham International Airport Master Plan Update – June 2004
3-15Chapter 3: Forecast of Demand
Exhibit 3-5: Percentage of Employment by Industry Type
Industry Type Percentage of Employment
Agriculture & Fishing 4.4%
Mining 0.2%
Construction 6.8%
Manufacturing 14.5%
Transportation & Utilities 4.0%
Wholesale Trade 4.2%
Retail Trade 24.3%
Finance, Insurance & Real Estate 3.6%
Services 23.5%
Government 14.5%
Total 100.00%
Source: Bellingham & Whatcom County Economic Development Council,
November 2001
Three common socio-economic indicators used in forecasting
passenger activity include population, employment and per capita
income. Experience has shown that these three indicators provide
insight into the financial strength and well-being of the local
economy and often correlate closely to the level of passenger
activity and aircraft ownership and operation at a given airport. A
brief historical overview of each of these indicators for the
Bellingham/Whatcom County area is presented below.
Population
400,000
Long-term population projections for Bellingham and Whatcom
350,000
300,000
County anticipate continued growth. The Washington State Office
250,000
200,000
of Financial Management/Forecasting (OFM) projects Whatcom
150,000
100,000
County population to reach 204,000 by 2010 and grow as high as
50,000 247,000 by 2020. The OFM population forecasts assume a
-
1980 1990 2000 2010 2020 2030 2040 2050
compound annual growth rate of approximately 2.0 percent –
Based on Washington OFM consistent with historic trends.
growth rate assumptions,
Whatcom County population
could more than double by Assuming population growth continues at the same 2.0 percent
2050. annual rate beyond 2020, Whatcom County population could be
Bellingham International Airport Master Plan Update – June 2004
3-16Chapter 3: Forecast of Demand
expected to reach nearly 370,000, more than double over 2000
levels by the end of the 50-year forecast horizon.
Employment
Bellingham and Whatcom County top 50 privately owned
companies ranked by revenue, and their respective employee levels
are presented in Exhibit 3-6, on the next page.
During the 1990’s, Whatcom County employment increased by
approximately 25.0 percent from 57,804 in 1990 to 71,993 by the
end of the decade, or 2.2 percent annually. Although long-term
employment forecasts for Whatcom County through the end of the
planning period are not available, the statistical correlation
between past County population and employment is very strong.
Given that long-term population forecasts are available, this strong
correlation could be useful in the forecasting effort.
Per Capita Income
Over the 10-year period between 1990 and 1999, per capita income
in Whatcom County increased nearly 34.0 percent compared to a
19.0-percent increase statewide during the same period. Locally,
per capita income grew at an annual rate of approximately 3.0
percent, significantly above the 1.7-percent annual growth rate for
Washington State as a whole.
Whatcom County per capita income growth correlated well with
County employment and population levels with r2 values of 0.94
and 0.93 respectively.
Bellingham International Airport Master Plan Update – June 2004
3-17Chapter 3: Forecast of Demand
Exhibit 3-6: Top 50 Privately Owned Companies (by Revenue)
Rank Company Business Type Employees
1 Haggen, Inc. Food Retail 4000
2 Brown & Cole, Inc. Food Retail 2500
3 Trillium Corp. Property Developer 587
4 Jerry Chambers Car Dealership 102
5 Exxel Pacific Inc. Construction 50+
6 Bellingham Marine Industries Marine/Dock Construction 200
7 Ryzex Group Remanufacture comp. 200
8 Dawson Construction Construction 100
9 Diehl Ford Inc. Car Dealership 95
10 Yorkston Oil Petroleum Products 60
11 Homestead Northwest Residential Developer 156
12 Bornstein Seafoods Seafood Processing 50
13 Impero Contracting Contractor 70
14 Whatcom Farmers Coop Farm Equip., supplies 100
15 Roger Jobs Motors Car Dealership 36
16 Exports of Wash., Inc. Investment Co. 260
17 Keith Oil Co. Fuel Distributor/retailer 10
18 Diamond B Constructors Construction 75
19 Wilson Motors, Inc. Car Dealership 45
20 Bellingham Chrysler Car Dealership 51
21 Pioneer Ford Car Dealership 34
22 Seafood Producers Cooperative Wholesale Seafoods 50
23 Haskell Corp. Industrial Construction 200
24 American Cordage Group Marine Supplies 300
25 Dealer Info. Systems Computer Products 140
26 Barleans Organic Oils, Co. LLC Food Products 50
27 Import Motors Car Dealership 50
28 Dewey Griffin Car Dealership 52
29 Alpha Technologies Mgmt Consulting/Eng. 275
30 Farmers Equipment Co. Farm & Garden Mach. 60
31 Allsop, Inc. Computer Accessories 150
32 Madrona Medical Group Medical Services 281
33 Ebenal General Construction 60
34 Yamato Engine Spec. Motor Vehicle Parts 110
35 Nielson Bros. Timberland Development 75
36 Sound Beverage Distributors Wholesale Beverages 65
37 ALRT Corporation Timberland Dev. 71
38 Grizzley Industrial Inc. Manufacturing 300
39 Hoksbergen Hay Hay/Straw Wholesaler 50
40 Redden Marine Supply Comm. Fishing Supplies 50
41 Sea K Fish Co., Inc. Seafood Processor 75
42 TranSmart Petroleum LLC Wholesale Petroleum Products 24
43 Edaleen Dairy Products Wholesale Dairy Products 56
44 Sauder Mouldings Inc. Manuf. Wood Moldings 120
45 IMCO General Construction Construction 60
46 Elenbaas Co. Inc. Farm Product Manuf. 50
47 Stargate Telecom. Communications 200
48 Rain Cap Inc. Retail/Install Truck Canopies 8
49 Apache Aerospace Inc. Wholesale Precision Tools 5
50 Walton Beverage Co. Soft Drink Manufacturer 80
Source: "Whatcom County's Top Private 50: Top 50 Firms Make Major Impact in County," - Whatcom County Business Pulse,
May 2001
Bellingham International Airport Master Plan Update – June 2004
3-18Chapter 3: Forecast of Demand
3.4.6 Previous Forecasts
There are two sources of existing forecasts for Bellingham
International Airport. The most recent Master Plan Update for BLI
was completed in 1997. The Plan Update included 20-year
forecasts for passengers, aircraft operations and cargo beginning
with 1995 as the base year and extending through 2015. In
addition, FAA Terminal Area Forecasts (TAF) are available for
BLI. The TAF forecasts are based on FAA’s national modeling
and include years 2000 through 2015, with historical activity
through 1999.
1997 Master Plan Update
The general conclusions of the 1997 Master Plan Update
forecasting effort are summarized below:
• Passengers: Passenger levels would continue to grow over
time, however the rate of growth would slow compared to
previous years. The overall growth rate for combined enplaned
and deplaned passengers between 1995 and 2015 was 3.6
percent annually.
• Aircraft Operations: Operations would increase 37.0 percent
between 1995 and 2015, yielding an annual growth rate of 1.5
percent
Bellingham International Airport Master Plan Update – June 2004
3-19Chapter 3: Forecast of Demand
• Air Cargo: Cargo volumes were anticipated to grow from
4,800 tons in 1995 to 13,200 tons, a 275.0 percent increase
over 1995 levels.
Exhibit 3-7 presents a summary of the 1997 Master Plan Update
forecast numbers.
Exhibit 3-7: Summary of 1997 Master Plan Update Forecasts
Ave.
1995 Ann’l
2000 2005 2015
(actual) Growth
Total Passengers (Enplaned + Deplaned)
Scheduled Carrier Passengers 212,525 318,000 358,800 448,500 3.8%
Charter/Air Taxi Passengers 48,107 72,000 81,200 101,500 3.8%
Total Passengers 260,632 390,000 440,000 550,000 3.8%
Aircraft Operations
Air Carrier/Regional 14,322 18,500 19,300 20,900 1.9%
Cargo 2,760 3,200 3,640 4,500 2.5%
Air Taxi 4,328 4,610 4,770 5,170 0.9%
Charter 554 670 760 950 2.7%
General Aviation 59,655 68,100 72,100 80,500 1.5%
Military 1,754 1,800 1,800 1,800 0.1%
Total Operations 83,373 96,880 102,370 113,820 1.6%
Freight and Mail (Enplaned + Deplaned)
Passenger Carriers 417 640 710 870 3.7%
Cargo Carriers 4,359 5,510 7,220 12,290 5.3%
Total Freight and Mail 4,776 6,150 7,930 13,160 4.2%
Source: Bellingham International Airport Master Plan Update, 1997
Terminal Area Forecasts 1999 – 2015
The most recent published FAA Terminal Area Forecast (at the
time of this writing) provides historical activity through 1999 and
forecast projections for key elements of aviation activity from
2000 to 2015. The TAF forecasts are provided for individual
airports listed in the National Plan of Integrated Airport Systems
(NPIAS), based on a variety of factors including historical airport
market share as well as the FAA’s national aviation forecast
model. The TAF forecasts are unconstrained, i.e., the forecasts
Bellingham International Airport Master Plan Update – June 2004
3-20Chapter 3: Forecast of Demand
assume the airport and air traffic system can accommodate
whatever level of demand may be placed upon them. Exhibit 3-8
summarizes the most recent published TAF forecasts for BLI.
Exhibit 3-8: Terminal Area Forecasts – 1999 – 2015
Avg.
Category Actual Forecast Ann’l
1999 2000 2003 2007 2012 2015 Growth
Passenger Enplanements
Air Carrier 2,711 2,711 2,711 2,711 2,711 2,711 0.0%
Commuter 88,953 90,674 95,837 102,722 111,327 116,491 1.6%
Total Enplanements 91,664 93,385 98,548 105,433 114,038 119,202 1.6%
Operations
Itinerant:
Air Carrier 137 137 137 137 137 137 0.0%
Commuter/Air Taxi 22,008 22,030 22,096 22,185 22,295 22,362 0.1%
Total Commercial 22,145 22,167 22,233 22,322 22,432 22,499 0.1%
General Aviation 35,433 38,061 39,286 40,919 42,961 44,187 1.3%
Military 883 883 883 883 883 883 0.0%
Local:
General Aviation 21,951 26,343 27,627 29,438 31,868 33,422 2.5%
Military 464 464 464 464 464 464 0.0%
Total Operations 80,876 87,918 90,493 94,026 98,608 101,455 1.3%
Instrument Operations 17,898 18,483 18,725 19,058 19,486 19,752 0.6%
Source: FAA TAF Database. Fiscal Years 1999 to 2015, FAA-APO-00-7, December 2000
• Enplaned Passengers: Enplaned passengers are projected to
grow at a consistent compound annual rate of 1.6 percent
between 1999 and 2015. By 2015, enplaned passengers are
expected to reach over 119,000, representing a 30 percent
increase over 1999 levels. Air taxi and commuter aircraft are
forecast to capture 97 to 98 percent of the enplaned passenger
traffic throughout the forecast period.
• Aircraft Operations: TAF forecast project operations
increasing 25 percent between 1999 and 2015, increasing from
Bellingham International Airport Master Plan Update – June 2004
3-21Chapter 3: Forecast of Demand
approximately 81,000 in 1999, to over 101,000 in 2015. The
compound annual growth rate for total aircraft operations over
the forecast period is 1.3 percent
FAA Aerospace Forecasts
In addition to the Terminal Area Forecast cited above, the FAA
prepares additional longer term forecasts of aviation activity to
provide information to state and local authorities, the aviation
industry, and the general public. The latest versions of these
forecast are the FAA Aerospace Forecasts - Fiscal Years 2001-
2012, and FAA Long-Range Aerospace Forecasts – Fiscal Years
2015, 2020 and 2025 which project that the national and global
economies will continue to grow and have positive impacts on the
aviation industry.
Between 1993 and 2000, commercial air carrier passenger
enplanements in the United States experienced an average annual
growth rate of 4.5 percent. The domestic regional airlines
continued to expand rapidly during this time frame with an average
annual growth rate in enplanements of 7.1 percent compared to 4.1
percent for larger air carriers. Worldwide, the average annual
enplanement growth rate from 1993 through 1999 was recorded at
5.3 percent.
Between 2000 and 2012, FAA forecasts project enplanements by
U.S. carriers to grow at the following average annual rates:
• Domestic air carrier enplanements – 3.6 percent average annual
growth from 2000 to 2012 and 3.7 percent from 2013 to 2025.
• Domestic regional carrier enplanements – 5.7 percent average
annual growth from 2000 to 2012 and 4.2 percent from 2013 to
2025.
• International enplanements – 5.3 percent average annual
growth from 2000 to 2012 and 4.7 percent from 2013 to 2025.
• Total enplanements worldwide – 3.8 percent average annual
growth.
Bellingham International Airport Master Plan Update – June 2004
3-22Chapter 3: Forecast of Demand
According to the FAA, the North American air cargo market has
grown more than 50 percent since 1990, with most of the growth
occurring in the integrator/express sector. In 2000, the total
number of air cargo revenue ton-miles (RTMs) flown by U.S.
commercial carriers increased by 6.7 percent. Long term, FAA
forecasts for air cargo growth rates are as follows:
• Domestic air cargo RTMs – 5.0 percent average annual growth
from 2000 to 2012, dropping to 4.8 percent annual growth
between 2013 and 2025.
• International air cargo RTMs – 6.7 percent average annual
growth between 2000 and 2012 and 5.0 percent growth
annually from 2013 to 2025.
Between 1995 and 2000, total U.S. annual aircraft operations
increased from 62.4 million to 68.7 million: The average annual
rates of increase were air carrier – 2.1 percent; commuter/air taxi –
1.0 percent and general aviation – 2.1 percent. FAA forecasts for
2000-2012 project the following average annual growth rates:
• Air carriers: 3.1 percent per year from 2000, to 2012 and 3.0
percent from 2013, to 2025.
• Commuter/air taxi: 2.4 percent per year from 2000, to 2012
and 3.0 percent from 2013 to 2025.
• General aviation: 2.3 percent per year from 2000, to 2012, and
3.0 percent from 2013, to 2025.
The U.S. economy expanded by 5.4 percent (GDP) in 2000. The
recent economic downturn prompted the Office of Management
and Budget (OMB) to revise short-term economic forecasts
downward prior to the publication of the FAA report. However,
the OMB believes the impact of the downturn will be limited to the
early years of the forecast and unlikely to impact the projected
long-term annual growth rate of 3.1 percent in the later years of the
forecast period. Additional economic forecasts contained in the
FAA Long-Range Aerospace Forecasts – Fiscal Years 2015, 2020
Bellingham International Airport Master Plan Update – June 2004
3-23Chapter 3: Forecast of Demand
and 2025, assume average annual GDP growth of 3.0 percent
between 2013 and 2025.
The FAA forecasts do not account for recent impacts on aviation
due to the September 2001, terrorist attacks on the U.S. However,
as discussed later under Section 3.6.4, the industry is expected to
recover within approximately two years, barring further terrorist
incidences. As a result, the FAA long-term forecast is helpful
given the 50-year forecast horizon of this Master Plan Update.
Comparison with the Previous Forecast
A comparison of 1997 Master Plan Update passenger and
operations forecasts are presented in Exhibit 3-9, along with the
average annual compound growth rates implied by the forecast
numbers.
Exhibit 3-9: 1997 Master Plan/TAF Forecast Comparison
Ave. Ann’l
2000 2005 2015 Growth
Enplaned Passengers
1997 Master Plan Update1 195,000 220,000 275,000 3.8%
Terminal Area Forecasts 1999 – 2015 93,385 101,990 119,202 1.6%
Total Aircraft Operations
1997 Master Plan Update 96,880 102,370 113,820 1.6%
Terminal Area Forecasts 1999 – 2015 87,918 92,245 101,455 1.3%
Source: FAA TAF Database. Fiscal Years 1999 to 2015, FAA-APO-00-7, December 2000
Bellingham International Airport Master Plan Update, 1997
1
Calculated based on 50 percent of projected total enplaned/deplaned passengers.
Bellingham International Airport Master Plan Update – June 2004
3-24Chapter 3: Forecast of Demand
Significant differences exist between the 1997 Master Plan Update
and TAF passenger forecasts. The 1997 Master Plan Update relied
on activity data through year-end 1995. As noted earlier, between
1985 and 1995, BLI had experienced more than a three-fold
increase in passenger traffic and an average annual compound
growth rate of nearly 8 percent. The 3.8 percent average annual 300,000
growth rate used in the 1997 Master Plan Update was consistent 250,000
200,000
with the FAA rate nationally at the time. This lower rate most 150,000
likely appeared quite conservative given historical passenger 100,000
50,000
growth. -
1999 2000 2005 2015
Actual TAF 1997 MP
Between 1996 and 1999, BLI experienced a substantial decline in
1997 BLI MasterPlan Update
passengers before rebounding in 2000 (see Historical Air Service passenger forecasts significantly
discussion below). The effects of this decline are reflected in the exceed passenger projections in the
FAA TAF 1999-2015.
TAF forecasts for BLI, which use the lower 1999 passenger figures
as their starting point. Furthermore, the significantly lower annual
growth rate for BLI enplanements used in the TAF, i.e., 1.6 percent
versus 3.8 percent used in the 1997 Master Plan Update, results in
a more pronounced difference between the forecasts farther into
the future.
150,000
125,000
Total operations forecasts track more closely between the 1997 100,000
75,000
Master Plan Update and TAF Forecasts than enplaned passenger 50,000
projections. Annual growth rates used in the two forecast 25,000
-
documents compared more favorably with 1.6 percent in the 1997 1999 2000 2005 2015
Master Plan Update compared to 1.3 percent in the TAF. The
Actual TAF 1997 MP
Total aircraft operations forecasts
more similar growth rate projections, combined with the lower between 1997 BLI Master Plan
degree of variability in the overall operations numbers in recent Update and the FAA TAF 1999-
years combine to yield forecasts that remain within 10 to 12 2015 projections vary by only 10
to 12 percent over the forecast
percent of each other through the end of the forecast period. period.
Bellingham International Airport Master Plan Update – June 2004
3-25Chapter 3: Forecast of Demand
3.5 HISTORICAL AIR SERVICE
PERSPECTIVE
Commercial airline activity has been available at the BLI for more
than 20 years. Exhibit 3-10 shows the enplaned passenger levels
recorded from 1979 through 2000, by the airport.
Exhibit 3-10: Historical Enplaned Passenger Levels
Year Passenger Level Year Passenger Level
1979 18,966 1990 109,996
1980 18,634 1991 128,212
1981 6,600 1992 118,871
1982 18,277 1993 151,718
1983 17,484 1994 133,631
1984 22,890 1995 126,037
1985 33,698 1996 123,065
1986 64,464 1997 111,558
1987 81,870 1998 94,084
1988 108,373 1999 91,664
1989 87,376 2000 113,925
Source: FAA TAF, Bellingham International Airport Records
As shown, passenger levels have grown substantially over the
period with the highest levels being recorded in 1993 when a peak
level of 151,718 passengers was enplaned. In the meantime,
several trends have been recorded that need to be explained.
Enplaned passenger levels in Bellingham began to increase in
1984. Prior to this date, all passenger service at Bellingham was
offered by regional or commuter airlines operating aircraft with
fewer than 19 seats. This began to change in late 1984 and 1985,
corresponding with the opening of Expo. in Vancouver, British
Columbia. By fall of 1985, Bellingham was served by Pacific
Southwest Airlines [(PSA) now US Airways] using McDonnell
Douglas DC-9/MD-80 aircraft. The PSA flights operated between
Bellingham and Seattle-Tacoma International Airport (Sea-Tac).
Bellingham International Airport Master Plan Update – June 2004
3-26Chapter 3: Forecast of Demand
In 1989, Alaska Airlines began operating three flights per day
between Bellingham and Sea-Tac using MD-82 aircraft. In
addition to these flights, Bellingham was also being served by
regional carriers using smaller (less than 30 passenger) aircraft.
By 1993, USAir decided to eliminate many of its West Coast
operations and announced that it would suspend the
Bellingham-Seattle service. At the same time, Alaska Airlines
decided to eliminate service, allowing Horizon Air to increase their
operations. At this point, passenger volumes began to decline.
Other factors have been cited as being important considerations in
any analysis of these passenger enplanement trends. Included are
the relative strength of the regional, state and national economy,
the state of the airline industry at-large and the impact of the
Canadian traveler. Anecdotal evidence suggests that a portion of
the passenger levels recorded from 1994 through 1998 can be
traced to congestion at Vancouver International Airport resulting
from the terminal modernization and construction programs
occurring at that time.
3.5.1 BLI Air Service Catchment Area
The level of travelers using BLI has greatly fluctuated over the
past two decades (see Section 3.4.2). The airport’s geographic
location between two major metropolitan areas, Seattle,
Washington and Vancouver, British Columbia, serves to be both
advantageous and disadvantageous. The population living in the
expanding metropolitan areas contribute to the use of BLI along
with residents of Whatcom County; however, the international
airports in Seattle (SEA) and Vancouver (YVR) detract from use
of BLI by drawing travelers with greater choice of destinations and
flight frequency. It has been estimated that YVR and SEA draw
Bellingham International Airport Master Plan Update – June 2004
3-27Chapter 3: Forecast of Demand
approximately 60 percent, or approximately 300,000 passengers,
away from using BLI1. Several reasons for this are:
• Lower fares
• More flight options
• Convenience – shorter layovers, fewer plane changes
• Frequent flyer programs
• Jet preference.
These circumstances will continue to impact BLI as long as
airlines provide service that is cost-conscious, efficient and
convenient, i.e., short lines for check-in, security processing, and
bag-claim, at the larger airports. Another influencing factor is the
population’s perception of ease with which they can access the
airport from their resident locations (ground travel). Traffic
congestion along the I-5 corridor north of Seattle could enhance
BLI’s position in the region’s air service market. It is primarily
within these fundamental conditions that the level of air passengers
utilizing BLI will be realized.
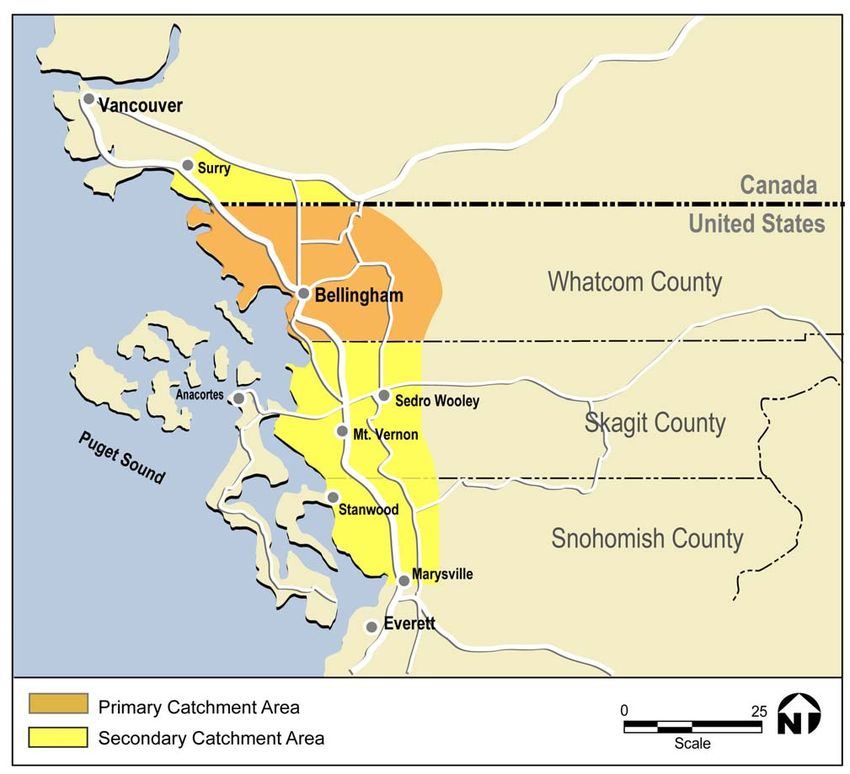
Examples of the expanding geographic market areas for BLI
include the Surrey B.C. area, which has recently been one of the
fastest growing areas in North America. BLI is closer to this
population center than is Vancouver International Airport. The
expansion of the Seattle metropolitan area northward into the
communities of Marysville and Stanwood, which are closer to BLI
than SEA, are part of the growing catchment area of BLI. This
represents a population base of approximately 500,000 additional
residents from which BLI might draw.
In a recent report prepared by the Port of Bellingham (see
footnote), BLI’s core catchment area population was estimated at
291,000 (1998), extending throughout Whatcom County. The
report estimated the potential one-way passenger market of BLI in
1 Port of Bellingham, Bellingham International Airport, air service study
prepared in 1998
Bellingham International Airport Master Plan Update – June 2004
3-28Chapter 3: Forecast of Demand
the range of approximately 400,000 to 470,000 passengers, and
ranked the BLI catchment just below that of Boise (494,000) and
Spokane (627,000), but above that of Medford (289,000), Yakima
(233,000), Pasco (225,000), and Missoula (159,000).
In the remaining sections of this chapter, analyses will be
conducted to test the relationships cited, where sufficient historical
data is available. In other cases, no testing is possible. It is
therefore important to keep some of these aforementioned factors
in mind as decisions are being made regarding selection of
preferred forecasts from the range of projections.
The air service and estimated catchment area for BLI is depicted in
Exhibit 3-11.
Bellingham International Airport Master Plan Update – June 2004
3-29Chapter 3: Forecast of Demand
Exhibit 3-11: Catchment Area
Bellingham International Airport Master Plan Update – June 2004
3-30Chapter 3: Forecast of Demand
3.6 AIRLINE ACTIVITY
FORECASTS
3.6.1 Introduction
To determine the appropriate size and characteristics of passenger
service facilities at BLI, it is necessary to gain an idea of the future
activity levels that may occur. Two basic indicators are commonly
forecast in this category: annual passengers and annual airline
operations. From these basic activity segments forecasts of peak
activity can be deduced.
When preparing forecasts of passenger activity for an airport, it is
common practice to concentrate on those passengers boarding
aircraft and departing from the facility. These are commonly
referred to as enplaned passengers or enplanements. Once the
number of enplanements is forecast, they are used to determine the
future requirements for terminal facilities, access and parking, and
other passenger-oriented facilities. Typically, numbers of arriving
or deplaned passengers are assumed to equal enplaned passengers.
Therefore, the total number of passengers moving through the
airport is calculated as two times the enplaned passengers.
3.6.2 Current Service Levels
Historical data relative to passenger activity levels at BLI have
already been presented. Existing scheduled passenger service as of
late-2001 is discussed below.
Flights from BLI link passengers to the national airport system
primarily via Seattle-Tacoma International Airport, with
connecting service throughout the U.S. and abroad. According to
flight schedules published in the Official Airline Guide (October
2001), limited direct scheduled service is also available to
Eastsound and Friday Harbor, Washington.
Bellingham International Airport Master Plan Update – June 2004
3-31Chapter 3: Forecast of Demand
In recent years, the two key scheduled air carriers serving BLI and
carrying the majority of passengers were Horizon Air and United
Express. In 2000, Horizon Air and United Express/Skywest
carried 60 percent and 20 percent, respectively, of all enplaned
passengers at BLI. Through October 2001, the combined flight
schedule of the two carriers included nine daily weekday direct
flights to Sea-Tac International Airport. By November 2001,
United Express/Skywest discontinued all service at Bellingham
while Horizon Air continued to operate five daily weekday arrivals
and departures.
West Isle Air provides additional scheduled service at the airport to
Eastsound and Friday Harbor in the San Juan Islands. West Isle
Air operates four flights daily weekdays to/from the San Juan
Islands.
Exhibit 3-12 shows the Consolidated Flight Schedule of all
scheduled aircraft arrivals and departures at the airport as of
November 2001. Due to the current aviation environment, there
may be considerable variation in scheduled flight operations over
time and it should be anticipated that this schedule would change
during the course of the Master Plan Update.
Bellingham International Airport Master Plan Update – June 2004
3-32Chapter 3: Forecast of Demand
Exhibit 3-12: Scheduled Passenger Service
Carrier
Time City From City To Flight No. Equip Type Freq. Arr. Seats Dep. Seats
Code
5:20 a.m. SEA QX 2197 DH8 X7 37
7:00 a.m. ESD/FRD W6 295 CNA X7 5
7:59 a.m. SEA QX 2232 DH8 X7 37
8:20 a.m. SEA QX 2271 DH8 D 37
9:00 a.m. FRD/ESD W6 300 CNA D 5
9:00 a.m. ESD/FRD W6 305 CNA X67 5
10:40 a.m. SEA QX 2068 DH8 D 37
11:15 a.m. FRD/ESD W6 310 CNA D 5
11:00 a.m. SEA QX 2097 DH8 D 37
12:15 p.m. ESD/FRD W6 305 CNA 67 5
1:15 p.m. SEA QX 2146 DH8 D 37
1:35 p.m. SEA QX 2099 DH8 D 37
2:15 p.m. FRD/ESD W6 330 CNA D 5
3:15 p.m. SEA QX 2267 DH8 D 37
3:35 p.m. SEA QX 2137 DH8 D 37
4:00 p.m. ESD/FRD W6 335 CNA D 5
5:00 p.m. FRD/ESD W6 340 CNA D 5
5:10 p.m. SEA QX 2110 DH8 D 37
5:30 p.m. SEA QX 2217 DH8 D 37
7:30 p.m. SEA QX 2158 DH8 D 37
7:55 p.m. SEA QX 2015 DH8 D 37
10:40 p.m. SEA QX 2162 DH8 X6 37
Sources: Alaska Airlines flight schedule, November 2001
West Isle Air flight Schedule, November 2001
Legend:
City Codes Air Carriers Equipment Type
SEA Seattle-Tacoma QX Horizon Air DH8 Dash 8
FRD Friday Harbor W6 West Isle Air CNA Cessna 206
ESD Eastsound
Bellingham International Airport Master Plan Update – June 2004
3-33Chapter 3: Forecast of Demand
3.6.3 Forecast Methodologies
Preparing the aviation demand forecasts for use in the Airport
Master Plan Update is a two-phase process. The first is the
analytical phase, which involves applying statistical techniques to
historical data to establish a basis for modeling future growth. The
second or subjective phase, adds experience, knowledge, and other
non-mathematical valuation to the process. The combination of
techniques is essential to the development of a final preferred
forecast.
For the analytical phase, past trends in the aviation demand
elements are extended into the future using a variety of techniques
and assumptions. The products of these analyses are trend lines,
which produce projections for specific time periods. A number of
projections are developed since the most reliable approach to
estimating demand is often obtained using more than one
technique. Methodologies that are commonly employed include
correlation and regression analyses, time series extrapolation (trend
data), and market share analyses.
• In a Regression Analysis, projections of an aviation demand
element (the dependent variable) are prepared based on one or
more outside indicators, such as population or other
socioeconomic factors (the independent variables). Historical
values for both the dependent and the independent variables are
tested using correlation analyses to determine whether a
relationship exists. If it is determined that there is a
relationship, it can be used to define future aviation activity
levels based on a continuation of the relationship into the future
using forecasts of the independent variables prepared by others.
• A Time-Series Analysis can be a means of establishing any
trends that are evident in the demand category without regard
to the reasons for the trend. This type of analysis is perhaps the
simplest, most widely used forecasting technique. It fits
Bellingham International Airport Master Plan Update – June 2004
3-34Chapter 3: Forecast of Demand
growth curves to historical data and extends them into the
future.
• Market-Share Analysis techniques involve a review of the
historical activity levels at the airport as a percentage share of a
larger market. This share factor is compared to forecasts for
the larger market to determine the likely future activity level.
These three analytical techniques share a common shortcoming.
They assume that relationships that existed in the past will
continue unchanged into the future. Consequently, they do not
allow for the effects of more aggressive marketing, increased
service levels, or other changes that are independent of past
indicators. Similarly, they do not permit the analysis of the impact
of point-in-time activity increases followed by resumption of
previous growth rates. To counter this weakness, the second phase
of forecasting involves a judgmental analysis. During this phase,
decisions are made regarding the growth projections resulting from
the analyses of each demand element. These decisions require that
a number of intangible factors, such as policy and objective
changes, be considered. The forecast team adds these elements to
the process using experience at other airports, industry trends,
knowledge of the aviation community, and other information
gathering techniques that may be available. Despite all of these
efforts, the level of confidence in forecasts that extend beyond five
years should be minimal, and the numbers generated during the
forecast effort should be used as guides rather than absolutes.
Forecast Model Verification
Before a forecast model can be relied upon as a basis for projecting
future activity, it must pass certain statistical tests verifying that a
legitimate relationship exists between the dependent and
independent variables used in each particular model.
The correlation coefficient (Pearson’s ‘r’) and coefficient of
determination (r2) measure the strength of the association between
Bellingham International Airport Master Plan Update – June 2004
3-35You can also read