MASTER PROJECT Implications of market rating-based segmentation on intra-platform competition: An application to Airbnb's market in Barcelona ...
←
→
Page content transcription
If your browser does not render page correctly, please read the page content below

MASTER PROJECT

     Implications of market rating-based
 segmentation on intra-platform competition:
An application to Airbnb’s market in Barcelona

       Master’s Degree in Specialized Economic Analysis:
        Competition and Market Regulation Program

                          Authors:

                         Paul Arenas
                         Saúl Paredes

                Supervised by Miguel Espinosa

                          June 2021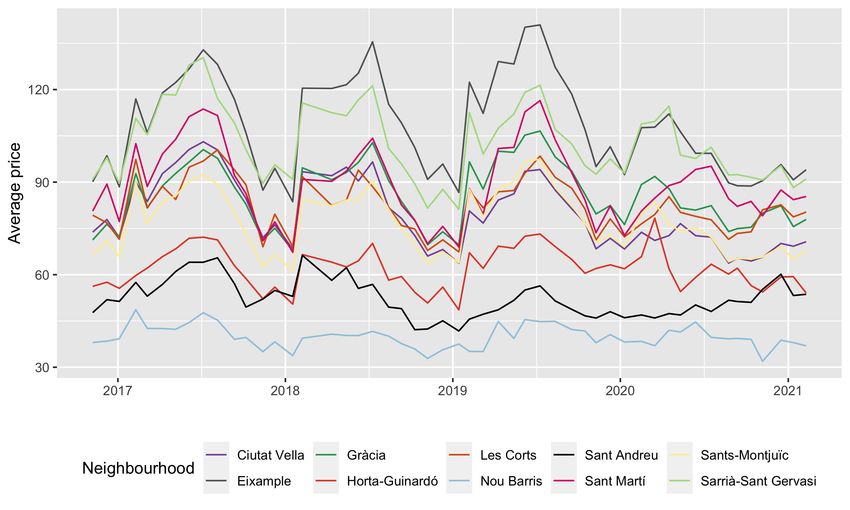
Implications of market rating-based segmentation
                     on intra-platform competition:
     An application to Airbnb’s market in Barcelona

                    Paul Arenas                                   Saúl Paredes

                                           Master Project
                            Barcelona Graduate School of Economics
                                              June 2021

                                               Abstract

In recent years, large platforms have raised concerns that they may engage in anti-competitive practices
that affect market competition. Therefore, analyzing the competition structure inside platforms is a
relevant issue that has not been treated in many empirical research. This study analyzes how a plat-
form’s owner could affect the degree of competition among members of one group in the platform
through biasing search results using rating classifications. In this paper, we perform an application
to Airbnb’s market in Barcelona given the particularity of rating is an unavailable searching filter to
guests. We found evidence that listing’s rating classification represents an important market segmenta-
tion in the Airbnb’s market in Barcelona that could imply a possible practice of biasing search results.
Moreover, we found that the intensity of competition is differentiated by the rating-related segments,
which means that this segments are concentrating competition.

Keywords: platform competition, digital market, economics of sharing.

JEL Clasification:C13; C55; L15; L20; L40
Contents
   1   Introduction . . . . . . . . . . . . . . . . . . . . . . . . . .           2
   2 Airbnb’s Market in Barcelona . . . . . . . . . . . . . . . . . . .            3
   3 Literature Review . . . . . . . . . . . . . . . . . . . . . . . .            4
           3.1 Platform’s network effects and ratings . . . . . . . . . . . . .   4
           3.2 Intra-platform competition and ratings . . . . . . . . . . . .      5
        3.3 Airbnb’s scraped data in empirical studies . . . . . . . . . . .      7
   4 Model Specification . . . . . . . . . . . . . . . . . . . . . . .            8
           4.1 Logit model. . . . . . . . . . . . . . . . . . . . . . .           9
           4.2 Nested logit model . . . . . . . . . . . . . . . . . . . . 10
          4.3 Rating-based segmentation and biased search results . . . . . . . 10
   5 Data and Estimation . . . . . . . . . . . . . . . . . . . . . . . 11
           5.1 Data treatment. . . . . . . . . . . . . . . . . . . . . . 11
           5.2 Estimation . . . . . . . . . . . . . . . . . . . . . . . 12
         5.3 Identification . . . . . . . . . . . . . . . . . . . . . . 14
   6 Results . . . . . . . . . . . . . . . . . . . . . . . . . . . . 15
           6.1 Logit Models . . . . . . . . . . . . . . . . . . . . . . 15
           6.2 Nested Logit Models . . . . . . . . . . . . . . . . . . . 16
           6.3 Evaluating differences in level of competition . . . . . . . . . . 18
          6.4 Elasticities . . . . . . . . . . . . . . . . . . . . . . . 18
   7 Discussion. . . . . . . . . . . . . . . . . . . . . . . . . . . 19
           7.1 Conclusion . . . . . . . . . . . . . . . . . . . . . . . 19
         7.2 Limitations . . . . . . . . . . . . . . . . . . . . . . . 19
   8 Annex . . . . . . . . . . . . . . . . . . . . . . . . . . . . 21
   References . . . . . . . . . . . . . . . . . . . . . . . . . . . . 39

                                        1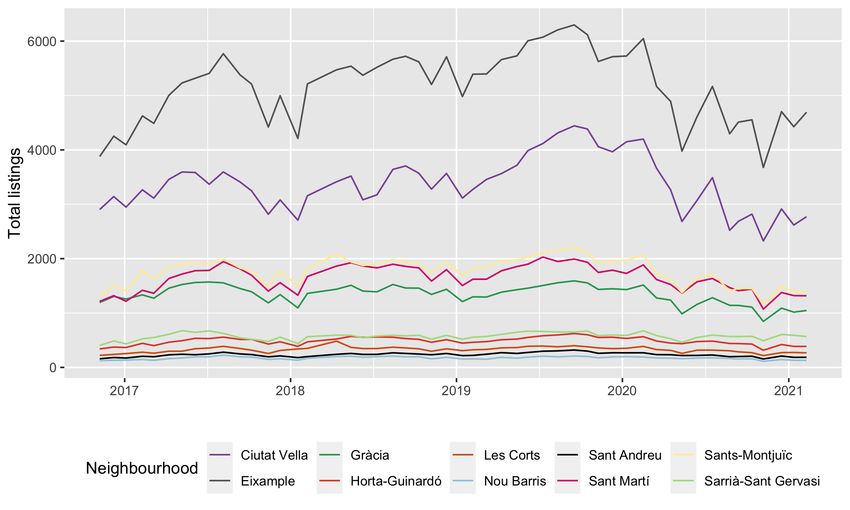
1       Introduction
Digitalization has encouraged platforms’ presence in diverse services such as hospitality, trans-
portation and entertainment, hence these platforms are playing a more important role in world-
wide economy. In particular, digital platforms such as Amazon. Airbnb, Facebook and Google
have increased their market share and expanded their operations.

These large platforms, in combination with their privileged ecosystem position, have raised con-
cerns that they may engage in anti-competitive practices that reduce innovation and consumer
welfare such as excessive prices, algorithmic pricing collusion and data use to establish non-price
discrimination (Parker et al. (2020)). Consequently, many empirical research have assessed the
competition between and within platforms (see Belleflamme and Peitz (2018b), Cennamo and
Santalo (2009), Jullien and Sand-Zantman (2021), and Kim et al. (2017)).

Regarding Airbnb, many empirical literature have focused on its effects on different markets
so, for instance, on hotels (Schäfer and Tran (2020)), rents (Duso et al. (2020)) and housing
(Garcia-López et al. (2020)). Nonetheless, analyze the competition structure inside platforms
is still a relevant issue that has not been treated in many empirical research.

Since platforms themselves are ecosystems of users, they can shape the competition among sell-
ers through quality. For example, platforms can choose how ratings influence the probability of
being seen by a buyer. This can generate concentration of competition among high-rated sellers.
(Charlson (2021)). This decision is one of the drivers of platforms’ profits, since platforms will
try to encourage visibility of high-rated sellers given the higher demand faced by them (Belle-
flamme and Peitz (2018b)), but, simultaneously, the increase in competition would lower the
prices and, ultimately, platforms’ revenues.

We will address whether rating classification represents a segmentation within a platform. Airbnb
is an ideal platform to explore it, since its filters do not allow users to discriminate listing un-
der this feature and, therefore, a rating segmentation could imply a possible practice of biasing
search results.

Additionally, Airbnb is a relevant1 case since it is the first and largest two-sided online platform
in the short-term rental market and they could have a greater impact in the future. Moreover, its
presence in Barcelona is important2 and it has been growing through time 3 . Also, the city itself is
relevant for tourism, since, according to the Statistical Institute of Catalonia, from 2010 to 2019,
    1
      According to ’See Transparent’ web page, it reaches nearly 5 millions listings with an exclusivity ratio higher
than 50% in most of the relevant cities in the world.
    2
      According to Datahippo website, Airbnb accounts for the majority of short-term rentals in Barcelona with
respect with its main competitors.
    3
      Airbnb’s listings in the city has been growing from 2015 to 2021, with an average increasing rate of 17.6%.

                                                         2
the number of visitors increased in 12.2% and Barcelona was the 6th most visited destination city
in Europe and 17th worldwide in 20184 .
We use monthly-level data of Airbnb’s listings in Barcelona to analyze how competition is shaped
by rating classification of rentals. Since we have information on location, type of listing and rat-
ing, we can allow for segmentation of the demand according with these variables.
Our main contribution is that we provide insight about competition within Airbnb’s hosts
(sellers), highlighting the importance of rating as a market segmentation within platform. We
found evidence that listing’s rating classification represents an important market segmentation
in the Airbnb’s market in Barcelona even though guests (buyers) can not filter their search re-
sults using this feature. Moreover, we found that the intensity of competition is differentiated by
the rating-related segments, in other words, the segments are able to concentrate intra-platform
competition.
The study is organized as follows. In Section 2, we describe Airbnb’s market in Barcelona.
In Section 3, we present literature related with rating effects, intra-platform competition and
Airbnb’s empirical studies. In Section 4, we describe the econometric models we used and the
link between those models and intra-platform competition. In Section 5, we discuss the variables
needed for model specifications. In Section 6, we explain the results and elasticities obtained.
Finally in Section 7, we discuss our conclusions and limitations.
2 Airbnb’s Market in Barcelona
Airbnb is the first and largest two-sided online platform in the short-term rental market world-
wide. Its business is focused in short-term rental services with some recent experience’s services.
Particularly, its revenue model consists in charging a service fee depending on total booking price
from each host and guest that use the service. Additionally, Airbnb has an algorithm focused
on search results and a pricing algorithm that recommends ’optimal’ prices to hosts.
Airbnb is highly demanded in Barcelona, in 2017, the city was the fourth most preferred desti-
nation in Europe for Airbnb users5 . Additionally, Barcelona is the sixth biggest city in the world
for Airbnb’s rentals6 . Moreover, from the end of 2016 to the middle of 2020, it has shown an
important increase in the number of listings offered in the city (see Figure 1 of Annex).
This supply is not proportional between listing types given majority of rentals are entire apart-
ments and private rooms, while shared and hotel rooms represent the smallest amount of list-
4
According to Mastercard’s Global Destinations Cities Index
5
According to information of Statista
6
According to Forbes
3ings in the city, this structure has been the rule, regardless of the time considered (see Figure 2 of
Annex). Similarly, the presence of Airbnb in neighborhoods has not been homogeneous, given
that majority of listings are gathered in Eixample and Ciutat Vella, meanwhile, Nou Barris and
Sant Andreu are neighborhoods with the least amount of rentals (see Figure 3 of Annex).
The incremental of listings has risen concerns in the city7 which has introduced regulations
that seek to limit the quantity of short-term rentals. Since 2011, Barcelona has required entire
apartments offered for short stays to have a license8 , in 2014, new licenses were frozen in central
Barcelona9 Two years later, Airbnb was fined with 60,000 euros for advertise apartments that
did not have license10 . While in 2018, the city introduced a host identification system to verify
whether apartments offered online were done so legally. And, in 2020, a temporary rule to ban
listing rentals for less than 30 days was imposed11 .
3 Literature Review
In this Section, we discuss relevant literature grouped in three categories: (i) studies who explore
ratings as a tool to improve platforms’ network effects; (ii) studies who analyze intra-platform
competition, its effects on platform’s owner incentives and, ratings’ capability to affect this type
of competition; and (iii) empirical studies who use Airbnb’s scraped data.
3.1 Platform’s network effects and ratings
In the literature, platforms are defined as services that create value from trade while coordinates
and facilitates economic or social exchange between distinct groups of consumers (Rochet and
Tirole (2003), Evans (2003), Belleflamme and Peitz (2018a), and Parker et al. (2020)). Regarding
value creation and business model, we can define roughly a two-sided platform as an economic
agent that enable interactions between end-users, and try to get the two sides “on board” by
appropriately charging each side; that is, a platform courts each side while attempting to make,
or at least not lose, money overall (Rochet and Tirole (2006)).
Network externalities (effects) arise when the utility that a user derives from consumption of
the good increases with the number of other agents consuming the good, likewise, there are
several possible sources of these externalities such as the presence of post purchase services and
developing of complementary services (Katz and Shapiro (1985))12 . Particularly, most markets
7
Nieuwland and Melik (2018), provides a relevant policy and research review related to the presence of Airbnb
in Barcelona.
8
According to Bloomberg
9
According to The Wall Street Journal
10
According to The Guardian
11
According to Bloomberg
12
According to Franck and Peitz (2019) network effects can be divided in two groups: (i) direct network effects
4with network effects are characterized for the presence of two sides who benefit from interacting
through a common platform (Rochet and Tirole (2003)). Also, in this markets, the benefit of
one group depends on the size of the other group that joins the platform (Armstrong (2006)).
From the above, platforms provide a number of services that generate so-called “network ef-
fects,” insofar as the attractiveness of a particular platform increases with the volume of interac-
tions that the platform manages (Belleflamme and Peitz (2018a)). This volume of interactions
will depend on the size of platform’s users and the platform’s capability to incentive its use
through commercial strategies and changes in the platform’s design.
Following this, Belleflamme and Peitz (2018a) analyze how reviews, ratings, and recommenda-
tions systems generate network effects on platforms. They argued the ratings and reviews can be
an important source of network effect since the more users that are active the better informed
other users are13 . Consequently, the authors establish that rating and review systems fuel self-
reinforcing mechanisms that make successful platforms even more successful since they generate
platform-specific network effects.
To sum up, the literature is certain about that the key for a successful platform is its capability to
generate positive network effects. Also, the literature shows that the rating and review systems
are able to increase the presence of network effects in platforms.
3.2 Intra-platform competition and ratings
Most of the relevant literature is focused on: (i) platform competition; (ii) cross group external
effects and platform’s attractiveness; and (iii) asymmetric pricing between platforms’ sides. Re-
garding platform competition, in the last 20 years, the literature is focused on analyzing how
platforms compete either within the market or for the market and the possibility that platform
competition will derive in a monopoly situation (Jullien and Sand-Zantman (2021)).
However, there are some literature that analyze the impacts of the degree of competition among
members of one group in the platform -which, for the purpose of this study, we called as ’intra-
platform competition’- on the platform outcomes14 . For instance, Belleflamme and Peitz (2018b)
study how a change in the degree of competition among sellers may affect platform’s pricing
which occur when the utility of a user depends on the decisions of other users and all of these users belong to a
group and, they can be negative or positive; and (ii) indirect network effects which occur when the benefit of a
user depends from increased participation of other users only because of the interaction with the participation (or
usage) decisions of another group of users.
13
As Belleflamme and Peitz (2018a) said product rating systems have the potential to solve asymmetric informa-
tion problems. Therefore, the quantity and quality of reviews and ratings increases with the numbers of users in
the platform.
14
Belleflamme and Peitz (2018b) relates this type of competition with the concept of negative within-group
effects which arise when the presence of additional sellers, given a fixed number of buyers, could affect the expected
profits of the sellers established in the platform
5strategy finding that the platform will maximize its profit when the total value of the transac-
tions between buyers and seller decreases with the intensity of seller competition.
Similarly, Galeotti and Moraga-González (2009) study how differentiated product sellers com-
pete for consumers within the platform, and how the platform’s owner should price its services
to maximize its profits (pricing strategy). Likewise, the effects of intra-platform competition
could affect user’s benefits. For instance, Belleflamme and Toulemonde (2016) shows that sell-
ers may be better off, and buyers worse off, in markets with more sellers (higher competition);
and, also, sellers and buyers may prefer full product differentiation while platforms may prefer
no differentiation which could affect product variety strategy by the platform owner.
Nonetheless, pricing and product variety strategies are not the only available tools by platforms’
owners to respond to changes on intra-platform competition. In particular, there are non-
pricing strategies such as product visibility and quality control15 that platforms’ owners can
exploit to influence the degree of intra-platform competition and, consequently, its outcomes
(Belleflamme and Peitz (2018b)).
With respect to product visibility, as we mentioned, platforms’ owners are interested in attract-
ing more users to platforms to increase network effects. Thus, they can use search engines to
guide consumers to products they like and generate more attractiveness to the platform (Belle-
flamme and Toulemonde (2016)). Therefore, platforms’ owners have the incentive to bias its
search results to obtain more profits either through generating more attractiveness or softer the
competition among sellers.
Regarding the latter, we would expect that the value of each seller will be reduced due to com-
petition which could affect the profits of the platforms’ owners (reduction of total transaction).
Therefore, platforms’ owners have the incentive to softer the competition which it is possible
through biasing search results.
In particular, biasing search results could imply that a buyer do not observe closer substitutes
sellers which would led to sellers do not face a high competition within the market. In the
literature, Chen and He (2011) and Eliaz and Spiegler (2011) show that search engines have an
incentive to decrease the relevance of their search results and, thus, discourages buyers from
searching extensively and softening the competition among sellers.
In this context, naturally, we wonder if platforms’ owners can bias search results using ratings.
Regarding this, Charlson (2021) states that since demand is higher for high quality products,
15
With respect to quality control, as Belleflamme and Peitz (2018b) states platforms may control the quality of
sellers and remove underperforming sellers from the platform. In the presence of seller competition this may come
at the cost of reducing competitive pressure.
6there is an incentive to increase the probability that highly-rated sellers are observed by biasing
search results towards them. However, biasing search results in this way results in competition
being more concentrated, reducing prices.
In conclusion, the degree intra-platform competition is able to affect platforms’ profits and the
well being of platforms’ users. In that sense, platforms’ owners have the incentive to influence
intra-platform competition through price and non-price strategies and, particularly, they could
use rating to bias product visibility and softer intra-platform competition. However, this deci-
sion will depend on the characteristics of the platform as Charlson (2021) states16 .
3.3 Airbnb’s scraped data in empirical studies
Recent studies have used Airbnb’s data with an exploratory objective, for instance, Sutherland
and Kiatkawsin (2020) use Airbnb’s reviews data from New York with a text processing tech-
nique to analyze topics of interests that drive customer experience. Also, Gyódi (2017) explore
Airbnb’s characteristics in Warsaw, finding that number of listings is higher in more attractive
parts of the city, which makes more difficult for locals to find a long-term rental in these areas.
Regarding demand analysis, the studies have focused on the elasticities of Airbnb’s short-term
rental, for example, Jiang and Yin (2020) use this data to estimate the demand in China, while
Gunter and Önder (2018) finds a price-inelastic demand for for Airbnb’s listings in Vienna.
Similarly, some research have relied on hedonic modelling techniques to estimate the determi-
nants of prices and revenues of Airbnb’s listings. For instance, Deboosere et al. (2019) account
for large neighbourhood effects on the prediction of both average price per night and revenue
generated by each listing in New York. Whereas for Spain, Lladós-Masllorens et al. (2020) find
that prices are best explained by guests’ preference for characteristics of the rental and for the
systematic interaction of valence and volume of online reviews.
Instead, several studies have used this kind of data to explore the impacts of platforms on rental
housing. Zou (2019) analyzes the implications in Washington, D.C.; and the results suggest
that having Airbnb establishments in the neighborhood can significantly inflate property prices,
which inequitably affect low income home buyers, since there is a uneven penetration of the
platform on neighborhoods. In parallel, Garcia-López et al. (2020) explore the effects of Airbnb
on housing rents finding that its activity has increased the latter. Similarly, Duso et al. (2020)
exploit policy changes in short-term rental regulation in Berlin finding that Airbnb’s presence
increases average monthly rents by at least seven cents per square meter. In Barcelona, Agustí
et al. (2020) have found that the platform has increased the rent prices, although, they do not
16
In Subsection 4.3, we explain in more detail the possible rating-based segmentation for Airbnb according to
Charlson (2021).
7obtain indication that Airbnb affects transaction prices.
Conversely, some research is centred in the effects of Airbnb on hotels, such as Schäfer and Tran
(2020), who use data for Paris to estimate a segmented demand of Airbnb listings. They con-
clude that Airbnb increases average consumer surplus due to the increase number of choices and
lower prices, although, the platform reduces average hotel revenues. While, Zervas et al. (2017)
analyzes the impact of Airbnb in the Texas hotel industry, showing an heterogeneous negative
effect of the platform on hotel revenues depending on hotel type, the impact is attributed to a
higher level of competition faced by hotel owners.
In contrast, Li and Srinivasan (2019) use Airbnb data from the United States and obtain that
Airbnb’s flexible supply helps recover the lost underlying demand due to hotel seasonal pricing
and even stimulates more demand in some cities. While, Maté-Sánchez-Val (2021) finds mixed
results for Barcelona, where, on the one hand, Airbnb plays a substitutive role for traditional
hotels, specially when the platform’s offer is composed by private rooms and multi-listing hosts
But, on the other hand, in locations where traditional hotels do not have sufficient numbers of
rooms available to meet demand, Airbnb plays a complementary role.
In this context, our work is closer to the literature that addresses intra-platform competition.
In particular, this paper contributes to the discussion of how the intra-platform competition is
shaped due to factors that may be controlled by the platform itself, biasing seller’s probability
of being seen based on rating classification.
4 Model Specification
We assume that listings are differentiated products where prices are endogenously determined
by price-setting hosts (Berry (1994)). This insight allows different substitution patterns across
listings which permits us to estimate demand determinants based on discrete choice models.
This kind of models consider products as a bundle of characteristics. Berry (1994) proposed a
framework to estimate discrete choice models when there is unobserved consumer heterogene-
ity. This framework allows for estimation using traditional instrumental variables techniques
and, among others, includes the Logit and Nested logit model.
These models can be transformed into a simple linear regression of market shares on product
characteristics, by "inverting" the market share equation as proposed by Berry (1994). This fea-
ture makes the use of these models extended in the literature (Grigolon and Verboven (2014)).
The assumption of the logit model relies on that consumer’s preferences are uncorrelated across
products. While the nested logit model allows preferences to be correlated across products
within the same “nest” (Grigolon and Verboven (2014)). This, "allows for more reasonable sub-
8stitution patterns as compared with the simple logit model" (Berry (1994)).
4.1 Logit model
In this model, the main assumption relies on the independence of the ratio of probabilities
of choosing two products from other alternatives different than those two products (Train
(2009)). This is usually called independence of irrelevant alternatives (IIA).
In this type of setting the utility of consumer i for good j is given by equation 1, where xj is a
vector of observed characteristics of product j, pj is the price, ξj is an unobserved characteristic
for product j, while ij is a consumer-specific component of utility, which provides the varia-
tion on consumer taste. This last component is unobserved and it is assumed to be identically
and independently distributed across consumers and choices.
uij = xj β − αpj + ξj + ij (1)
One can denote δj = xj β − αpj + ξj , where δj represents the mean utility common to all
consumers for j. In models where individual tastes across consumers and choices are i.i.d, the
elasticities are determined solely by the mean utility levels, δj (Berry (1994)). The mean utility
for the outside good is normalized to 0 (δ0 = 0). In our case, the outside good represents the
hotels (see explanation in subsection 5.1). After rearrange the market share equations (see details
in Annex), we have the following linear equation:
sj
ln = xj β − αpj + ξj (2)
s0
The market share of each product j is given by sj = qj /L, which is the observed market share
Björnerstedt and Verboven (2016). L denotes the total potential market. Therefore, we can
rewrite equation 2 as,
!
qj
ln PJ = xj β − αpj + ξj (3)
L− k=1 qk
Likewise, the own-price elasticity of product j and the cross-price elasticity of product j with
respect to k can be recover from this model as shown by equation 4 and equation 5, respectively.
∂sj pj
jj = = −α(1 − sj )pj (4)
∂pj sj
∂sk pj
jk = = αsj pj (5)
∂pj sk
94.2 Nested logit model
The nested logit model is usually applied when the set of choices available for a consumer can be
divided into subsets or "nests". In these kind of models, IIA property should be satisfied within
each nest, which means that the ratio of the probabilities of choosing two products in the same
segment is independent of the attributes or existences of all other alternatives within the same
segment attributed by the "nest", while the property does not need two hold for products in
different segments (Train (2009)).
The nested logit model divides the products into G + 1 exhaustive and mutually exclusive sets,
g = 0, .., G. The utility of consumer i for product j that belongs in a particular group g can
be written as,
uij = xj β − αpj + ξj + ζig + (1 − σ)ij
Where ζ "is common to all products in group g and has a distribution function that depends on
σ, with 0 ≤ σ < 1" (Berry (1994)). We can rearrange terms (see details in Annex) and following
Berry (1994), the solution can be written as,
sj
ln = xj β − αpj + σ ln(sj|g ) + ξj (6)
s0
Following Björnerstedt and Verboven (2016), equation 6 can be rewritten as,
! !
qj qj
ln PJ = xj β − αpj + σ ln P + ξj (7)
L− j=1 qj j∈g qj
Likewise, the own-price elasticity of product j and the cross-price elasticity of product j with
respect to k can be recover from this model as shown by equation 8 and equation 9, respectively.
∂sj pj 1 σ
jj = = −α − sj|g − sj pj (8)
∂pj sj 1−σ 1−σ
∂sk pj σ
jk = =α sj|g + sj pj (9)
∂pj sk 1−σ
4.3 Rating-based segmentation and biased search results
Charlson (2021) provides a model where platform’s decision to bias seller’s visibility is explored.
This choice is shaped by a trade-off between more concentration of competition, which results
in lower expected prices across the network, and rents induced by the higher willingness to pay of
consumers due to the matching with high quality products. Moreover, it states that an increase
of substitutability between products as well as reduction in sensitivity to quality by consumers
would reduce the extent to which search process is biased towards highly-rated products.
10In the host industry, such as Airbnb, consumers differentiate services due to the heterogeneity
of listing’s characteristics and, therefore, according to Charlson (2021) it is profitable for these
business to bias users search process.
We estimated the logit model as a reference, however, our main interest relies on the estimation
of market segmentation, in particular, in rating-based market segmentation. Hence, we are fo-
cusing mainly on the results of the nested logit model, and, specifically, in the estimation of σ
related with rating-based nest. A large and significant rating-based nest coefficient will indicate
that listings inside each rating group will be seen as substitutes for consumers, since the deci-
sions that users face are separated by this particular "nest" (Donnelly et al. (2019)). This means
that competition will be concentrated since an existing nest will indicate a process of decision
by the consumer Davis et al. (2014).
Considering that rating-based filters are not available in the Airbnb search page, the results will
indicate that such nest will be given by an external factor, for instance, Airbnb. This will be
consistent with the view that some platforms, like Airbnb will bias their search results based on
rating Charlson (2021). Therefore, we evaluate the following main hypothesis: there is degree
of substitution within segments determined by quality differences established by rating level of
Airbnb listings.
5 Data and Estimation
5.1 Data treatment
We used Airbnb web-scraping data collected by Inside Airbnb, which is an independent, non-
commercial set of tools and data about Airbnb’s listings in several cities. Usually, this scraping
data is gathered in a monthly basis and it is composed by two main databases which contain
information about calendar availability and price for each listing from the scraping day until
next measure; and the characteristics of each listing. For this study, we used both databases from
listings in Barcelona scraped during November 2016 to February 202117 . In total, we gathered
nearly 30 millions of daily observations and we aggregated them to monthly data resulting in
970,222 observations.
Our demand and price variables have been constructed using the calendar availability database.
Particularly, we consider as demand variable, the number of booked days; however, the dataset
does not contain information whether a listing is booked or not, so we build a proxy variable
using the number of unavailable nights until next scraping date, we implicitly assume that there
17
The data was retrieved on the 22 April 2021 and it has a gap between February and April 2018.
11is no difference between blocked and booked days18 . Even though, the latter could be a strong
assumption, we reduce its effect excluding listing with zero booked days (see subsection 5.2).
Additionally, we perform an estimation with a sub-sample excluding hotel and shared rooms,
which are more likely to be blocked, and we verify the robustness of our results. Regarding the
price variable, we consider it as the average of available daily prices until next scraping date.
Likewise, control variables have been obtained using the listing characteristics database, while
the potential market size was build using the hotels’ overnight in Barcelona retrieved from the
Statistics Institute of Catalonia (see subsection 5.2). Moreover, after excluding missing values
related with the relevant variables, we obtained 761,489 observations. In Table 2, we show the
descriptive statistics for those observations.
From the descriptive statistics, we conclude that average prices are higher for entire apartments
and hotel rooms than private and share rooms, although the result is mixed with booked days.
We identify Eixample as the most expensive neighborhood on average, while, there seems to be
no substantial difference in the average booked days across neighborhoods. On the other hand,
being super host represents a small advantage in price with respect to those hosts without this
condition, nonetheless, there is no significant difference on booked days among them. Finally,
those who do not have reviews, charges the highest price on average compared with listings with
ratings. Whilst there seems to be a slightly increase in the booked days when rating increases,
the price seems to marginally decrease, with the exception of listings with rating higher than 97.
5.2 Estimation
The final models based on equations 3 and 7 to estimate are given by:
sjt
ln = xjt β − αpjt + γr + timet + ξjt (10)
s0t
sjt
ln = xjt β − αpjt + σ ln(sj|gt ) + γr + timet + ξjt (11)
s0t
The main variables required to estimate demand models described in equations 10 and 11 are the
following: market shares, prices and listing characteristics. To calculate the market shares we
need to define an outside good or a potential market size.
According to Berry (1994), the outside good is the one that might be purchased by consumers
instead of one of the ’inside’ goods, also, the distinction between these goods is that the price of
the outside good is not set in response to the prices of the inside goods. However, given that our
data is aggregated, the size of the outside good will be unobservable. Therefore, we must follow
18
This database does not allow us to identify if a day is not available because it is booked or the host has blocked
the day for other purposes.
12the customary procedure of assuming a ’potential market size’ and, then, calculating the outside
good as the total size of the potential market minus the shares of the inside goods (Huang and
Rojas (2010), and Nevo (2000)).
As Nevo (2000) states the potential market size is assumed according to the context. In that
sense, there are many approaches to estimate the potential market size. So, for instance, Berry
et al. (1995) and Verboven (1996) assume the potential market size of car markets to be the total
number of households in the economy. Also, Björnerstedt and Verboven (2016) estimate the
potential market size of analgesics, for a constant expenditures logit model, as twice the aver-
age amount spent over the entire period; in other words, it estimates the potential market as a
proportion the analyzed market.
Additionally, since the outside option represents either an aggregate of other alternatives that are
considered as further substitutes, or non-purchasing behavior (Bonnet and Richards (2016)),
we could build a potential market using information about further substitutes. So, for example,
Bonnet and Réquillart (2013) estimate a potential market size using purchases of fruit juices as
the outside option in a random coefficient logit model for a focal soft drink demand estimation.
In this study, we restrict our model to Airbnb listings’ data and build the potential market using
information about total hotels’ overnight in Barcelona city. We calculate the potential market
size as the sum of the total nights per month both for hotels and for Airbnb listings. This as-
sumption could raise some concerns as to whether it is appropriate to use the data from a ’sub-
stitute’ product to build the potential market size. Regarding this, we consider that Airbnb is a
niche product and hotels would not be a close substitute (Guttentag (2015)), and, also, hotel’s
revenues would not be affected by Airbnb’s demand (Zervas et al. (2017)).
Furthermore, the estimation procedure for demand models (equations 10 and 11 cannot be per-
formed in presence of market shares equivalent to zero since the dependent variable is in loga-
rithm. The presence of zero demand or zero sales is a common problem in ’big data’ applications
given the more granular views of consumers, products, and markets (Gandhi et al. (2019)). We
face this problem given the large number of listings and observations in our data.
To solve it, we follow a straightforward approach which consists in dropping all zero market
shares (nearly 10% of observations). Although, this approach could imply that observed ze-
ros are treated as true zeros, which would assume that there is no demand for these products
and, consequently, it could create a potential selection bias in demand estimations (Quan and
Williams (2018) and Gandhi et al. (2019)); we consider that a potential selection bias is mitigated
in our estimation since our estimation is based on aggregated data. Thus, it is reasonable to as-
sume that a listing with zero market share during a month is inactive as it is considered in Gunter
and Önder (2018); then, there is a high probability that, our observed zeros are true zeros.
13Moreover, to control for listing’s characteristics, we include the following variables: number of
bathrooms, beds, bedrooms, amenities, maximum of accommodates; and dummies on whether
the listing is instant bookable, on whether it has a license to be rented for less than 30 days, and
on whether it is an entire apartment, private, shared or hotel room. Additionally, we include
data about host characteristics such as whether the host is a ’super host’ and whether the host’s
identity is verified.
Finally, we include time binary variables (timet ) to control for common time-related shocks,
and, to control for unobservable time-invariant neighborhood characteristics, such as place rep-
utation and touristic attractiveness, that can derive in constant differences in the booked days
(see figure 8 in Annex). Also, we include fixed effects by neighborhood (γr ); even though, the
inclusion of fixed effects alleviate the endogeneity problem, it does not necessarily eliminate it,
then the inclusion of instrumental variables becomes relevant.
5.3 Identification
The main identification assumption is that products’ characteristics other than price are un-
correlated with the error term, . Nonetheless, as the usual demand specifications, logit and
nested logit models (equations 3 and 7) suffer from endogeneity in price and, in the nested logit
model, segment market share. The problem comes from the fact that demand shocks that enter
in jt will affect, not only market shares; but also prices and segment market shares, resulting
in simultaneity between the variables. This problem, if it is ignored, will result in biased and
inconsistent estimators of α and σ coefficients.
To address endogeneity of the relevant variables, we need to use at least one instrumental vari-
able (IV) for the logit model and at least two instrumental variables for the nested logit model.
This selected variables need to be correlated with price and in-group market share and they have
to be exogenous to the willingness to pay of guests. Considering this, we use a dummy variable
indicative whether the listing has license to be rented for less than 30 days and the usual BLP
instruments (Berry et al. (1995)).
The rationale behind the validity of license as an instrument rests on that the price setting will
depend on costs associated with possession of a license. On the other hand, in principle, the
possession of a license should not affect the willingness to pay of guests, since it comes from the
regulatory side. Also, this variable will vary over time19 with different associated costs related to
regulatory decisions.
The BLP instruments are constructed as the sum of the characteristics of other listings owned by
19
According with El Pais, Airbnb has been fined for hosts that break this rules, which means that there is history
of listings without license that have been rented for less than 30 days.
14the same host and the sum of characteristics of each listing’s competitor. Let H be the set of all
P
hosts, therefore, for a given host h, the BLP instruments can be calculated as k6=j,k∈Hh xk and
P
/ h xk , with xk being the specific characteristic x of listing k. We can use these instruments
k∈H
since there is variation in the quantity of listings owned by hosts across time (see figure 8 in
Annex), which guarantee the relevance of these instruments.
The logic behind the relevance and exogeneity of these instruments relies on the fact that it is
likely that characteristics of other listings (owned by the same or other hosts) shape the price
setting of each host and, at the same time these characteristics should not affect the willingness
to pay of guests for that specific listing. These constructed variables are the standard instruments
used in logit demand applications (Gandhi and Houde (2019)).
6 Results
We now present the results from our logit model (equation 10) and nested logit model (equation
11). Then, we complement the results by describing the estimation from an alternative version
of the nested logit which includes the interaction of the main nest considered, with in-group
market shares. Finally, we present the elasticities derived from the main specifications.
6.1 Logit Models
In Table 3, we show the results for the logit model under different specifications. Column 1
and 2 refer to the logit model excluding rating, while column 3 and 4 incorporate rating in its
continuous version as a control variable. All estimations in Table 3 are computed with fixed
effects by region and time effects, although, column 2 and 4 are computed using IV described
in section 5.3 while, column 1 and 3 are estimated without any IV.
For all specifications, most parameters have the expected sign and all of them are estimated sig-
nificantly different from zero. In all settings, the coefficient of interest, α, is negative and sig-
nificant, although its magnitude is small. Including instruments increase the size of α in the
specification that excludes rating, and decrease its magnitude when controlling for it.
For the relevant estimation, in column 4, demand grows when there is an increase in the number
of bedrooms, the host is categorized as super host or has the identity verified; the same occurs
when the listing has kitchen, heating, as well as when there is an increase in the rating. The
opposite happens with hotel, private and share rooms, in comparison with entire apartments,
surprisingly, the demand tends to decrease when the number of bathrooms, beds and amenities
increase or whether the listing has air conditioner or TV.
156.2 Nested Logit Models
Table 1 shows the results for the nested logit model under different nests. All the estimations
were computed including time effects, fixed effects by region20 and using the IVs described in
section 5.3. Column 1, 2 and 3 shows the output when super host, room type and neighborhood
are used as a nest. While, column 4 describes the results when the nest is determined by rating
classification21 .
In column 1, the α has the expected sign and it is statistically significant, while σ has the opposite
sign, although it is not significantly different from zero, which means that ’super host’ does
not perform well as a market segmentation, even though it is part of the filters in the Airbnb
search web site. Most of the control variables have the expected sign except for number of beds,
quantity of accommodates and whether the listing has AC or TV.
When we include room type as a nest, σ becomes relatively high and significant, the estimated
α, as before, is statistically different from zero and negative. With the exception of number of
bathrooms, beds, amenities and whether the listing has AC, the other control variables have the
expected sign.
The estimated σ increases when we use neighborhood as a nest, which highlight the importance
of this variable for the user, it seems that listings within neighborhood are seen as close substi-
tutes. Under this specification, the α has the expected sign and it is statistically different from
zero. The majority of the control variables have the expected sign excluding the number of beds,
bedrooms, and whether the listing has TV.
From all nests tested, rating classification is the most important, with a statically significant and
high σ. This means that the listings within each rating classification are seen as close substitutes
by consumers, even though, the filter is not available in Airbnb’s search page, therefore, as dis-
cussed in section 4, this means that competition is concentrated in these segments created by
this variable.
Under this specification, α has the expected sign and; as the other specifications, is statistically
different from zero, although is small in magnitude. There is expected increase in demand when
listings have more bedrooms, amenities or allow more accommodates; while there is an expected
decreased in demand when there is an increase of number of bathrooms, beds or whether the
listing has kitchen, air conditioner or TV, these results could be due to the possibility that these
variables are capturing some other effects not included in the models.
20
Except when we used neighborhood as a nest
21
Categorical representation of the rating (≤ 80, > 87 and ≤ 93, > 93 and ≤ 97 and > 97)
16Table 1: Nested Logit model
ln(sj /s0 )
Super host Room type Neighborhood Rating class.
Price −0.0017∗∗∗ −0.0003∗∗∗ −0.0005∗∗∗ −0.0001∗∗∗
(0.0001) (0.00004) (0.0001) (0.00002)
ln(sj|g ) −0.0140 0.5355∗∗∗ 0.8776∗∗∗ 0.9766∗∗∗
(0.0173) (0.0093) (0.0338) (0.0044)
Bathrooms 0.0205∗∗∗ −0.0413∗∗∗ 0.0883∗∗∗ −0.0021∗∗∗
(0.0025) (0.0012) (0.0034) (0.0005)
Bedrooms 0.0460∗∗∗ 0.0739∗∗∗ −0.0408∗∗∗ 0.0017∗∗∗
(0.0023) (0.0012) (0.0036) (0.0005)
Beds −0.0058∗∗∗ −0.0399∗∗∗ −0.0271∗∗∗ −0.0003
(0.0011) (0.0008) (0.0012) (0.0002)
Hotel room −0.1647∗∗∗ - 0.1734∗∗∗ 0.0107∗∗∗
(0.0117) (0.0164) (0.0026)
Private room −0.1927∗∗∗ - −0.0814∗∗∗ −0.0041∗∗∗
(0.0045) (0.0058) (0.0012)
Shared room −0.5477∗∗∗ - −0.3148∗∗∗ −0.0159∗∗∗
(0.0160) (0.0144) (0.0035)
Superhost - 0.0416∗∗∗ 0.0594∗∗∗ −0.0155∗∗∗
(0.0018) (0.0028) (0.0008)
Identity verified 0.0508∗∗∗ 0.0270∗∗∗ 0.0336∗∗∗ 0.0284∗∗∗
(0.0034) (0.0013) (0.0019) (0.0005)
Instant Bookable 0.1150∗∗∗ 0.0286∗∗∗ 0.0663∗∗∗ 0.0033∗∗∗
(0.0022) (0.0018) (0.0028) (0.0007)
Amenities 0.0003 −0.0004∗∗∗ −0.0035∗∗∗ 0.0008∗∗∗
(0.0003) (0.0001) (0.0001) (0.00003)
Kitchen 0.0956∗∗∗ 0.1121∗∗∗ 0.0381∗∗∗ −0.0012
(0.0035) (0.0020) (0.0040) (0.0009)
Heating 0.0243∗∗∗ 0.0335∗∗∗ 0.0300∗∗∗ 0.0101∗∗∗
(0.0030) (0.0015) (0.0023) (0.0006)
AC −0.0226∗∗∗ −0.0217∗∗∗ 0.1014∗∗∗ −0.0131∗∗∗
(0.0028) (0.0016) (0.0053) (0.0006)
TV −0.0115∗∗∗ 0.0074∗∗∗ −0.0641∗∗∗ −0.0024∗∗∗
(0.0027) (0.0015) (0.0029) (0.0005)
Accommodates −0.0122∗∗∗ 0.0132∗∗∗ 0.0522∗∗∗ 0.0030∗∗∗
(0.0017) (0.0010) (0.0028) (0.0003)
Region fixed effects Yes Yes No Yes
Time effects Yes Yes Yes Yes
BLP & License instruments Yes Yes Yes Yes
Observations 768,428 768,428 768,428 761,489
Adjusted R2 0.0034 0.7622 0.5122 0.9563
Standard errors in parentheses. ∗ p6.3 Evaluating differences in level of competition
As we explain above, we estimated a complementary model only for the nested logit model using
rating classification as potential market segmentation. This model consists in the inclusion of
interactions between the classifications given by rating and the in-group market shares. This
approach allows us to differentiate the intensity of competition among segments. The results
in Table 4 are computed using control variables, fixed and time effects, and IVs considered above
interacted with the stratification added by rating.
This output indicates that the intensity of competition increases when the listings have a rat-
ing above 87 and below 97. Although, the reverse occurs with listings without rating or when
they are rated above 97. Given these results, we infer that, even though, there is an important
segmentation in this market that makes a difference on the intensity of competition faced by
listings, this distinction does not seem to follow a defined pattern.
6.4 Elasticities
In Table 5 we show the estimated own-price demand elasticities from the logit model after con-
trolling by rating and from the nested logit model using rating classification as a nest. Finally,
in Table 6 we show the cross-price elasticity under the last specification. The estimation were
made using equations 4 and 6 respectively, described in section 4.
The elasticities computed under the logit model indicate that the demand for Airbnb listings
is highly inelastic, this regardless of the sub-sample considered. As noted by Nevo (2000), the
problem related with almost homogeneous elasticities is that for almost all the listings the mar-
ket shares are small, therefore, the equation 4 is nearly constant, depending only on α and price.
Whilst for both models we find an inelastic demand, the inclusion of rating classification as
a nest, not only increase (in absolute value) the elasticities in all sub-samples made, but also,
adds heterogeneity to them. This can be explained by the importance of rating classification
as market segmentation provided by the large σ estimated, as well as the heterogeneity in the
in-group market shares.
On the other hand, the estimated cross-price elasticities (Table 6) highlight the implications de-
scribed in subsection 6.2, and they allow us to consider how much listings in different segments
compete with each other (Hausman et al. (1994)). Since the estimation is larger for listings that
belong to the same segment than those who belong to different segments, the competition in-
tensity faced by those listings is different.
187 Discussion
7.1 Conclusion
In this paper, we study how different variables, and in particular, rating; shape segmentation in
the context of Airbnb’s market in Barcelona from November 2014 to February 2021. Specifi-
cally, using a nested logit model, we found an inelastic demand of Airbnb’s listings in Barcelona
in a market that is divided by rating classification. Our empirical results show the following two
points.
First, the majority of hosts face an inelastic demand. These results are consistent under the two
main models we used. From the nested logit model under rating segmentation, we found that
when there is a 10% increase in price of available nights, there is an expected decrease in booked
nights of 4.5%. These results imply that there is room to increase the price without reducing the
revenues of the hosts.
Second, even though, the rating is not available as a filter in the Airbnb web page, it creates an
important market segmentation. This means that the competition between two listings that
belong to the same segment is different from the competition faced by two listings that belongs
to different rating classifications. Moreover, we found differences in intensity of competition
faced by listings that belong to different segments.
These results are consistent, partially, with the model provided by Charlson (2021), since the
existence of segmentation suggest that Airbnb is performing a rating-based market division. Yet
the rating segmentation does not show a clear pattern of competition intensity in each group.
7.2 Limitations
The analysis we made faces some limitations associated to data, model specification and esti-
mation procedure. The data is restricted to Airbnb’s market in Barcelona and it is limited to
Airbnb’s scraping data solely. Likewise, we have taken some assumptions in our models and
estimation methods which could be challenged. As follows, we explain the nature of these lim-
itations and the robustness tests performed to evaluate their implications in our results.
Our results cannot be generalized since Barcelona has a large number of listings (nearly 17,000)
and it is one of the Top10 most visited cities in Europe, therefore, Airbnb’s market in Barcelona
is more dynamic and competitive than others. This implies that a rating-based segmentation
may not have the same effects (or even exists) on another Airbnb’s markets. Thereby, there is
room for further research to contrast our suggested results in other cities.
The scraping data used does not include booked days as a variable. This data restriction led
19us to build a proxy with a strong assumption (all unavailable days are booked days). In this
context, as a robustness test, we perform estimations with a sub-sample excluding hotel and
shared rooms22 obtaining results consistent with our main outputs (see Table 10 of Annex).
Nonetheless, future research can explore our approach using booked days data available in some
alternative non-publicly sources.
With respect to discrete choice models, an important assumption is that consumers have the
entire selection set available (Bonnet and Richards (2016), Nevo (2001)). However, this assump-
tion could be not reasonable in our study given that, we consider that nearly 17,000 listings are
available. Therefore, our results could be biased since the choice set may be heterogeneous across
consumers, and endogenously determined (Bonnet and Richards (2016)). To address this issue,
we follow a straightforward robustness check through limiting the size of choice set. Specifi-
cally, we perform estimations limiting the number of listings available to consumers obtaining
mixed results compare to our main outputs (see Table 11 and 12 of Annex).
Regarding to the estimation, we are aware that the potential market size (using hotel’s data) as-
sumption, could raise concerns about not including hotels as Airbnb’s subtitutes. In that sense,
we test an scenario where the outside option is not included and the model is limited to pre-
dict results about consumers who already chose a group of alternatives (Bonnet and Richards
(2016)); with this purpose, we followed the procedure mentioned in Nakanishi and Cooper
(1982) and Morais et al. (2016). We consider a potential market size composed only by listing’s
booked nights in our database, then we use a log-centering transformation to calculate the rel-
evant market, obtaining results consistent with our main estimations (see Table 13 of Annex).
Likewise, we perform an alternative scenario where the potential market size depends on a pro-
portion (Nevo (2000)). We build a potential market size equivalent to three times the total
booked nights of the listings obtaining consistent results as well (see Table 14 of Annex).
Finally. there could be some concerns about the presence of zero market shares in our data
and the approach we followed given that as Quan and Williams (2018) states this scenario could
led to create a selection bias in demand estimates. Regarding it, even thought we consider our
approach is reasonable, we hope that further research explore some alternative methods as men-
tioned by Gandhi et al. (2019) and Nurski and Verboven (2016).
22
We consider that in these type of listings there is a higher probability that an unavailable day is, in fact, a
blocked day instead of a booked day.
208 Annex
A1: Evolution of total listings
Figure 1: Total listings over time
Figure 2: Total listings by room type over time
21Figure 3: Total listings by neighborhood over time
22A2: Methodology for logit and nested logi model
A2.1: Logit model
In the logit model ij is modeled as an i.i.d. random variable with an extreme value distribution,
F (δ0 , ..., δJ ) = exp(−exp(−I)) (12)
Where I is an inclusive value defined as:
J
X
I = ln exp(δk )
k=0
The individuals choose the product out of the J +1 products that maximizes utility. The prob-
ability that consumer i chooses product j takes the following standard logit form (McFadden
(1977)):
exp(xj β − αpj + ξj )
sj = PJ (13)
1 + k=1 exp(xk β − αpk + ξk )
Notice that the probability that consumer i chooses the outside good is given by:
1
s0 = PJ (14)
1+ k=1 exp(xk β − αpk + ξk )
Taking the logarithm of the ratio of equations 13 and 14 we can derive equation 2.
A2.2: Nested Logit model
In the Nested Logit model, the individual-specific error follows the same distribution given by
equation 12, although, now the inclusive value I can be written as,
G
X
I = ln exp(Ig )
g=1
Where Ig is given by
jg
X δj
Ig = (1 − σg ) ln exp
j=1
1 − σg
Under this specification, the probability that individual i chooses product j is provided by,
exp(δj /(1 − σg ))exp(Ig )
sj = sj|g sg =
exp(Ig /(1 − σg ))exp(I)
23You can also read