Materials Express - Ingenta Connect
←
→
Page content transcription
If your browser does not render page correctly, please read the page content below
Materials Express
                                                                                                              2158-5849/2019/9/813/008
                 Copyright © 2019 by American Scientific Publishers
                 All rights reserved.                                                                           doi:10.1166/mex.2019.1565
                 Printed in the United States of America                                                         www.aspbs.com/mex

Investigation on nanographene generation and
its molecule adsorption
Junxia Zhang1, 2, ∗ , Zehua Wang1 , Binwu Wang2 , and Xiaopeng Song2
1
 School of Mechanical and Energy Engineering, Shaoyang University, Shaoyang 422000, Hunan Province, PR China
2
 School of Energy and Building Environment, Guilin University of Aerospace Technology, Guilin 541000,
Guangxi Province, PR China

ABSTRACT
An experimental method was applied to prepare nanographene, in which its surface feature was analyzed using

                                                                                                                                            Article
scanning electron microscope and Fourier infrared ray analyzer. A methylene blue (MB) solution was adopted
to measure the molecule adsorption of nanographene and graphite and demonstrated that nanographene had
                            IP:that
more molecule adsorption than   192.168.39.211   On:the
                                    by graphite. As   Tue,  09 Nov 2021of23:13:04
                                                         concentration    MB solution increased, the molecule
                                  Copyright: American Scientific Publishers
adsorption of nanographene ascended. As Delivered
                                            the stirringbytime of
                                                           Ingentaa magnetic   stirrer decreased, the molecule
adsorption of nanographene in the MB solution increased significantly. Meanwhile, the increment in the absorp-
tion amount of graphite reduced. As the dosage of nanographene and graphite increased, the absorption
capacity of nanographene reached a peak value of 40 mg, which was two- or threefold higher than that of
graphite. Hence, nanographene has higher molecule adsorption capacity than graphite.

Keywords: Nanographene, Graphite, Preparation, Molecule Adsorption.

1. INTRODUCTION                                                             Graphenano Company and Kerr Maria University in Spain.
In 2004, AndreGeim and Konstantin [1] used a special                        The load capacity of this polymerized battery was three-
tape to exfoliate graphene successfully (named after a                      fold higher than existing batteries. At present, nanoma-
micromechanical cleavage method), which demonstrated                        terials have been widely applied in catalytic degradation,
the existence of graphene. In June 2011, the first inte-                    biomedicine, defense-related science and technology, opti-
grated circuit in the world was prepared with graphene in                   cal materials, microelectronic devices, sensors, and mag-
the research center of IBM [2]. In March 2013, a super-                     netic materials.
capacitor made in graphene was investigated by several                         Many scholars have investigated the preparation and
American scientists; its charge efficiency is much higher                   structural performance of nanographene. Wu et al. [4]
than that of ordinary materials. When this supercapaci-                     adopted a one-step hydrothermal synthesis to generate
tor was used to make cellphone, the charge time is sev-                     graphene quantum dots that possess a strong absorption
eral seconds only. Researchers in the Berkeley Institute of                 band at the UV region and a strong, narrow, and excitation-
California University prepared photodetector [3] that can                   independent emission peak. Graphene quantum dots can
realize fast data communication in several milliseconds.                    be used to measure Mn2+ ions. Liu et al. [5] synthe-
In 2015, a polymerized battery with considerable load                       sized graphene with a Mn compound via a hydrother-
and discharge capacities was made with graphene by the                      mal method. These researchers analyzed the effects of
                                                                            the mole ratio of KMnO4 to citric acid on the MnOOH
    ∗
        Author to whom correspondence should be addressed.                  and MnCO3 contents and found that graphene synthe-
        Email: wyb700411@163.com                                            sis with MnOOH has excellent cycle stability and the

                                                              Mater. Express, Vol. 9, No. 7, 2019                                   813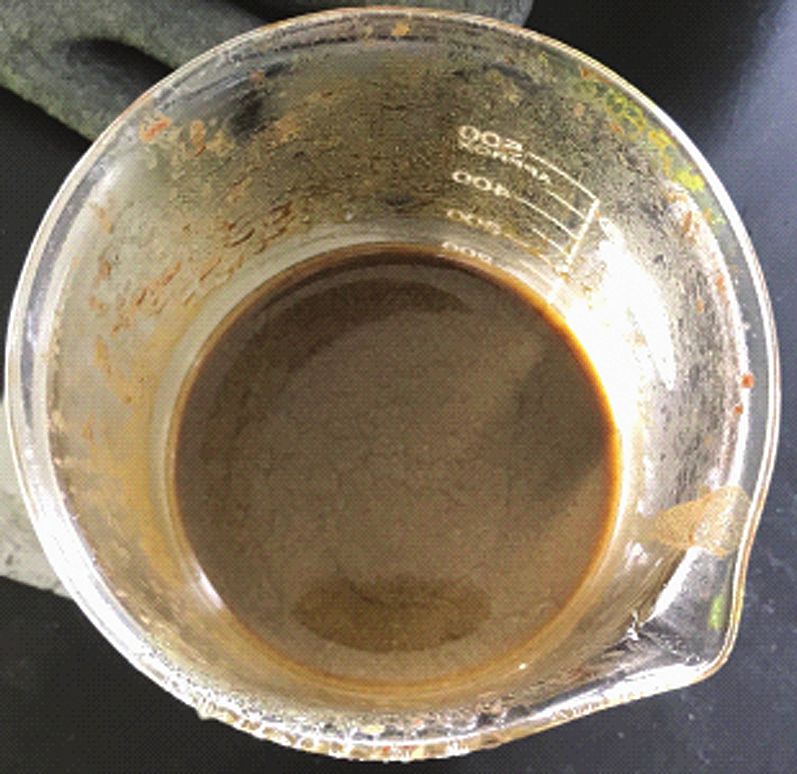
Materials Express                                         Investigation on nanographene generation and its molecule adsorption
                                                                                                                             Zhang et al.

          best super-capacitance when the mole ratio of KMnO4           2. EXPERIMENTS ON GENERATING
          to citric acid is 8:3. The specific capacitance can reach          NANOGRAPHENE
          267.7 F/g at a current density of 0.5 Å/g. Wang et al. [6]    2.1. Experiments on Generating Nanographene
          developed a composite material involving cobalt oxide         Existing methods to prepare graphene mainly include the
          nanoparticles and graphene (CoO/RGO) via the hydrother-       chemical vapor deposition (CVD), the micro-mechanical
          mal method. CoO nanoparticles loaded on the surface           cleavage method, the oxidation–reduction method and the
          of graphene nanosheets can prevent graphene aggrega-          epitaxial growth method. In the CVD method, hydrocar-
          tion, thereby forming a large 3D electron conductive          bon is added on the heating base metal to react to the
          network that can promote the electrical conductivity of       base metal and produce multiple and single graphene lay-
          composites. Du et al. [7] prepared two functionality-type     ers. This reaction is a displacement reaction. In particular,
          single-layer graphene types by using a low-temperature        this method, which can displace a C atom in the hydro-
          thermal exfoliation approach, in which the maximum spe-       carbon with the metal to form graphene, requires a low
          cific capacitance is approximately 220 F/g in the KOH         reaction temperature to obtain graphene with good quality
          system of 2 mol/L. Sui et al. [8] prepared graphene           and large size and realize large-scale production. However,
          with the reduction of graphene oxide through glycol by        the cost of raw materials and devices are high, and the
          using a hydrothermal method. Zeng et al. [9] adopted a        thickness of graphene cannot be controlled mainly because
          hydrothermal method to synthesize TiO2 -pillared graphene     a small quantity of C during deposition is transformed into
          nanocomposites and investigated its effect on photocatal-     graphene. This process occurs in C growth and connec-
          ysis. These researchers found that the kind of mate-          tion because a complex conversion is difficult to control.
          rial influences photocatalysis during methylene blue (MB)     In 2004, scientists used mechanical cleavage method to
          degradation. Bi et al. [10] developed an optical modula-      prepare graphene by repeatedly removing the specific tape
          tor on the basis of graphene. Lu et al. [12] had developed    adhered on graphene to obtain graphene with the size in
          a fluorescence quenching based approach using grapheme        the range of 10–100 m. The graphene obtained using this
          oxide for rapid detection of miRNAs. Dan et al. [12]          method has high quality and low cost, and the operation
Article

          introduced a 2D CCA into a layer-by-layer composite           is simple. However, this method requires a long time, and
          membrane based on reduced graphene         oxide  and   two-
                                            IP: 192.168.39.211 On: Tue,is09unsuitable
                                                                              Nov 2021 for23:13:04
                                                                                           large-scale production.
          dimensional colloidal crystal array. Copyright:
                                                  Zhang et American
                                                              al. [13] Scientific
                                                                           In the Publishers
                                                                                  oxidation reduction method, a strong acid (e.g.,
          developed a PEGylated reduced graphene oxide          (PEG- bysulfuric
                                                             Delivered   Ingentaacid) and an oxidizer (e.g., potassium perman-
          RGO) nanovector for efficient delivery of ssRNA. Wang         ganate) are added into the graphene powder. Graphite
          et al. [14] reported a simple and efficient preparation       oxide was obtained at an appropriate temperature. The part
          method of an inverse-opal-like macroporous polytetraflu-      of graphite oxide was prepared via ultrasonic dispersion.
          oroethylene (IO-PTFE) film with a reusable matrix. Xia        Then, a strong reducer was added into the solution to
          et al. [15] prepared a kind of three dimensional phytic       obtain graphene. This method required low-cost raw mate-
          acid-induced graphene coating by hydrothermal synthe-         rial and devices, can be easily operated, and can be used
          sis and fabricated on a stainless-steel wire using physical   in large-scale production. However, the obtained graphene
          coating method as a solid phase microextrastion coating.      had large defects due to the lack of –OH functional
          Zhang et al. [16] studied the size-dependent viscoelasticity  group and incomplete structure. Graphene is also easy to
          in polymer nanofibers and reported the first experimen-       reunite, thereby affecting the measurement of electrical
          tal evidence of significant size-dependent stress relaxation  and mechanical properties and limiting its application.
          in electrospan nanofibers as well as size-dependent poly-        The epitaxial growth method was divided into the epi-
          lactic acid/modified graphene of the confined amorphous       taxial growths of SiC and metal catalysis. The reaction
          regions. Li and Xie [17] reported an effective strategy for   mechanism of SiC epitaxial growth method was to heat
          the polyolefin-functionalized graphene oxide using two-       SiC in the vacuum at high temperature, separating Si from
          step methods.                                                 its surface, and leave a processing of C atom solving, reor-
             Investigations on nanographene molecule adsorption in      ganizing, and growing. This method can obtain graphene
          the literature are limited. In this work, graphite pow-       with single or two layers.
          der was used to prepare nanographene by means of an              The epitaxial growth of metal catalysis is achieved by
          improved hydrothermal method. The structural features of      pouring hydrocarbon onto the metal surface in a vacuum
          nanographene were investigated using a scanning elec-         at high temperature to obtain graphene through dehy-
          tron microscope (SEM) and Fourier infrared ray analyzer,      drogenation. Large-scale graphene production and high-
          and a part of nanographene was placed in the MB solu-         quality of graphene is obtained with this method. However,
          tion to analyze the effects of MB solution concentration,     this method requires costly raw materials and devices and
          nanographene dosage, pH value of MB solution and stir-        is difficult to maintain at high temperature of 1400  C
          ring time on nanographene molecule adsorption compared        and vacuum atmosphere. Forming film is also difficult.
          with that of graphite.                                        Other methods of generating graphene include C nanotube

          814                                                                                            Mater. Express, Vol. 9, 2019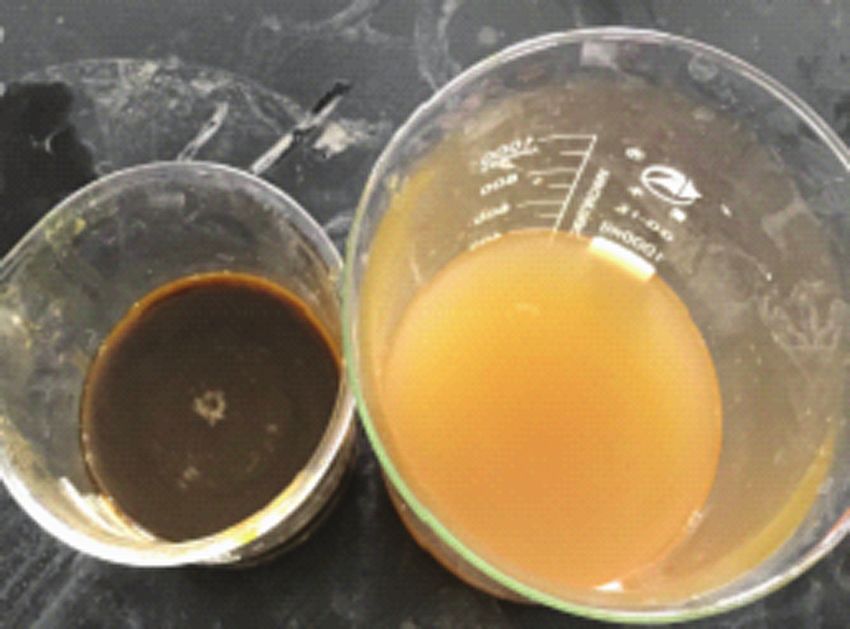
Investigation on nanographene generation and its molecule adsorption
Zhang et al.
                                                                                                      Materials Express
Table I. Agents needed for the graphene preparation.                   (5) The conical flask was immersed in water at 35  C
                                                                       and reacted for 30 min, and the solution was diluted with
Agent                   Chemical                       Place of
name                     formula         Size         production       deionized water of 69 mL at the temperature of 57  C, and the thin
added into the conical flask by means of a glass rod
                                                                       layer of the obtained bright silver graphene was ground
drainage. Meanwhile, the system temperature was con-
                                                                       into the powder after drying.
trolled at 7  C
and reaction time of 2 h;

Table II.   Main experimental devices used in experiments.

Devices                                   Size         Place of production

Digital display type magnetic stirrer     DF-II        Chongqing in China
Electric-heated thermostatic              HH-S6         Beijing in China
   water bath
High speed freezing centrifuge          TGL21M          Hunan in China
Integrated ice maker                     AM-200        Shanghai in China
Ultrasonic cleaner                       2013QT        Con son in China
Electronic balance                      YP20002        Shanghai in China
Vacuum drying oven                     DZF-6050B       Shanghai in China
Sliding vane rotary vacuum pump           2XZ-2         Linhai in China
Scanning electron microscope              300         Zeiss in Germany
Visible range spectrophotometer           722N         Shanghai in China
Fourier Infrared-ray analyzer         IR Prestige-21   Shimadzu in Japan
                                                                             Fig. 1.   Graphite oxide solution.

Mater. Express, Vol. 9, 2019                                                                                                815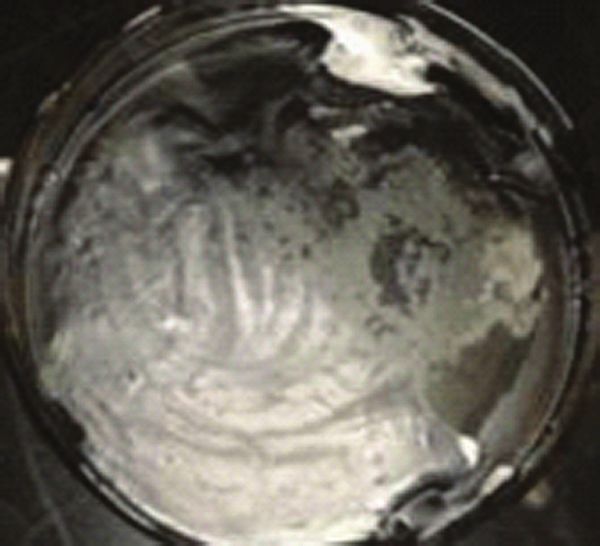
Materials Express                                         Investigation on nanographene generation and its molecule adsorption
                                                                                                                             Zhang et al.

                                                                         solution was washed with HCl and deionized water alter-
                                                                         nately several times until the pH value became neutral.
                                                                         The obtained supernatant by centrifugation showed a faint
                                                                         yellow color, and the graphite oxide displayed a brown
                                                                         yellow color, as shown in Figure 2. The graphite oxide
                                                                         washed with absolute ethyl alcohol showed the presence
                                                                         of debris, and the obtained supernatant after centrifugation
                                                                         and sticky sediment showed a bright black color. The thin
                                                                         layer of graphene after drying and precipitation displayed
                                                                         a bright silver color, as shown in Figure 3.

                                                                         3. RESULTS AND DISCUSSION
                                                                         3.1. Structural Performance of Graphene
          Fig. 2. Centrifugated supernatant and diluted graphite oxide
                                                                         3.1.1. SEM Analysis
          precipitates.                                                  SEM can use electron beams to scan the sample surface
                                                                         microscopically, thereby revealing information on the sam-
                                                                         ple surface. SEM identifies the surface structure by obtain-
          molecules into the layer of graphite powder and deco-          ing a 3D high-resolution diagram of the sample surface
          rate the O-containing functional groups on the surface         according to the interaction between the electrons and the
          of graphene, thereby increasing the distance between the       material. In our experiments, the patterns of sample surface
          graphite powder layers. These processes can enable the         were measured by a SEM with 300 (Germany), in which
          oxidation of strong oxidants. The function of the fourth       its magnification ranged from 0.1 to 1 million and accel-
          step was to oxidize graphite powder with the strong oxi-       eration voltage was within 0.02–30 kV. Figure 4 shows a
          dation of potassium permanganate and concentrated sul-
Article

                                                                         SEM diagram of graphene. Before the SEM characteriza-
          furic acid for the decoration of hydroxyl and carboxyl         tion, a sample was made by coating graphene powder on
          groups by changing the acting IP:     192.168.39.211
                                             force                On: Tue,the
                                                   between molecules        09plate
                                                                               Nov through
                                                                                    2021 23:13:04
                                                                                             metal spraying to obtain a good obser-
                                                  Copyright:
          and increasing the hydrophilicity of graphite powder.American
                                                                 Thus, Scientific  Publishers
                                                              Delivered  vation  effect. The sealing chamber of the SEM was filled
          graphite powder is convenient to dissolve in water.    Here, bywith
                                                                           Ingenta
                                                                               N to isolate air and avoid sample pollution by the
          washing with ice ensures the safety of experiments and         substances suspended in air. As shown in Figure 4, the
          reaction velocity. The addition of deionized water in the      surface of graphene was smooth, and some evident fold
          fifth step reduces the acidic property and improves the        structures can be observed at 5.58 k× magnification. How-
          pH value. The functions of the seventh and eighth steps        ever, at 7.13 k× magnification, these folds displayed in
          were to extract the prepared graphite oxide. The addi-         the way of single-layer structure, were complete and had
          tion of 5% HCl prevented the expansion and hydrophilic-        considerable transparency. This finding indicated that the
          ity of graphite oxide, while washing with deionized water      reduction state of nanographene is ideal.
          made the pH value of the solution neutral and remove sul-
          fate ions in sample detection. In preparing graphite oxide,    3.1.2. FI-IR Analysis
          H2 O2 was added into the solution at 80  C, which changed
                                                                         The FI-IR spectrum can be used to investigate the vari-
          in the color of the solution from brown to bright yel-
                                                                         ation law of the surface O functional groups before and
          low, as shown in Figure 1. The obtained graphite oxide
                                                                         after the reduction reaction of graphite oxide. Figure 5
                                                                         shows the diagram of FI-IR spectrum on graphite oxide
                                                                         and graphene. As shown in Figure 5, graphene obtained
                                                                         through reduction reaction had more intensive molecule
                                                                         absorption property at the ranges of 550 cm−1 ∼3240 cm−1
                                                                         and 3440 cm−1 ∼4000 cm−1 wavelength, and the transmit-
                                                                         tance reduced accordingly. It is indicated that the graphene
                                                                         has more intensive molecule absorption property than that
                                                                         by the graphite oxide.

                                                                         3.2. Comparison of Graphite and
                                                                              Molecule Adsorption
                                                                         A 722N-type visible spectrophotometer (Shanghai Jinghua
                                                                         Technological Instruments Co., Ltd.) with measurable
          Fig. 3. Thin layer graphene.                                   wavelength range between 190 and 100 nm was used

          816                                                                                            Mater. Express, Vol. 9, 2019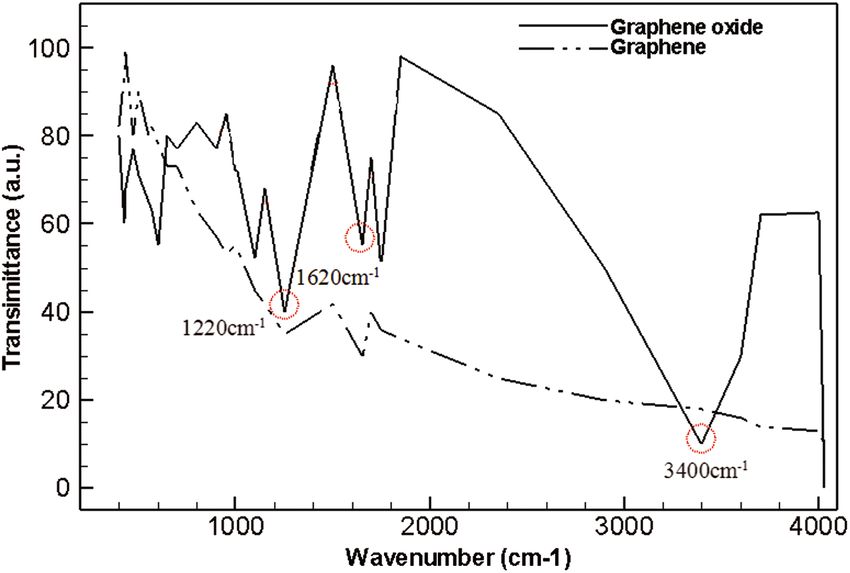
Investigation on nanographene generation and its molecule adsorption
Zhang et al.
                                                                                           Materials Express

Fig. 4. SEM images of graphene.

to analyze the component and structure of graphite and         of 100 mL each were added into these conical flasks,
nanographene samples quantitatively. The device could be       and their concentrations were 1, 2, 3, 4, and 5 mg/L.
applied to evaluate the sample structures and their interac-   These conical flasks were shaken to disperse graphite and
tions according to their absorption spectrum because the       nanographene in the MB solution. At the pH value of 6
molecule and electron exhibit a transition when the photon     and a temperature of 20  C, the solutions in these conical
in incident light was absorbed by the substances. Then,        flasks were stirred and centrifuged using a magnetic stir-
nanographene and graphite were used as adsorbents to           rer at constant temperature. The supernatant liquids were
absorb the MB solution, and their molecule adsorption was      removed, the molecule adsorptions were measured with
detected by the 722N-type visible spectrophotometer. The       the 722N-type visible spectrophotometer, and the absorp-

                                                                                                                                        Article
MB solution concentrations were 1, 2, 3, 4, and 5 mg/L.        tion amounts were calculated, as shown in Figure 7. When
The molecule adsorption of the MB solution in the wave-        the MB solution concentration ranged from 1 mg/L to
length from 200 nm to 900 nm isIP:   192.168.39.211
                                  shown                 On: Tue, 09 Nov 2021 23:13:04
                                         in Figure 6, which    5 mg/L, as  the concentration of MB solution increased, the
                                       Copyright: American Scientific    Publishers
conformed with the following linear equation: Delivered byadsorption
                                                                 Ingenta amount of nanographene increased instantly.
                    y = 0.182x − 0.063                   (1)   Although   the absorption amount of graphite also rose, it
                                                               gradually tended to a balance and no longer increased
where y is the molecule adsorption, and x is the concen-       as the MB solution concentration increased. Therefore,
tration of the MB solution (mg/L). Therefore, MB solution      nanographene has greater absorption effect than that by
concentration displays a good linear variation.                graphite mainly because nanographene has a larger spe-
                                                               cific surface area than that of graphite, which increases the
3.2.1. Effect of MB Solution Concentrations on                 absorption points.
        Sample Molecule Adsorption
Ten copies of graphite and nanographene with the mass
of 20 mg each were placed into ten 150 mL coni-
cal flasks. Ten copies of MB solution with the volume

Fig. 5.   FI-IR spectra diagram of graphite oxide and graphene.    Fig. 6.   Standard curve of MB solution molecule adsorption.

Mater. Express, Vol. 9, 2019                                                                                                      817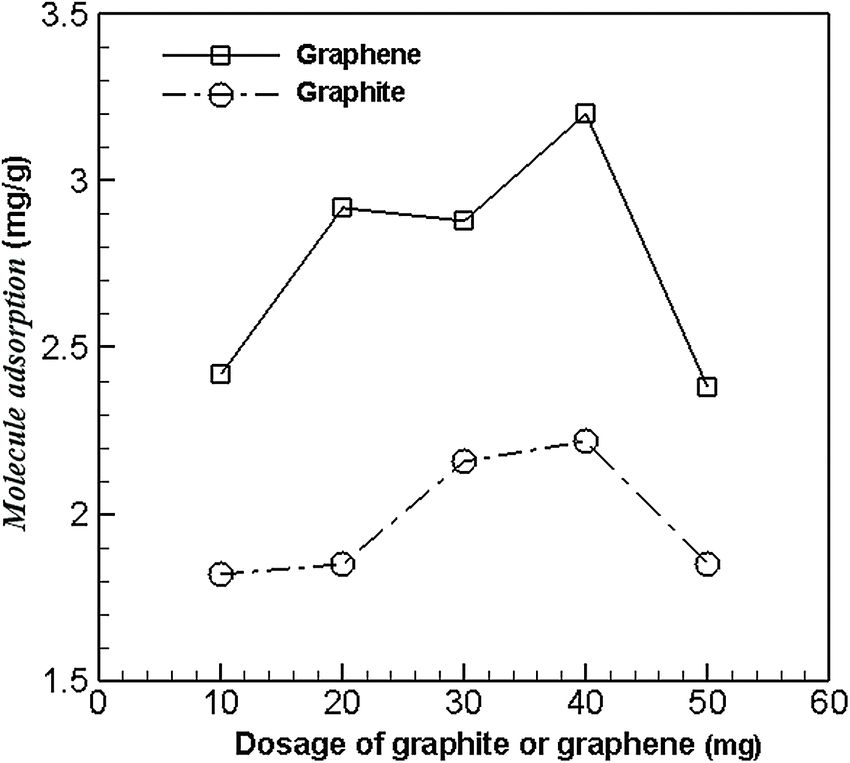
Materials Express Investigation on nanographene generation and its molecule adsorption
Zhang et al.
Fig. 8. Effect of stirring time on graphite and graphene molecule
Fig. 7. Effect of MB solution concentration on graphite and graphene adsorption.
molecule adsorption.
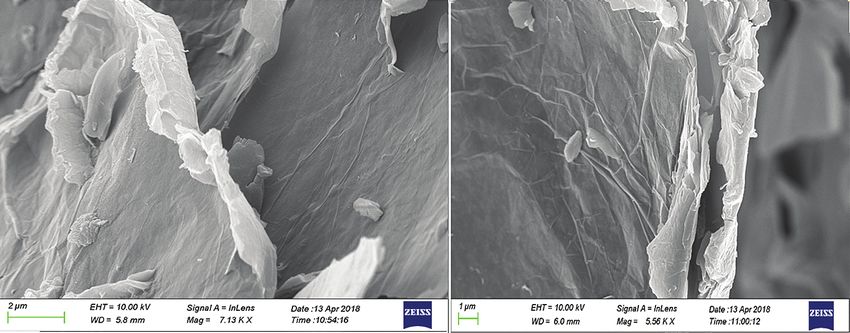
3.2.3. Effect of Graphite and Graphene Dosages on
MB Solution Molecule Adsorption
3.2.2. Effect of Stirring Time on the Molecule
Five copies each of graphite and nanographene respec-
Adsorption of Samples
tively were placed into five 150 mL conical flasks, with
Article
Two copies each of graphite and graphene with 20 mg the masses of 5, 10, 15, 20, and 25 mg, respectively.
mass were placed into two 150IP: mL192.168.39.211
conical flasks sepa-
On: Tue,The MB 2021
09 Nov solutions with the volume of 100 mL and the
23:13:04
rately. Two MB solution copies with the volume ofAmerican
Copyright: 100 mL Scientific Publishers
concentration of 3 mg/L were added into these coni-
each and the concentration of 3 mg/L were placed Delivered
into bycal
Ingenta
flasks. At pH value of 6 of the MB solution and a
two conical flasks. The two conical flasks were shaken to solution temperature of 20 C, the MB solutions were
disperse graphite and graphene in the MB solution. At pH stirred for 120 min and centrifuged using a magnetic stir-
value of 6 and temperature of 20 C, the solutions in the rer at a constant temperature. The supernatant liquids were
two conical flasks were stirred using a magnetic stirrer removed and centrifuged, the graphite and nanographene
at constant temperature. A total of 15 mL of the solu- molecule adsorption were measured by the 722N-type vis-
tion was taken out every 30 min and centrifuged, and then ible spectrophotometer, and their absorption amounts were
its supernatant liquid was removed. The 722N-type visi- calculated. Figure 9 shows the effects of the dosages of
ble spectrophotometer was used to measure the molecule graphite and nanographene on the molecule adsorption
adsorption, and the absorption amounts of graphite and of MB solution. As shown in Figure 9, as the dosage
graphene were calculated. The effects of stirring time of graphite and nanographene increased, the absorption
on molecule adsorptions of graphite and graphene are amounts of nanographene and graphite in the MB solution
shown in Figure 8. The molecule adsorption curve of fluctuated. When the nanographene dosage was 40 mg, its
graphite and nanographene rapidly increased at stirring absorption amount in the MB solution reached its max-
time ofInvestigation on nanographene generation and its molecule adsorption
Zhang et al.
Materials Express
Fig. 10. Effects of the pH value on graphite and nanographene
Fig. 9. Effects of graphite and graphene dosages on MB solution
molecule adsorption.
molecule adsorption.
intensive than that of graphite, and its optimal dosage was occupied the absorption sites with the MB molecules in the
40 mg. MB solution, thereby reducing the absorption amount of
MB molecules on the graphite or nanographene surfaces.
3.2.4. Effect of MB Solution pH on Sample When the pH value of MB solution was 4, the graphite
Article
Molecule Adsorption and nanographene surfaces possessed a large amount of
Five copies each of graphite and IP:nanographene
192.168.39.211 the Tue,negative
withOn: 09 Novcharges, while the MB solution possessed many
2021 23:13:04
Copyright:
mass of 20 mg each were placed five 150 mL conical American Scientific
cationic Publishers
dyes. Thus, graphite and nanographene have a
Delivered
flasks, and the MB solutions with the volume of 100 mL by Ingenta
good adsorption function on the MB solution under the
and the concentration of 3 mg/L were placed into these function of static electricity. Graphite and nanographene
conical flasks. Diluted HCl and NaOH solutions were used also have optimum absorption effects when the pH value
to adjust the pH values of the MB solution to 2, 4, 6, 8, and of the solution is 4.
10, respectively. A treater was placed in each conical flask
and stirred for 120 min, and then the supernatant liquid
4. CONCLUSION
was removed after centrifugation. The molecule adsorp-
An improved oxidation reduction method was used to
tion for each sample was measured with the 722N-type
prepare nanographene. The absorption performances of
visible spectrophotometer, and the absorption amount was
graphene and nanographene were investigated by adjust-
then calculated. Figure 10 shows the effects of the pH
value of the MB solution on the molecule adsorptions of ing the dosages of graphite and nanographene, pH, MB
graphite and nanographene. The absorption amounts of solution concentration, and stirring time to determine their
graphite and nanographene in the MB solution increased molecule adsorption capabilities. The conclusions are sum-
first and then decreased with the increase in the pH value marized as follows:
of the MB solution from 2 to 10. When the pH of MB (1) Given the atmosphere temperature and MB solu-
solution was 4, the absorption curves of graphite and tion (volume of 200 mL and concentration of 1 mg/L),
nanographene showed a peak value and reached the max- the maximum absorption amount of nanographene was
imum value. When the pH value of MB solution was 3.215 mg/g at the nanographene dosage of 40 mg and the
>4, the absorption curves of graphite and nanographene stirring time of 180 min when the pH value of the MB
showed a slowly decreasing trend mainly because the pH solution was 4.
value of MB solution affects the charge distribution on (2) The absorption amount of nanographene was two-
the graphite and nanographene surfaces, thereby causing or threefold higher than that of graphite under the same
the change between graphite or nanographene and the conditions.
MB solution. Both OH− and MB molecules occupied the (3) The prepared nanographene had a good absorption
absorption sites on nanographene and graphite surfaces, performance, large specific surface area, and additional
thereby causing a decrease in the absorption amounts of absorption site points.
MB molecules on graphite or nanographene. When the (5) The nanographene molecule adsorption was larger
pH value of MB solution was 2, a large amount of H+ than that of graphite.
Mater. Express, Vol. 9, 2019 819Materials Express Investigation on nanographene generation and its molecule adsorption
Zhang et al.
Acknowledgments: We are grateful for the support of 9. Zeng, X.F., Wang, M.H., Lu, Y.L., Zhang, Y.L. and Chen, L.,
Project of Science and Technology Department of Shaanxi 2018. Synthesis and enhanced photocatalytic activity of TiO2 pillared
graphene nanocomposites. Powder Metallurgy Technology, 36(2),
Provincial [Grant numbers 2018CG-026], National Natural
pp.130–136.
Science Foundation of China [Grant numbers 51866015] 10. Bi, W.H., Wang, X.Y., Fu, G.W. and Wang, Y.Y., 2015. Review on
and the Project of Guangxi Natural Science Foundation of optical modulator based on graphene. Journal of Yanshan University,
China [Grant numbers 2018JJA160070]. 39(3), pp.189–198.
11. Lu, Z.X., Zhang, L.M., Deng, Y., Li, S. and He, N.Y., 2012.
Graphene oxide for rapid MicroRNAs detection. Nanoscale, 4(19),
References and Notes pp.5840–5842.
1. Andersen, D.R., 2010. Graphene-based long-wave infrared TM sur- 12. Yan, D., Qiu, L.L., Wang, Y.F., Meng, Z.H. and Qi, F.L.,
face plasmon modulator. JOSA B, 27(4), pp.818–823. 2018. Reduced graphene oxide/2D colloidal array composite mem-
brane fabricated layer-by-layer. Chinese Chemical Letters, 29(6),
2. Liu, X., 2011. The first graphene integrated circuit developed suc-
pp.922–926.
cessfully. Frontier Science, 5(2), pp.95–95.
13. Zhang, L.M., Wang, Z.L., Lu Z.X., Shen H., Huang, J., Liu, M., He,
3. Xia, F., Mueller, T. and Lin, Y.M., 2010. Ultrafast grapheme pho-
N.Y. and Zhang, Z.J., 2013. PEGylated reduced graphene oxide as a
todetector. Nature Nanotechnology, 4(12), pp.1–2.
superiorss RNA delivery system. Journal of Materials Chemistry B,
4. Wu, C.X. and Song, Z.L., 2015. One-step hydrothermal synthesis
2+
1(6), pp.749–755.
of grapheme quantum dots and the application for Mn detection.
14. Wang, W.K., Wu, Y.H., Jiang, Z.W., Wang, M.Z. and Ge, X.W.,
Chinese Journal of Luminescence, 36(4), pp.413–418. 2018. Self-assembly of graphene oxide nanosheets in t-butanol/water
5. Liu, T.T., 2016. Synthesis of grapheme with manganese compounds medium under gamma-ray radiation. Chinese Chemical Letters,
via a hydrothermal method and their super-capacitances. Chemical 29(6), pp.931–934.
Reaction Engineering and Technology, 32(2), pp.170–182. 15. Xia, S.J., Dong, J., Chen, Y.Y., Wang, Y.R. and Chen, X., 2018.
6. Wang, L., Zhao, D.D., Liu, X., Yu, P. and Fu, H.G., 2017. Hydrother- Three dimensional phytic acid-induced graphene as a solid-phase
mal for synthesis of CoO nanoparticles/graphene composite as Li-ion microextraction fiber coating and its analytical applications for
battery anodes. Acta Chimiga, 75(2), pp.231–236. nerolidol in tea. Chinese Chemical Letters, 29(1), pp.107–110.
7. Du, Q.L., Zhang, L.F., Zhang, M.B., Cao, J.M. and Wang, S.G., 16. Zhang, X.X., Yang, H.Y., He, J.X., Zhang, Y.C. and, Q. Wang, 2017.
2010. Preparation of functionalized grapheme sheets by ther- Preparation and properties of polylactic acid/graphene composite
mal exfoliation approach and their electrochemical super-capacitive nanofiber. Journal of Biobased Materials and Bioenergy, 11(5),
behavior. Chemical Research, 21(3), pp.18–23. pp.499–504.
Article
8. Sui, H.C., An, Y.L. and Li, F.Q., 2013. Performance analysis of 17. Li, H.M. and Xie, X.M., 2018. Polyolefin-functionalized graphene
graphene prepared by hydrothermalIP: method. Journal of Shenyang
192.168.39.211 On: Tue, 09oxide
Novand 2021its GO/HDPE
23:13:04 nanocomposite with excellent mechanical
Ligong University, 32(3), pp.9–11. Copyright: American Scientificproperties. Chinese Chemical Letters, 29(1), pp.161–168.
Publishers
Delivered by Ingenta
Received: 23 May 2019. Accepted: 27 August 2019.
820 Mater. Express, Vol. 9, 2019You can also read