Measuring the cost and affordability of healthy diets - Will Masters, Tufts University Anna Herforth, Tufts University Rachel Gilbert, Tufts ...
←
→
Page content transcription
If your browser does not render page correctly, please read the page content below

measuring the cost and affordability of healthy diets

                           Will Masters, Tufts University
                          Anna Herforth, Tufts University
                          Rachel Gilbert, Tufts University
                             Yan Bai, The World Bank
        Stevier Kaiyatsa, Ministry of Economic Planning and Development
Agenda
1. Vision, aims and motivation
2. About the Food Prices for Nutrition project
3. Food Price data and metrics
4. Sampling of global results
5. Malawi results
6. What’s next?

Vision
   Food security is when all people, at all times, have physical and economic access to sufficient,
   safe, nutritious food to meet dietary needs and food preferences for an active and healthy life.
                                      – World Food Summit, 1996

  Physical and economic access
    Includes availability and affordability

  Nutritious food to meet dietary needs
     Dietary needs go beyond nutrient needs; dignity, culture, protection of health

      How can we be accountable to this vision without understanding availability and
                            affordability of healthy diets?
An important link between agriculture and nutrition

   Agriculture &
                      Food Access*        Diet Quality   Nutrition
   food systems

                   *Nutritious food to
                   meet dietary needs
Market reliance in Malawi
   •        Nationally, 45-60% of calories, protein, iron, zinc, vit A, folate came from purchases in 2016/17
        •      In urban areas, 80-85%
        •      In rural areas, around 50%

        Average share (%) of calories from different sources, 2016-2017

Source: Adapted from Gilbert, Benson, Ecker 2020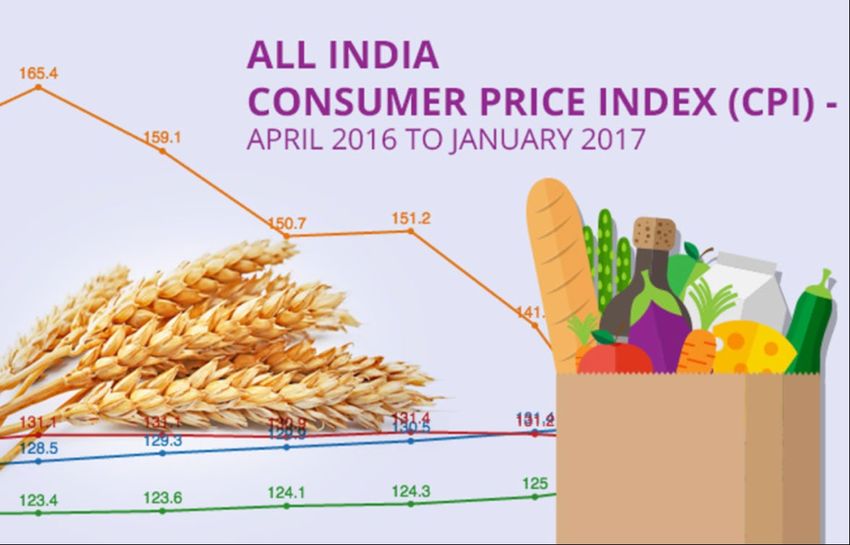
Even rural farm families rely on market purchases for healthy, diverse diets
     Evidence from rural Ethiopia
              Source of calories consumed by month, 2010-11         Shares of food consumed, by food group
                                                                       Purchased
                            Own production

                                                              50%
                                  Purchased

Source: Adapted from Sibhatu and Qaim, 2017
Aims: what do we want to know?
•    If you went to an average market in Malawi, how much would it cost to obtain a healthy diet?
•    How many people in Malawi can afford that cost?

     Photos: W. A. Masters (Ethiopia, Tanzania, Ghana, Morocco) and S. Kaiyatsa (Malawi)
We estimate three least-cost diets using retail prices
•     “Energy sufficient diet” - Cost of Calorie Adequacy (CoCA)
       minimum cost to meet energy requirements using the least expensive, available starchy staple
       food in each country

•     “Nutrient adequate diet” - Cost of Nutrient Adequacy (CoNA)
       minimum cost to meet energy and nutrient requirements (23 macro and micro-nutrients, with upper
       as well as lower bounds)

•     “Healthy diet” - Cost of Healthy (Recommended) Diet (CoRD)
       Minimum cost to meet food-based dietary guidelines, based on food group classifications; a
       behaviorally realistic way to meet nutrient needs and other needs, including proportionality,
       norms, culture, and protection of health against NCDs
Least-cost diets
•        Most affordable (cheapest, lowest cost) combination of foods that meet the criteria of these diets
•        These diets provide a conservative estimate (lower bound) on the cost per day
     •      Preferences or convenience would add to the cost
•        No standard “food basket”
     •      Foods chosen depend on time and place
     •      Seasonal or locally-available foods selected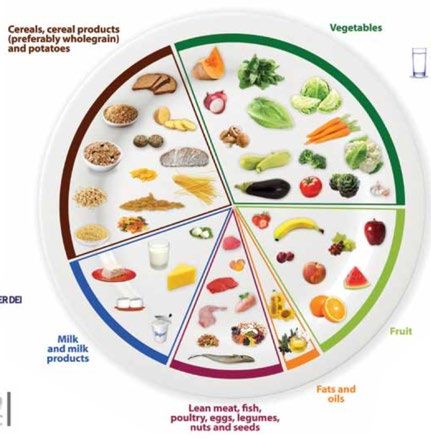
Food prices create a ladder of affordability
    When all diets are affordable, food prices are one of many influences on food choice.
       When healthy diets are unaffordable, food prices are an insurmountable barrier to
       improved diet quality.
                                                             Other goals (food safety,
                                                             convenience, preferences)
                                              Healthy diets
                                              (meet food group recommendations)
                                   Nutrient adequacy
                                   (avoid deficiencies or excesses of essential nutrients )
                     Caloric adequacy
                     (short-term subsistence)
                                                         Source: Food Prices for Nutrition, October 2020
How does Food Prices for Nutrition differ from other initiatives?
• Emphasis on monitoring
• Focus on leveraging the abundance of data collected in existing national (CPI) and
international monitoring systems
• Support countries to calculate metrics within their own data systems
• Moving beyond nutrients to look at healthy diet patterns
• Cost of a Healthy Diet does not rely on linear programming relative ease of
computationWFP Fill the Nutrient Gap
has focused on the nutrient-adequate diet (CotD) to date
Engage multi-sectoral
Align stakeholder priorities to: Inform Government
platforms to:
Create synergies policies and UN country
• Strengthen &
Leverage opportunities strategy & programming
• Reposition actions across
towards multi-sectoral actions to improve delivery on
the food system and
to improve diets nutrition
environmentSpecifics of the Food Prices for Nutrition project
Food Prices for Nutrition is…
•   A four-year project to promote use of food prices to measure diet costs and affordability (2020-2024)

•   Building on two previous projects to develop the price indices and diet cost metrics
     •   Indicators of Affordability for Nutritious Diets in Africa (IANDA, 2015-2017)
     •   Changing Access to Nutritious Diets in Africa and South Asia (CANDASA, 2017-2020)
PURPOSE: Scale up monitoring and analysis of food prices, to guide
agricultural production and food markets for improved nutrition
Model impacts of
Provide tools and Support use of the
policies and programs
methods for users to metrics within
that could affect food
calculate the metrics countries
prices
Support use of the
metrics across
Global online hub on countries
food prices for nutrition Training courses
hosted by the
World BankFocus countries
1. Bangladesh
2. Burkina Faso
3. Ethiopia
4. Ghana
5. India
6. Malawi
7. Nigeria
8. Pakistan
9. TanzaniaFood Prices for Nutrition team https://sites.tufts.edu/foodpricesfornutrition/team/
Food Prices for Nutrition (FPN) online hub
•        A one-stop shop to access the project’s results,
         underlying data used, and accompanying
         methodological documentation
     •      Provide downloadable diet cost and affordability indices +
            possible food price data with registration
     •      Disseminate protocols and software tools, designed for use
            along with the FPN eLearning materials on OLC
     •      Maximize visibility and use of these data by national
            governments and development agencies.
•        To be located within the World Bank websites:
     •      Access via data.worldbank.org (4.3M visits, the last 52
            weeks) and icp.worldbank.org (36k visits, the last 52 weeks)
Food Prices for Nutrition (FPN) eLearning course
• Hosted on the World Bank’s Open Learning Campus (OLC) platform
• The OLC is an open-access online platform of the World Bank – knowledge sharing to global and national policy makers
• Since 2015, the OLC has offered over 450 courses covering different themes and reaching more than 250k learners in
190 countries
• 180-minute self-paced course to train government
officials, program planners, researchers, and others
• Construction of diet cost indices (Module 1)
• Use and potential applications of diet cost indices in
relation to policy making (Module 2)
• Self-paced course using narration, text, visualizations,
video interviews by subject experts, worked examples and
summary quizzes
• Official launch by August 31st, 2022Data, Metrics and Methods
Data inputs needed
                         Calorie    Nutrient   Healthy/Rec.
                        Adequacy   Adequacy       Diets
Data types               (CoCA)     (CoNA)       (CoRD)
Price data                  X          X            X
Energy requirements        X          X
Nutrient requirements                 X
Food composition data      X          X
Dietary guidelines                                  X
Food price data: national governments’ CPI data
• Main data are food prices collected by national governments
• Used for measuring inflation via Consumer Price Index (CPI)
• Generally, these prices are collected:
• By national statistical offices
• At nationally representative market locations
• On a monthly basis
• CPI is generally weighted by share of total expenditure, so culturally
acceptable, commonly consumed food items are trackedFood price data: global dataset
• World Bank’s International Comparison Program (ICP) Number of Participating Countries
250
dataset
• A worldwide statistical initiative led by the World Bank in 199
200
partnership with other international organizations 176
• Data collected primary for estimating purchasing power parities 146
150
(PPPs) for the world’s economies 115
• Nine ICP comparisons have been conducted to date: 1970 | 1973 |
100
1975 | 1980 | 1985 | 1993 | 2005 | 2011 | 2017 | 2021 (ongoing) 64
60
• The ICP 2017 global item list included 208 foods & beverage items 50 34
+ regional specific list 16
10
• Items limited to comparable products sold in multiple countries 0
with high-level of comparability and quality 1970 1980 1990 2000 2010 2020
• Provides a national annual average price per itemOther price data sources
• Household expenditure survey data
• Used to calculate food unit costs for purchased items
• Caveat: Surveys done every 5-10 years in many countries
• Market information systems (MIS) typically track farm-gate, wholesale, and/or retail prices of
commodities for producers and traders
• Ministries of Agriculture or Trade may have this system
• Caveat: usually does not include processed foods
• Vulnerability assessments track consumer prices to guide interventions
• World Food Programme Vulnerability Assessment and Mapping system (VAM)
• Famine Early Warning System network (FEWS NET)
• Caveat: In most cases, a small number of items are includedCalculating the Cost of Nutrient Adequacy
Data inputs needed
                           Calorie    Nutrient   Healthy/Rec.
                          Adequacy   Adequacy       Diets
  Data types               (CoCA)     (CoNA)       (CoRD)
  Price data                  X          X            X
  Energy requirements        X          X
  Nutrient requirements                 X
  Food composition data      X          X
  Dietary guidelines                                  X
Data inputs needed: Food composition data
• Provides nutrient and calories for each food
• Edible portion info needed to adjust for weight of
items like pit of avocado, banana peels
• Detailed nutrient data only necessary for cost of
nutrient adequate diet (CoNA)
Source: MAFOODS, 2019Data inputs needed: Energy and nutrient requirements
• Estimated energy requirements (EERs) based on age, sex, and level of physical activity
• Median weights and heights of the World Health Organization (WHO) reference population
• Macronutrients
• Protein, fats, carbohydrates from the Acceptable Macronutrient Distribution Range (AMDR)
• Micronutrients
• Global harmonized average requirements and upper levels (Allen, Carriquiry and Murphy, 2019)
• Sodium: Chronic Disease Risk Reduction Intake (CDRR) limits (IOM, 2006)
• Linear programming used to determine the lowest cost combination of foods that meet requirements
Schneider, Kate, and Anna Herforth. “Software Tools for Practical Application of Human Nutrient Requirements in Food-Based
Social Science Research.” Gates Open Research 4 (December 10, 2020): 179. https://doi.org/10.12688/gatesopenres.13207.1.Calculating the Cost of a Healthy Diet
Data inputs needed
                           Calorie    Nutrient   Healthy/Rec.
                          Adequacy   Adequacy       Diets
  Data types               (CoCA)     (CoNA)       (CoRD)
  Price data                  X          X            X
  Energy requirements        X          X
  Nutrient requirements                 X
  Food composition data      X          X
  Dietary guidelines                                  X
Food-based dietary guidelines (FBDG)
Near East, 4 Africa, 7
• >90 countries have FBDG
North America, 2 • Many FBDG are not quantitative
• Malawi does not have its own FBDG
Asia and the
LAC, 27
• FAO maintains FBDG repository
Pacific, 17
Europe, 33
Source: Herforth, et al., 2019Jamaica Argentina
India
Malta
EAT-Lancet
Vietnam
China
Benin U.S.A. Oman NetherlandsCalculating the cost of a healthy diet 1. Categorize each food in food price list according to the food groups in the selected FBDG 2. Remove the following items: • Those not required for a healthy diet (e.g. sweets, sugar sweetened beverages, condiments) • Remove duplicate items, keeping only the lowest cost item (i.e., keep local rice, drop imported rice) 3. Multiply price/kg by the amount required per day in kg (accounting for edible portion), to find the price per day for each item 4. Take the average of the 1-3 lowest cost items (price/day) in each food group • 1 item for oils, 2 for fruits, 3 for veg 5. Sum the cost of all food groups
Affordability of diets
•        Affordability: Comparison of cost to a defined income standard

1. Poverty lines
     •      National
     •      International (US $1.90)
2. Expenditures (food, total)
3. Incomes
4. Wages
     •      Compared to unskilled wages in India, Ethiopia                Photo (CC): skuarua
Sampling of Results
$1.90

                                                                                       $1.20

Healthy diets by any definition are far more expensive than the entire international
poverty line of $1.90…let alone the upper bound portion of the poverty line that can
credibly be reserved for food of $1.20.
3 billion
Calorie affordability is
people still a problem in some
globally countries
lack sufficient
income to purchase Most people in sub-
Saharan Africa cannot
the least-cost form afford nutrient
of healthy diets adequate diets
recommended by 596 million
national Most people in sub-
1.3 billion
governments. Saharan Africa and
326 million South Asia cannot
829 million
afford healthy dietsOverview of SOFI 2020 results in focus countries (USD)
Energy sufficient diet Nutrient adequate diet Healthy diet
Cost % of % pop. Cost % of % pop. Cost % of % pop.
(USD) food cannot (USD) food cannot (USD) food cannot
2017 exp afford 2017 exp afford 2017 exp afford
Bangladesh 0.64 14.5 0.1 1.63 36.7 18.9 3.54 79.6 74.6
Burkina Faso 0.45 28.2 0.1 2.16 136.1 70.4 3.63 228.5 89.5
Ethiopia 0.58 40.5 1.7 1.94 136.9 47.7 3.39 238.7 84.0
Ghana 0.82 50.1 5.3 2.08 126.3 26.5 4.65 282.5 64.9
India 0.79 27.3 0.9 1.90 66.0 39.1 3.41 118.2 77.9
Malawi 0.28 21.9 1.3 1.33 102.2 70.5 2.85 219.1 93.7
Nigeria 0.94 15.8 33.3 2.01 34.0 72.2 3.79 64.1 91.1
Pakistan 0.77 20.9Results from Malawi
Do remote rural people pay higher prices for
          more nutritious foods?

                     Stevier Kaiyatsa
  Economist, Ministry of Economic Planning and Development
Using price data from the National Statistical Office
• Use food prices to compute calorie sufficient and nutrient
adequate diets in Malawi
• Prices for 55 food items collected over 129 months from 2007-
2017 in 29 locations
• 17 markets at the centre of the district – “boma” / “rural town”
• 12 markets away from the centre of the district – “remote”Comparison of nutrient and caloric adequacy, by market type
(2007-2017)
• Difference in overall cost of a nutritious diet is about 8% higher in boma markets (1.61 USD/day
in 2011 US$ PPP terms) than in rural markets (1.48 USD) (pOverall findings
• Costs of energy sufficient and nutrient adequate diets are systematically lower in more remote rural
markets than boma markets
• Differences due to lower prices in several food categories in rural remote markets:
• Dried chambo and utaka
• Beef
• Powdered milk
• Chicken eggs
• Only fresh chambo is systematically more expensive in more rural remote marketsSeasonality of diet costs in Malawi
Yan Bai
Consultant, World Bank, ICP teamSpatiotemporal variation of CoNA in Malawi
• 5 districts had seasonal intensity > 20%
• Dowa - seasonal intensity of 35%
• Relatively low intensity of seasonality for
starchy staples
• Fruits and vegetables display significant,
intense seasonality
Source: Bai, Naumova and Masters (2020)Overall findings
• Cost of Nutrient Adequacy: 130 MWK per adult woman per day
• USD $1.21 (2011 PPP)
• Nutrient adequacy is 3x more expensive than subsistence on maize alone
• Significant seasonality for 31 of 48 food items in Malawi
• Fruits and vegetables generally have stronger seasonality than other food groups
• Animal-source foods have the lowest seasonality
• Reducing & stabilizing cost of nutritious foods is important for consumers and farmers who use
markets to complement what they grow
Source: Bai, Naumova and Masters (2020)What’s next?
Next steps in Food Prices for Nutrition

•     Updated estimates for SOFI 2021 expected in June/July

•     Agriculture, Nutrition and Health (ANH) Academy Week Learning Lab in June

•     Generating tool and guides for data holders to compute Cost of a Healthy Diet
      themselves

•     World Bank eLearning course coming next year, August 2022
Food price interest groups We will be reaching out in the coming months to share: 1. Tools to calculate the cost of a healthy diet 2. New results from the SOFI report 3. More information regarding the launch of the World Bank eLearning course Reach out with questions or interest – Rachel.gilbert@tufts.edu Google Form
Thank you to our donors

This project is funded as INV-016158 by the Bill & Melinda Gates
Foundation and UKAid, through the Foreign, Commonwealth &
Development Office of the United Kingdom.
References
1.  Bai, Yan, Elena N. Naumova, and William A. Masters. “Seasonality of Diet Costs Reveals Food System Performance in East Africa.” Science Advances 6, no. 49 (December 1, 2020): eabc2162.
    https://doi.org/10.1126/sciadv.abc2162.
2. Beal, Ty, Jessica M White, Joanne E Arsenault, Harriet Okronipa, Guy-Marino Hinnouho, and Saul S Morris. “Comprehensive Nutrient Gap Assessment (CONGA): A Method for Identifying the Public
    Health Significance of Nutrient Gaps.” Nutrition Reviews 79, no. Supplement_1 (April 1, 2021): 4–15. https://doi.org/10.1093/nutrit/nuaa140.
3. Cost of Nutritious Diets Consortium, 2018. Indicators and tools for the cost of nutritious diets. Boston, MA: Tufts University (13 pages, 31 May 2018).
    https://sites.tufts.edu/candasa/files/2018/05/CostOfNutritiousDiets-CollaborativeBrief_31May2018.pdf
4. FAO, IFAD, UNICEF, WFP, and WHO. The State of Food Security and Nutrition in the World 2020: Transforming Food Systems for Affordable Healthy Diets. The State of Food Security and Nutrition
    in the World (SOFI) 2020. Rome: FAO, IFAD, UNICEF, WFP and WHO, 2020. http://www.fao.org/documents/card/en/c/ca9692en.
5. Gilbert, Rachel, Todd Benson, and Olivier Ecker. “Are Malawian Diets Changing? An Assessment of Nutrient Consumption and Dietary Patterns Using Household-Level Evidence from 2010/11 and
    2016/17.” IFPRI Malawi Working Paper. Washington DC: International Food Policy Research Institute, 2019. http://ebrary.ifpri.org/cdm/ref/collection/p15738coll2/id/133522.
6. Herforth, Anna, Mary Arimond, Cristina Álvarez-Sánchez, Jennifer Coates, Karin Christianson, and Ellen Muehlhoff. “A Global Review of Food-Based Dietary Guidelines.” Advances in Nutrition 10,
    no. 4 (July 1, 2019): 590–605. https://doi.org/10.1093/advances/nmy130.
7. Herforth, Anna, Yan Bai, Aishwarya Venkat, Kristi Mahrt, Alissa Ebel, and William A Masters. Cost and Affordability of Healthy Diets across and within Countries: Background Paper for The State o
    Food Security and Nutrition in the World 2020. FAO Agricultural Development Economics Technical Study, No. 9. Rome, Italy: Food & Agriculture Org., 2020.
    http://www.fao.org/documents/card/en/c/cb2431en/.
8. Kaiyatsa, Stevier, William A. Masters, Yan Bai, Kate Schneider, and Anna Herforth. “Do Remote Rural People Pay Higher Prices for More Nutritious Foods? Evidence from 130,975 Price
    Observations at Rural Markets in Malawi, 2007-2017.” In 2019 Annual Meeting, July 21-23, Atlanta, Georgia. Atlanta, GA: Agricultural and Applied Economics Association, 2020.
    https://doi.org/10.22004/ag.econ.290957.
9. MAFOODS. 2019. Malawian Food Composition Table. 1st Edition. Averalda van Graan, Joelaine Chetty, Malory Jumat, Sitilitha Masangwi, Agnes Mwangwela, Felix Pensulo Phiri, Lynne M. Ausman,
    Shibani Ghosh, Elizabeth Marino-Costello (Eds). Lilongwe, Malawi.
10. Schneider, Kate, and Anna Herforth. “Software Tools for Practical Application of Human Nutrient Requirements in Food-Based Social Science Research.” Gates Open Research 4 (December 10,
    2020): 179. https://doi.org/10.12688/gatesopenres.13207.1.
11. Sibhatu, Kibrom T., and Matin Qaim. “Rural Food Security, Subsistence Agriculture, and Seasonality.” PloS One 12, no. 10 (2017): e0186406. https://doi.org/10.1371/journal.pone.0186406.
You can also read