Food Prices for Nutrition in India: Measuring and monitoring the cost and affordability of healthy diets - Tufts University
←
→
Page content transcription
If your browser does not render page correctly, please read the page content below
Food Prices for
   Nutrition in India:
Measuring and monitoring the cost
 and affordability of healthy diets

      Rachel Gilbert, Tufts University
      Dr. Kalyani Raghunathan, IFPRI

             1 September 2021

    https://bit.ly/foodpricesfornutrition   Photo Credit: IFPRI, 2008
Vision                                                                       Availability
                                                                             Affordability
 Food security is when all people, at all times, have physical and economic access to
   sufficient, safe, nutritious food to meet dietary needs and food preferences for an
                    active and healthy life. – World Food Summit, 1996
                                            Nutrient needs
                                                Dignity
                                                Culture
                                          Protection of health

         Accountability requires understanding availability and affordability of healthy diets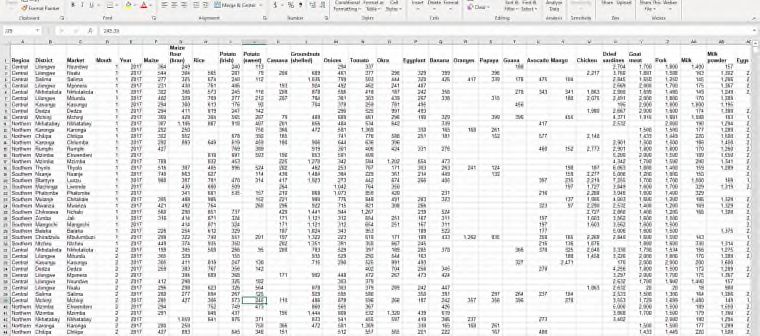
Aims: what do we want to know?

•    If you went to the market in India, how much would it cost to obtain nutritious food to meet
     dietary needs?
•    How many people in India can afford that cost?

    Photos: W. A. Masters (Ethiopia, Tanzania, Ghana, Morocco) and S. Kaiyatsa (Malawi)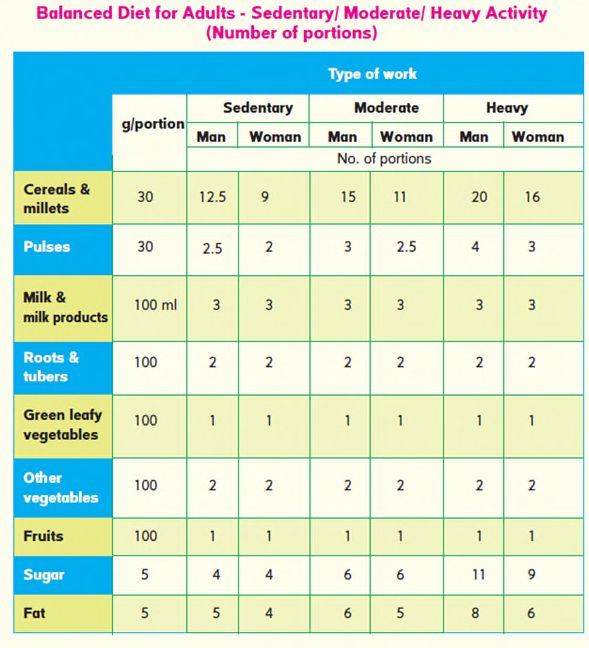
Even rural households rely on market purchases for healthy, diverse diets

                                                                                   Vegetables
                                                                                    Oils
                                                                                    Pulses
                                                                                  Meat, fish, egg

Source: Gupta, Vemireddy, Singh and Pingali, 2021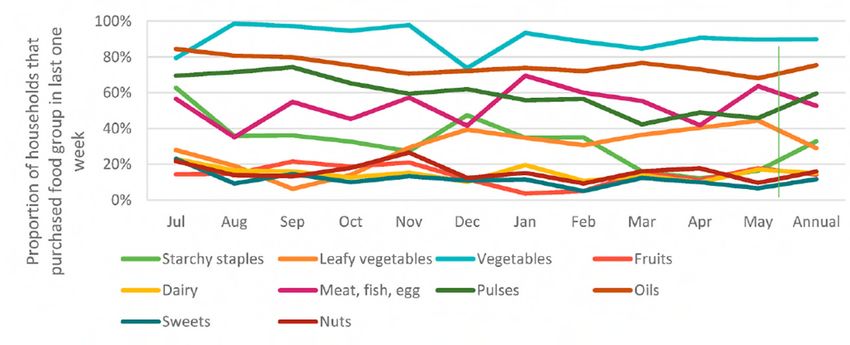
We estimate three least-cost diets
•   “Energy sufficient diet” - Cost of Calorie Adequacy (CoCA)
     o Minimum cost to meet energy requirements using the least expensive, available starchy staple
       food in each country
•   “Nutrient adequate diet” - Cost of Nutrient Adequacy (CoNA)
     o Minimum cost to meet energy and nutrient requirements (23 macro and micro-nutrients, with
       upper as well as lower bounds)
•   “Healthy diet” - Cost of Healthy (Recommended) Diet (CoRD)
     o Minimum cost to meet food-based dietary guidelines, based on food group classifications; a
       behaviorally realistic way to meet nutrient needs and other needs, including proportionality,
       norms, culture, and protection of health against NCDs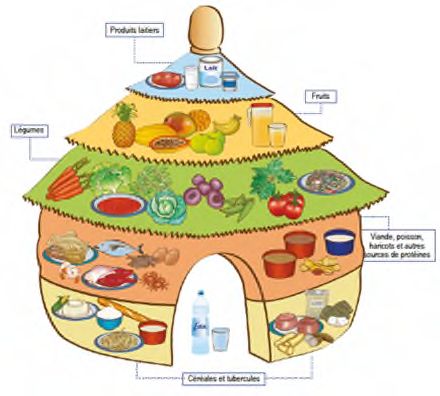
Least-cost diets
•   Most affordable (cheapest, lowest cost) combination of foods that meet the criteria of
    these diets

•   No standard “food basket”
    o   Foods chosen depend on time and place
    o   Seasonal or locally-available foods selected

•   These diets provide a conservative estimate (lower bound) on the cost per day
    o   Preferences or convenience would add to the cost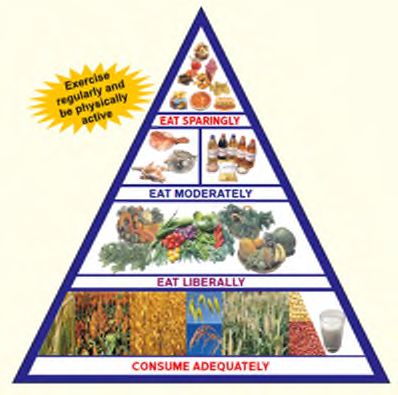
Most common items in cost of healthy diet by state in India

Source: Raghunathan, Headey, and Herforth, 2020
Least-cost diets
•   Most affordable (cheapest, lowest cost) combination of foods that meet the criteria of
    these diets

•   No standard “food basket”
    o   Foods chosen depend on time and place
    o   Seasonal or locally-available foods selected

•   Provide a conservative estimate (lower bound) on the cost per day
    o   Preferences or convenience would add to the cost
Food prices create a ladder of affordability
  When all diets are affordable, food prices are one of many influences on food choice.
    When healthy diets are unaffordable, food prices are an insurmountable barrier to
    improved diet quality.
                                                          Other goals (convenience,
                                                          preferences)
                                            Healthy diets
                                            (meet food group recommendations)
                                 Nutrient adequacy
                                 (avoid deficiencies or excesses of essential nutrients)
                   Caloric adequacy
                   (short-term subsistence)
                                               Source: Food Prices for Nutrition, October 2020
Food price data and methods
Examples of price data
Prices collected by agri-food agencies
• Market information systems (MIS)
      o   Farm-gate, wholesale, or retail prices of basic commodities (rarely processed foods)
•    Early warning systems (EWS) to guide food aid & emergency interventions
      o   Prices of staple or basic foods, at markets in vulnerable areas (rapid availability, but few foods)

 Prices collected by national statistical organizations
• Consumer Price Index (CPI) - In India, Ministry of Statistics and Programme Implementation
      o   Prices of frequently consumed products, collected monthly in various markets
•    World Bank International Comparison Program (ICP) has unique global dataset of retail prices
      o   Items limited to comparable products sold in multiple countries; national annual average price per item
Food price data: national government CPI data
• Main data are food prices collected by national governments
o Used for measuring inflation with the Consumer Price Index (CPI)
o In India, for at least 100 food items
o Collected on a monthly basis
• CPI is generally weighted by share of total expenditure, so
culturally acceptable, commonly consumed food items are
tracked.Calculating the Cost of Nutrient Adequacy
Linear programming
Combine with to calculate
Food price data food composition cheapest diet that
data meets nutrient and
energy requirementsEnergy and nutrient requirements
• Energy requirements based on age, sex, and level of physical activity
• Acceptable ranges for macronutrients - protein, fats, carbohydrates
• Lower and upper bounds for 23 micronutrients + upper bound for sodium
Schneider, Kate, and Anna Herforth. “Software Tools for Practical Application of Human Nutrient
Requirements in Food-Based Social Science Research.” Gates Open Research 4 (December 10, 2020):
179. https://doi.org/10.12688/gatesopenres.13207.1.Calculating the cost of a healthy diet
• Healthy diet is operationalized as a
recommended diet, based on
quantitative food-based dietary
guidelines (FBDG)
• ~100 countries have FBDG; FAO
maintains FBDG repository
o Only some are quantitative
India Benin VietnamIndia’s quantitative food-based dietary guidelines
• Food groups
• Number of portions per day
• Grams per portion
Source: National Institute of Nutrition, 2011Steps to calculate the cost of a healthy diet 1. Categorize each food in food price list according to the food groups in the selected dietary guideline 2. Remove items not required for a healthy diet (e.g., sweets) and duplicate items 3. Calculate price per day for each item • price per kilogram x recommended quantity per day (accounting for edible portion) 4. Take the average of the 1-3 lowest cost items (price/day) in each food group 5. Sum the cost for all food groups
Affordability of diets

Affordability is the comparison of cost to a defined income standard
• Poverty lines
    o   National
    o   International (US $1.90)
•   Food expenditures
•   Income
•   Wages                                                              Photo (CC): skuarua

    o   Compared to unskilled wages in India, Ethiopia
SOFI 2020: Healthy diets by any definition are far more expensive than the entire
international poverty line
>$3.50
Median cost of 10 guidelines
$1.90 (Food and non-food IPL)
$1.20 (Approx. food only IPL)
Source: FAO, 2020How does Food Prices for Nutrition differ from other initiatives?
• Emphasis on monitoring
• Focus on leveraging the abundance of data already collected in
existing national and international monitoring systems
o Support countries to calculate metrics within their own data systems
• Moving beyond nutrients to look at healthy diet patterns
• Cost of a Healthy Diet does not rely on linear programming
relative ease of computationNational applications
Dr. Kalyani Raghunathan
International Food Policy Research Institute (IFPRI)Affordability of nutritious diets in India
Calculate the Cost of a
Recommended Diet (CoRD)
India’s FBDG: 6 food groups, portion We add in information on wages to
size and number of portions for each assess how the affordability of diets
o Men and women, by activity intensity has changed over time
The National Sample Survey (NSS) Wage information from the same
Rural Price and Wage data collected dataset – in cash and kind, for men
by MoSPI and women
o Time-span: October 2001-June 2011 Data for 18 different occupations
(but October 2007-June 2009 missing)
o We use wages of unskilled labourers as a
o Geography: 24 states, 380 districts good proxy for income of the poor
o Price data: covers 101
items/commoditiesAffordability of nutritious diets in India
Calculate the Cost of a We add in information on wages to
Recommended Diet (CoRD) assess how the affordability of diets
India’s FBDG: 6 food groups, portion has changed over time
size and number of portions for each Wage information from the same
o Men and women, by activity intensity dataset – in cash and kind, for men
The National Sample Survey (NSS) and women
Rural Price and Wage data collected Data for 18 different occupations
by MoSPI
o We use cash wages of unskilled
o Time-span: October 2001-June 2011 labourers as a good proxy for income of
(but October 2007-June 2009 missing) the poor
o Geography: 24 states, 380 districts
o Price data: covers 101
items/commoditiesPrice per serving over time • Dairy has the highest average price per serving at both time points, followed by fruits and vegetables • Both the average price per serving and the dispersion by food item increased in 2011 relative to 2001
CoRD increased more than three-fold (in real terms)
                      60
                                                                                                    50.7
                      50                                                                  46.0
   Cost in 2011 INR

                      40                                                           37.9

                                                                                                           Dairy is the
                      30
                                                                     23.6                                  biggest
                                                              19.6
                      20                 16.7   16.6   17.8                                                contributor to
                           13.9   14.2
                                                                                                           overall cost
                      10

                       0
                           2001   2002   2003   2004   2005   2006   2007   2008   2009   2010      2011
                           Cereals                             Proteins
                           Dairy                               Fruit
                           Vegetables                          Dark-green leafy vegetables
                           Oils & fats                         Average Cost of a Recommended Diet
Real wages have gone up more for men; affordability is worse
for women
Men
Women
Women
Men
Real wages (hours adjusted) have increased Diets cost 50-60% of men’s daily wages, 80-
for both men and women, more for men 90% of women’s daily wages.Season matters: Prices highest, affordability lowest June-August
0.3 Leafy veg
0.25
0.2 Fruit
0.15 Vegetables
0.1
0.05
0
-0.05
-0.1
-0.15
A. Prices by food group B. CoRD relative to wages, for menHow affordable were these diets pre-COVID?
Indicator Estimates
Food and non-food costs
Cost of Recommended Diet - women, June 2011 (2011 rupees) 45.1
Purchasing power parity conversion factor, 2011 (2011 PPP$) 14.98
CoRD - women, June 2011 (2011 PPP$) $3.01
Assumed requirements for non-food expenditure (2011 PPP$) $0.63
HH spends ALL their income on food
Estimate 1 (lower benchmark)
Rural population unable to afford $3.01 CoRD
63.3%
(poverty headcount)
Gap between expenditure of CoRD-poor and CoRD
20.0%
(poverty gap)
Adding a 63 cent/day non-food spending requirement
Estimate 2 (upper benchmark)
Rural population unable to afford $3.01 CoRD + $0.63 non-food expenditures
76.2%
(poverty headcount)
Gap between average expenditure of CoRD-poor and CoRD + non-food spending
28.7%
requirements (poverty gap)Media coverage: we got “lucky” with the timing!
Updated analyses: what should we expect post COVID-19?
Studies* noted adverse initial impacts on food supply in 2020
o Temporary closure of wholesale markets and disruptions to inter-state trade
o Loss of migrant labour, which moved back home during the crisis
o Initial increases in prices of pulses, oils, vegetables, with some signs of recovery after ~6
weeks
More importantly, rising unemployment rates and falling HH incomes
o Huge spike in the unemployment rate right after the lockdown, peaking at ~24% in
May with slow recovery since
o Some suggestive evidence that job loss was worse for women than for men
o Evidence also of increased informality/self-employment in post-lockdown transitions
o An estimated 230 million additional individuals fell below the national minimum wage
poverty line (of ~$5 per day)
[*Narayanan & Saha (2020), Lowe & Roth (2021), Rawat and Verma (2020), Mahajan and Tomar (2020)]India: COVID-19 cases, policy stringency & residential mobility
We want to see how prices relate to actual mobility, not policy proxies
100 120,000
Stringency & residential mobility indices (0-100)
C19 policy
stringency index 100,000
Confirmed C19 cases per day
80
80,000
60
60,000
Residential mobility New C19 cases
40
40,000
20
20,000
0 0
Jan-20 Feb-20 Mar-20 Apr-20 May-20 Jun-20 Jul-20 Aug-20 Sep-20 Oct-20 Nov-20 Dec-20 Jan-21Data – new sources, urban focus
• Daily retail and wholesale • Daily retail & wholesale • Weekly retail prices
• 22 commodities • 24 commodities: • 46 commodities
PRICES
• Common foods only • fruits & vegetables • Wide range of foods
• 122 urban centres • 31 urban centres • 75 urban centres
Department of National Horticulture
Ministry of Agriculture
Consumer Affairs Board
• Weekly district-level dataset: January 2018 - January 2021
• Retail prices for 68 commodities from 149 urban centres in 141 districts in 33 states
• Deflated using state-month level general urban CPI
MOBILITY
• Data on consumer mobility from Google Community Mobility Reports.
• Results here use the inverse of the residential mobility measure; catch-all ‘going out’ mobility index
• Could reflect policy restrictions, or consumer behavioral responses, or bothData – new sources
• Daily retail and wholesale • Daily retail & wholesale • Weekly retail prices
• 22 commodities • 24 commodities: • 46 commodities
PRICES
• Common foods only • fruits & vegetables • Wide range of foods
• 122 urban centres • 31 urban centres • 75 urban centres
Department of National Horticulture
Ministry of Agriculture
Consumer Affairs Board
• Weekly district-level dataset: January 2018 - January 2021
• Retail prices for 68 commodities from 149 urban centres in 141 districts in 33 states
• Deflated using state-month level general urban CPI
MOBILITY
• Data on consumer mobility from Google Community Mobility Reports.
• Results here use the inverse of the residential mobility measure; catch-all ‘going out’ mobility index
• Could reflect policy restrictions, or consumer behavioral responses, or bothHypotheses: how are prices related to mobility?
“Perishables hypothesis”: Significantly different price responses for
perishable and non-perishable foods
o Perishable foods have supply chains more vulnerable to disruptions
o Demand for non-perishable foods could increase during C19, hoarding
“Adaptation hypothesis”: Price dynamics during “surprise lockdown” may
be very different to post-lockdown “new normal”
o Policy makers and implementers often got it wrong during lockdown
o Traders and retailers adapt: e.g. digital platforms, ICTs, home delivery
“City-size hypothesis”: differences between small and large cities
o Some mega-cities more drastically affected by C19 and had stricter prevention measures
o Some smaller cities may be more closely connected to rural markets, with shorter supply chains
o However, response quite disparate across cities of different sizes; priors are somewhat ambiguousMobility by city-size classifications
Residential mobility (inverted) Grocery/pharmacy mobility
• Mobility patterns for residential and grocery/pharmacy mobility similar cities of different sizes
• Grocery mobility recovers to pre-COVID levels faster
• But percentage reductions in mobility are positively correlated with city size
• Largest reductions in megacities
9/1/2021 • Smallest in small cities 35Evolution of retail prices by food group over 2020
Vegetable prices highly
volatile (normal?)
Pulse prices rose 10-20%
after lockdown imposed;
prices of animal-sourced
foods actually fell by about
10%
Modest increase in cereal
prices & oil prices
Decline in fruit prices after
lockdown imposed
Little/no change in dairyHow are price and mobility deviations related?
Lockdown months
• Cereals, oils, pulses show little movement (non-perishables, can be and usually are stored);
• Greater impacts for perishables and semi-perishables – animal sourced foods, fruits and vegetables.
• We also see some distinct patterns for larger cities (not shown here)Summary of findings on price and mobility
Perishables hypothesis: partially confirmed, with prices of vegetables
increasing during lockdown, but fruit prices declining, while cereal/oil prices
increased only marginally
Adaptation hypothesis: substantially confirmed. Lockdown periods generally
show larger elasticities between mobility and prices, but these converge to
some new normal over time, often quite quickly
Small vs big cities hypothesis: partially confirmed. Larger cities often had
quite different prices responses in early 2020:
o Dairy & fruit prices went down in large cities only: likely reflect demand shocks more
than supply-shocks + great demand falls in larger cities
o Cereal prices seemed to fall in large cities onlyImplications for cost of diet work (ongoing)
Our earlier work suggests that the
biggest contributors to cost are
o dairy (2020: little change overall, fall in
price in largest cities)
o vegetables (2020: increase in prices)
o cereals (2020: marginal increase)
Possible that the cost of a
recommended diet has gone up,
especially in smaller cities
Adaptation or “recovery” has also taken
longer in the smaller citiesQuestions?
Next steps in Food Prices for Nutrition
    Project purpose: Scale up monitoring and analysis of food prices, to guide agricultural
    production and food markets for improved nutrition

     Support use of new           Build a global system to         Analyze change in cost
    metrics in high-priority      monitor change in food             and affordability of
          countries                  prices for nutrition               healthy diets

       Actively disseminate data and results on food prices, diet costs, and affordability
Thank you to our donors This project is funded as INV-016158 by the Bill & Melinda Gates Foundation and UKAid, through the Foreign, Commonwealth & Development Office of the United Kingdom.
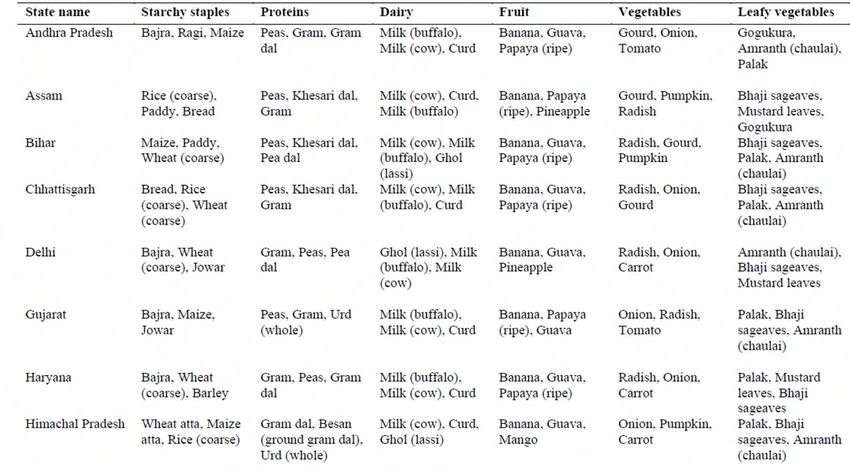
Tools being developed

•   An Excel searchable spreadsheet of food item quantities for calculating the Cost of a
    Healthy Diet
    o   Shows which food group each food item belongs in
    o   Shows how much of each item, as purchased in the market, would satisfy recommendation in
        food-based dietary guidelines (including India’s FBDG)
    o   Simplifies task of identifying least-cost items
•   User guide for calculating the Cost of a Healthy Diet
Food Prices for Nutrition eLearning course
• Will be hosted on the World Bank’s Open
Learning Campus (OLC) platform
• 3-hour self-paced course for government
officials, program planners, researchers, and
others
• Two modules
o Construction of diet cost indices
o Use and potential applications of diet cost
indices in relation to policymakingStay in touch with us! • Give us feedback & stay in touch with the Google Form: bit.ly/fpnindiafeedback • Visit our website: bit.ly/foodpricesfornutrition • Reach out with questions or interest – Rachel.gilbert@tufts.edu
Questions?

rachel.gilbert@tufts.edu
References
1.   FAO, IFAD, UNICEF, WFP, and WHO. The State of Food Security and Nutrition in the World 2020: Transforming Food Systems for Affordable Healthy Diets. The
     State of Food Security and Nutrition in the World (SOFI) 2020. Rome: FAO, IFAD, UNICEF, WFP and WHO, 2020.
     http://www.fao.org/documents/card/en/c/ca9692en.
2.   FAO, IFAD, UNICEF, WFP and WHO. 2021. The State of Food Security and Nutrition in the World 2021.Transforming food systems for food security, improved
     nutrition and affordable healthy diets for all. Rome, FAO. https://doi.org/10.4060/cb4474en
3.   Gupta, Soumya, Vidya Vemireddy, Dhiraj K. Singh, and Prabhu Pingali. “Ground Truthing the Cost of Achieving the EAT Lancet Recommended Diets: Evidence
     from Rural India.” Global Food Security 28 (March 1, 2021): 100498. https://doi.org/10.1016/j.gfs.2021.100498.
4.   Herforth, Anna, Yan Bai, Aishwarya Venkat, Kristi Mahrt, Alissa Ebel, and William A Masters. Cost and Affordability of Healthy Diets across and within Countries:
     Background Paper for The State of Food Security and Nutrition in the World 2020. FAO Agricultural Development Economics Technical Study, No. 9. Rome,
     Italy: Food & Agriculture Org., 2020. http://www.fao.org/documents/card/en/c/cb2431en/.
5.   National Institute of Nutrition, 2011. Dietary Guidelines for Indians – A Manual. National Institute of Nutrition, Indian Council of Medical Research, Hyderabad.
6.   Raghunathan, Kalyani, Derek Headey, and Anna Herforth. “Affordability of Nutritious Diets in Rural India.” Food Policy, October 10, 2020, 101982.
     https://doi.org/10.1016/j.foodpol.2020.101982.
7.   Schneider, Kate, and Anna Herforth. “Software Tools for Practical Application of Human Nutrient Requirements in Food-Based Social Science Research.” Gates
     Open Research 4 (December 10, 2020): 179. https://doi.org/10.12688/gatesopenres.13207.1.
Discussion
• Opportunities for using these metrics in India
o Which stakeholders?
• Opportunities for incorporating into routine monitoring
o What is needed? Next steps?
o Where and how frequently could the indicator be made available?You can also read