Measuring the Occupational Impact of AI: Tasks, Cognitive Abilities and AI Benchmarks - European ...
←
→
Page content transcription
If your browser does not render page correctly, please read the page content below
JRC Technical Report

Measuring the Occupational Impact
    of AI: Tasks, Cognitive Abilities
                and AI Benchmarks

                        JRC Working Papers Series on
                    Labour, Education and Technology
                                                          2020/02
             Songül Tolan, Annarosa Pesole, Fernando Martínez-Plumed,
       Enrique Fernández-Macías, José Hernández-Orallo, Emilia Gómez

                                                                                GY
                                                N

                                                                             LO
                                             IO

                                                                         NO
     UR

                                          AT
                                  UC
  BO

                                                                        CH
                          ED
LA

                                                               TE

                                          Joint                               EUR 28558 EN
                                          Research
                                          Research
                                          Centre
                                          Centre
This Working Paper is part of a Working paper series on Labour, Education and Technology by the Joint Research Centre (JRC) The JRC is the European Commission’s science and knowledge service. It aims to provide evidence-based scientific support to the European policymaking process. The scientific output expressed does not imply a policy position of the European Commission. Neither the European Commission nor any person acting on behalf of the Commission is responsible for the use that might be made of this publication. Contact information Name: Songul Tolan Address: Joint Research Centre, European Commission (Seville, Spain) Email: Songul.TOLAN@ec.europa.eu@ec.europa.eu Tel.: +34 9544-88354 EU Science Hub https://ec.europa.eu/jrc JRC119845 Seville: European Commission, 2020 © European Union The reuse policy of the European Commission is implemented by the Commission Decision 2011/833/EU of 12 December 2011 on the reuse of Commission documents (OJ L 330, 14.12.2011, p. 39). Except otherwise noted, the reuse of this document is authorised under the Creative Commons Attribution 4.0 International (CC BY 4.0) licence (https://creativecommons.org/licenses/by/4.0/). This means that reuse is allowed provided appropriate credit is given and any changes are indicated. For any use or reproduction of photos or other material that is not owned by the EU, permission must be sought directly from the copyright holders. All content © European Union 2020 How to cite this report: Tolan, S., Pesole, A., Martínez-Plumed, F., Fernández-Macías, E., Hernández- Orallo, J., Gómez, E. Measuring the Occupational Impact of AI:Tasks, Cognitive Abilities and AI Benchmark, Seville: European Commission, 2020, JRC119845.
Measuring the Occupational Impact of AI: Tasks, Cognitive Abilities
                      and AI Benchmarks
 Songül Tolan1 , Annarosa Pesole1 , Fernando Martínez-Plumed1 , Enrique Fernández-Macías1 ,
                       José Hernández-Orallo2,3 , and Emilia Gómez1,4
                              1
                               Joint Research Centre, European Commission
                                   2
                                     Universitat Politècnica de València
                            3
                              Leverhulme Centre for the Future of Intelligence
                                        4
                                          Universitat Pompeu Fabra
{songul.tolan, annarosa.pesole, fernando.martinez-plumed, enrique.fernandez-macias, emilia.gomez-gutierrez}@ec.europa.eu,
                                                     jorallo@dsic.upv.es

                                                       Abstract
          In this paper we develop a framework for analysing the impact of AI on occupations. Leaving aside
      the debates on robotisation, digitalisation and online platforms as well as workplace automation, we
      focus on the occupational impact of AI that is driven by rapid progress in machine learning. In our
      framework we map 59 generic tasks from several worker surveys and databases to 14 cognitive
      abilities (that we extract from the cognitive science literature) and these to a comprehensive list of
      328 AI benchmarks used to evaluate progress in AI techniques. The use of these cognitive abilities as an
      intermediate mapping, instead of mapping task characteristics to AI tasks, allows for an analysis of AI's
      occupational impact that goes beyond automation. An application of our framework to occupational
      databases gives insights into the abilities through which AI is most likely to affect jobs and allows
      for a ranking of occupation with respect to AI impact. Moreover, we find that some jobs that were
      traditionally less affected by previous waves of automation may now be subject to relatively higher AI
      impact.

      Keywords: artificial intelligence, occupations, tasks
Authors: Songül Tolan, Annarosa Pesole, Fernando Martínez-Plumed, Enrique Fernández-Macías, Emilia Gómez (Joint Research Centre, European Commission), José Hernández-Orallo (Universitat Politècnica de València) Acknowledgments: We thank participants of the RENIR workshop 2019, as well as Vicky Charisi, Bertin Martens, and Cèsar Ferri for fruitful discussions on earlier drafts of th is paper. Joint Research Centre reference number: JRC119845
Measuring the Occupational Impact of AI: Tasks, Cognitive Abilities and AI Benchmarks

Contents

1 Introduction                                                                                                            6

2 Background: cognitive abilities                                                                                         8

3 Data                                                                                                                  10
  3.1 Tasks: work intensity . . . . . . . . . . . . . . . . . . . . . . . . . . . . . . . . . . . . . . . . . . . . . . 10
  3.2 Benchmarks: AI intensity . . . . . . . . . . . . . . . . . . . . . . . . . . . . . . . . . . . . . . . . . . . 11

4 Methodology                                                                                                          14
  4.1 Tasks to cognitive abilities . . . . . . . . . . . . . . . . . . . . . . . . . . . . . . . . . . . . . . . . . . 14
  4.2 AI benchmarks to cognitive abilities . . . . . . . . . . . . . . . . . . . . . . . . . . . . . . . . . . . . 14
  4.3 Combining occupations and AI through abilities . . . . . . . . . . . . . . . . . . . . . . . . . . . . . 15

5 Results                                                                                                                 16
  5.1 Tasks and cognitive abilities . . . . . . . . . . . . . . . . . . . . . . . . . . . . . . . . . . . . . . . . .     16
  5.2 AI research intensity in cognitive abilities . . . . . . . . . . . . . . . . . . . . . . . . . . . . . . . . .      17
  5.3 AI impact score . . . . . . . . . . . . . . . . . . . . . . . . . . . . . . . . . . . . . . . . . . . . . . . . .   19

6 Conclusion                                                                                                              21

7 Appendix                                                                                                                26

                                                             5
Measuring the Occupational Impact of AI: Tasks, Cognitive Abilities and AI Benchmarks
1 Introduction
There is a wide agreement that the latest advances in Artificial Intelligence (AI), driven by rapid progress
in machine learning (ML), will have disruptive repercussions on the labour market (Shoham et al., 2018).
Previous waves of technological progress have also had a sustained impact on labour markets (Autor and
Dorn, 2013), yet the notion prevails that the impact of ML will be different (Brynjolfsson et al., 2018). An
argument that supports this notion is that ML seems to circumvent the previously hard limit to automation
known as Polanyi's Paradox (Polanyi, 1966), which states that we humans ``know more than we can tell''.
While past technologies could only automate tasks that follow explicit, codifiable rules, ML technologies
can infer rules automatically from the observation of inputs and corresponding outputs (Autor, 2014).
This implies that ML may facilitate the automation of many more types of tasks than were feasible in
previous waves of technological progress (Brynjolfsson et al., 2018).
In this paper we develop a framework for analysing the occupational impact of AI progress. The explicit
focus on AI distinguishes this analysis from studies on robotisation (Acemoglu and Restrepo, 2018), digi-
talisation and online platforms (Agrawal et al., 2015) and the general occupational impact of technological
progress (Autor, 2015). The framework links tasks to cognitive abilities, and these to indicators that mea-
sure performance in different AI fields. More precisely, we map 59 generic tasks from the worker surveys
European Working Conditions Survey (EWCS) and Survey of Adult Skills (PIAAC) as well as the occupational
database O*Net to 14 cognitive abilities (that we extract from the cognitive science literature) and these
to a comprehensive list of 328 AI-related benchmarks which are metrics on publicly available datasets
that indicate progress in AI techniques (see Figure 1).
Differently from previous approaches that have tried to link directly AI developments with task charac-
teristics (Brynjolfsson et al., 2018), our framework adds an intermediate layer of cognitive abilities. With
14 distinct cognitive abilities, this layer is more detailed than the task charakteristics mentioned in the
task-based approach as introduced in (Autor et al., 2003). In this model work tasks are defined by their
routine, abstract, and manual content, all three characteristics of work organisation that point towards
task automation (Autor and Handel, 2013). Although this approach has been very fruitful and inspired
many studies (including this one), in our view these characteristics do not suffice to capture AI's potential
to affect and transform work tasks that are not (yet) tailored to be performed (fully or partially) by a ma-
chine. Hence, we leave open the possibility that besides substituting an already standardised task, AI may
cause workplaces to transform the way a task is performed by acquiring some of the abilities required for
the task.
The ability perspective allows us to distinguish machines that, through ML, are empowered with the abil-
ities of performing in a range of several tasks from machines that are constructed or programmed to
perform a specific task. For instance, the ability of understanding human language (covered by the
area of Natural Language Processing) can be applied in a variety of tasks (such as reading or writing
e-mails, or advising costumers/clients). Abilities are therefore a better parameter to evaluate progress in
AI (Hernández-Orallo, 2017a). We focus on abilities instead of skills because from a human perspective
abilities are innate and primary. Instead, skills instead acquired through a combination of abilities, experi-
ence and knowledge (Fernández-Macías et al., 2018). Since knowledge and experience are not appropriate
properties of AI, linking AI benchmarks to abilities (instead of skills) should be less prone to measurement
error (Hernández-Orallo, 2017a).
6Measuring the Occupational Impact of AI: Tasks, Cognitive Abilities and AI Benchmarks
Tasks Abilities AI
Benchmarks
MP
Lifting or moving people SI ImageNet
VP
Read letters, memos or e-mails Atari Learning Environment
AP
Manual dexterity AS Machine Translation
PA
Read manuals or reference materials CE General Video Game Competition
LABOUR AI
CO
MARKET Calculate prices, costs or budgets Robocup
EC
Advising people NV Robochat challenge
CL
Directing/motivating Subordinates Loebner Prize & Turing Test
QL
... MS ...
MC
Figure 1: Bidirectional and indirect mapping between job market and Artificial Intelligence (abilities described in
Appendix A).
Due to the intermediate layer of 14 different abilities, we also gain a broader understanding on the oc-
cupational impact of AI. That is, the framework allows us to not only define a single occupation-level AI
exposure score but also lets us identify the different abilities that are most likely driving the implementa-
tion of AI in the workspace. In other words, we can identify which abilities are less likely to be performed
by AI and are therefore less prone to changes in the way they are currently being performed.
Furthermore, we rely on a wide range of AI benchmarks to approximate the direction of AI progress. These
benchmarks are performance indicating metrics (such as accuracy, or area under the receiver operating
characteristics) on openly accessible datasets which are prominently promoted on online platforms where
both AI researchers and industry players present their current performance in different AI domains. The
collection of these benchmarks provides a thorough overview of the direction of AI progress. In many
cases these benchmarks and the work on them exist before the explicit formalisation of its use at work.
For instance, performing well in the game of ``Go'', which is recorded in a corresponding benchmark, is
not explicitly mentioned in any work-related task. However, AI that performs well on these benchmarks
needs to exhibit abilities in memory processing and planning. Both abilities are useful in the performance
of some work-related tasks. Moreover, instead of looking at past progress of these benchmarks, we mea-
sure interest in specific AI domains through the prevalence of benchmarks in each category. This measure
allows for the computation of future trends based on past developments in each category and can be
easily updated for future years.
This paper contributes to the literature on measuring the occupational impact of AI (Frey and Osborne,
2017; Arntz et al., 2016; Nedelkoska and Quintini, 2018), although we distinguish between technological
feasibility of AI and the full automation (substitution through machines) of a task. We further complement
this literature by measuring AI potential in cognitive abilities using AI field benchmarks that are used as
orientation by AI researchers and other AI industry players. This approach captures the entire AI research
field more comprehensively than expert predictions on the future automatibility of occupations as in Frey
and Osborne (2017) and subsequent studies.
This measure of AI progress complements Brynjolfsson et al. (2018)'s rubric to determine the suitability
of tasks for ML since it can be easily updated to future developments in the already recorded benchmarks.
In addition, some of Brynjolfsson et al. (2018)'s defined task properties are endogenous to the redefinition
of an occupational task in which AI is already established. For instance, the property "task information
is recorded or recordable by computer" emerges once the corresponding AI technology is specified to the
7Measuring the Occupational Impact of AI: Tasks, Cognitive Abilities and AI Benchmarks
task. That is, if AI performs well in one of the abilities required to perform the task, it requires a redefi-
nition of the affected task around this ability in order to be considered a separate work task. In contrast,
the ability perspective assesses AI progress one step ahead and does not require a redefinition of tasks.
Our approach relates most to Felten et al. (2018) who also link AI field benchmarks of to work-related
abilities but there are some noteworthy differences. First, Felten et al. (2018)'s measure of AI progress
relies on one platform only, the Electronic Frontier Foundation (EFF)1 , which is restricted to a limited set
of AI benchmarks. The benchmarks in the present framework further rely on our own previous analysis
and annotation of papers (Hernández-Orallo, 2017c; Martínez-Plumed et al., 2018; Martinez-Plumed and
Hernandez-Orallo, 2018) as well as on open resources such as Papers With Code2 , which includes data
and results from a more comprehensive set of AI benchmarks, competitions and tasks. This ensures a
broad coverage of AI tasks, also providing insight into AI performance in cognitive abilities that go beyond
perception, such as text summarisation, information retrieval, planning and automated deduction.
For better comparability across these benchmarks that come from a multitude of different AI domains,the
measure of AI progress is also different. Felten et al. (2018) assess AI progress by computing linear trends
in each benchmark. However, nonlinear performance jumps at different thresholds of each benchmark,
impede comparability between different benchmarks. We address this issue by translating benchmarks
to a measure of AI research activity that enables comparability across benchmarks from different AI fields.
In a more recent article, Webb (2020) measures AI's occupational impact by computing the overlap be-
tween O*NET job task descriptions and the text of patents. We complement this approach by measuring
AI progress before it is formulated in patents.
The remainder of this paper is structured as follows. The following section provides background informa-
tion on the construction of the layer of cognitive abilities in the framework. In Section 3 we describe the
different data sources that we combine to construct the framework which is followed by Section 4 where
we present the methodology used to construct the framework. We present the results of the application
of our framework in Section 5. Section 6 concludes.
2 Background: cognitive abilities
A first glance at the tasks that are usually identified in the workplace and those that are usually set in AI
as benchmarks (see Figure 1) reveals the difficulty of matching them directly, as the lists are very differ-
ent. However, tasks and benchmarks have some latent factors in common, what we refer to as `cognitive
abilities', which we can use to map them indirectly but at a level of aggregation that is more insightful. For
this characterisation of abilities we look for an intermediate level of detail, excluding very specific abilities
and skills (e.g., music skills, mathematical skills, hand dexterity, driving a car, etc.) but also excluding very
general abilities or traits that would influence all the others (general intelligence, creativity, etc.). As we
just cover cognitive abilities, we also exclude personality traits (e.g., the big five (Fiske, 1949): openness,
conscientiousness, extraversion, agreeableness and neuroticism). Although we consider the latter essen-
tial for humans, their ranges can be simulated in machines by changing goals and objective functions.
1 https://www.eff.org/es/ai/metrics
2 https://paperswithcode.com/
8Measuring the Occupational Impact of AI: Tasks, Cognitive Abilities and AI Benchmarks
At the intermediate level, we aim at a number and breadth similar to the “broad abilities” of the Cattell-
Horn-Carroll hierarchical model (see Figure 2) (Carroll et al., 1993). However, some of them are very
anthropocentric and are not really categorical, but orthogonal (such as processing speed or the distinction
between short-term and long-term memory).
(stratum III)
General
g
(stratum II)
Broad
Gc
Gc Gf Gq Grw Gsm Glr Gv Ga Gs Gt
(stratum I)
Narrow
c11
c1 ... f11
c1 ... q11
c1 ... rw
c111 ... sm
c111 ... lr11
c1 ... v11
c1 ... a11
c1 ... s11
c1 ... t11
c1 ...
c22
c2 f22
c2 q22
c2 rw
c222 sm
c222 lr22
c2 v22
c2 a22
c2 s22
c2 t22
c2
Figure 2: Cattell-Horn-Carroll's three stratum model. The broad abilities are Crystallised Intelligence (Gc), Fluid
Intelligence (Gf), Quantitative Reasoning (Gq), Reading and Writing Ability (Grw), Short-Term Memory (Gsm), Long-
Term Storage and Retrieval (Glr), Visual Processing (Gv), Auditory Processing (Ga), Processing Speed (Gs) and Deci-
sion/Reaction Time/Speed (Gt).
For our purposes we use 14 categories as the result of the integration of several tables and figures from
Hernández-Orallo (2017c), originally collected from psychometrics, comparative psychology, cognitive sci-
ence and artificial intelligence. The 14 categories are defined as follows:
• Memory processes (MP)
• Sensorimotor interaction (SI)
• Visual processing (VP)
• Auditory processing (AP)
• Attention and search (AS)
• Planning and sequential decision-making and acting (PA)
• Comprehension and compositional expression (CE)
• Communication (CO)
• Emotion and self-control (EC)
• Navigation (NV)
• Conceptualisation, learning and abstraction (CL)
• Quantitative and logical reasoning (QL)
• Mind modelling and social interaction (MS)
9Measuring the Occupational Impact of AI: Tasks, Cognitive Abilities and AI Benchmarks
• Metacognition and confidence assessment (MC)
The hierarchical theories of intelligence in psychology, animal cognition and the textbooks in AI are gen-
erally consistent (at least partially) with this list of abilities, or in more general and simple terms, with
this way of organising the vast space of cognition. The definition of cognitive abilities can be found in
Appendix A, which also includes a rubric so that we can determine for each ability whether it is required
for a particular task.
3 Data
For our analysis we rely on two different sources of data that provide information on task intensity in
occupations (i.e. the relevance of and time spent on that task) on the one side and on AI research intensity
on the other side. We start with a description of the data on tasks before moving to a description of the
data on AI.
3.1 Tasks: work intensity
For the task dataset, we draw from the framework developed in Fernández-Macías and Bisello (2017).
This data entails a list of tasks (presented in Table 3 in Appendix D) and their respective intensity (i.e.
relevance and time spent) across occupations. The development of this dataset is described in detail in
Fernández-Macías et al. (2016). In the following we provide a summary of the construction of this dataset.
We classify occupations according to the 3-digit International Standard Classification of Occupations
(ISCO-3)3 . Since there is no international data source that unifies information on all tasks required, we
combine data from three different sources: the worker surveys the European Working Conditions Survey
(EWCS)4 and the OECD Survey of Adult Skills (PIAAC)5 as well as the database the Occupational Informa-
tion Network (O*NET)6 .
The data in the worker surveys are measured at the individual worker level based on replies to questions on
what they do at work. Task intensity is derived as a measure of time spent on specific tasks. For instance,
in the EWCS we derive the task "Liſting or moving people" from the survey question q24b "Does your main
paid job involve liſting or moving people?" and the corresponding 7-point scale answers ranging from "All
of the time" to "Never". Analogously, in the PIAAC we derive the task "Read letters, memos or e-mails"
from the survey question G_Q01b "Do you read letters, memos or e-mails?" and the corresponding 5-point
scale answers ranging from "Every day" to "Never". Due to the nature of survey data, we need to be aware
of issues such as measurement error, high variation in responses across individuals and biased responses.
Similarly, the occupational database, O*NET is based on multiple waves of individual worker surveys but
also on employer job postings, expert research and other sources. The data is curated by occupational
experts and provided on a standardised occupational level. In this case, task intensity is derived from a
variable that measures the extent to which the task is required to perform a job. For instance, the task
"Oral Comprehension" is derived from the same variable and the corresponding level defined on a 7-point
3 https://www.ilo.org/public/english/bureau/stat/isco/
4 https://www.eurofound.europa.eu/surveys/european-working-conditions-surveys
5 https://www.oecd.org/skills/piaac/
6 https://www.onetonline.org/
10Measuring the Occupational Impact of AI: Tasks, Cognitive Abilities and AI Benchmarks
scale.
The O*NET is widely used in the literature on labour markets and technological change (Acemoglu and
Autor, 2011; Frey and Osborne, 2017; Goos et al., 2009). Moreover, it covers a large share of the task list
that we construct. However, the occupational level of the data precludes a further analysis into variation
in task content within occupations. Moreover, much like the EWCS for Europe, the O*NET is based on US
data only. Therefore, likely differences in the task content of occupations across countries due to institu-
tional as well as socio-economic differences cannot be considered in the present analysis.
Finally, in order to make the measures of task intensity comparable across all three data sources, we
equalise scales and levels of all variables. For this purpose, we rescale the variables to a [0, 1] scale
with 0 representing the lowest possible intensity and 1 representing the highest possible intensity of each
variable. Moreover, we average scores measured on an individual level (i.e. all variables from PIAAC and
EWCS) to the unified level of standardised 3-digit occupation classifications. The final database contains
the intensity of 59 tasks across 119 different occupations.
To test the consistency of the variables that are derived from multiple datasources, Fernández-Macías
et al. (2016) look at pairwise correlations and Cronbach's Alpha for multiple variables that measure similar
concepts. Reassuringly, all tests yield high correlations and Cronbachs's Alpha values of between 0.8
and 0.9, suggesting consistency in the measurement of task intensity across the different data sources.
Moreover, it is reasonable to doubt the comprehensiveness of the task framework. In fact, the results of
the current study (see below) suggest that the following tasks are missing from the framework:
1. (Within Physical tasks) Navigation: moving objects or oneself in unstructured and changing spaces
2. (Within Intellectual - Information processing tasks) Visual and/or auditory processing of uncodified
and unstructured information
3. (Within Intellectual - Problem Solving tasks) Information search and retrieval
4. (Within Intellectual - Problem Solving tasks) Planning
Since the collection of data on these additional task categories is yet to be conducted, the results of this
paper will not include them.
3.2 Benchmarks: AI intensity
We consider a comprehensive set of AI benchmarks for our framework based on our own previous analysis
and annotation of AI papers (Hernández-Orallo, 2017b; Martínez-Plumed et al., 2018; Martinez-Plumed
and Hernandez-Orallo, 2018) as well as open resources such as Papers With Code7 (the largest, up to
date, free and open repository of machine learning code and results), which includes data from several
repositories (e.g, EFF8 , NLP-progress9 , SQuAD10 , RedditSota11 , etc.). All these repositories draw on data
from multiple (verified) sources, including academic literature, review articles and code platforms focused
on machine learning and AI.
7 https://paperswithcode.com/
8 https://www.eff.org/es/ai/metrics
9 https://github.com/sebastianruder/NLP-progress
10 https://rajpurkar.github.io/SQuAD-explorer/
11 https://github.com/RedditSota/state-of-the-art-result-for-machine-learning-problems
11Measuring the Occupational Impact of AI: Tasks, Cognitive Abilities and AI Benchmarks
For the purposes of this study, from the aforementioned sources we track the reported evaluation results
(when available or sufficient data is provided) on different metrics of AI performance across separate AI
benchmarks (e.g., tasks, datasets, competitions, awards, etc.) from a number of AI domains, including
(among others) computer vision, speech recognition, music analysis, machine translation, text summari-
sation, information retrieval, robotic navigation and interaction, automated vehicles, game playing, pre-
diction, estimation, planning, automated deduction, etc. This ensures a broad coverage of AI tasks, also
providing insight into AI performance in cognitive abilities that go beyond perception, such as the ability
to plan and perform actions on such plans. Note that most of these benchmarks we are addressing are
specific, implying that their goals are clear and concise, and that researchers can focus on developing spe-
cialised AI systems for solving these tasks. This does not mean researchers are not allowed to use more
general-purpose components and techniques to solve many of these problems, but it may be easier or
most cost-effective for the researchers to build a strongly specialised system for the task at hand. Specif-
ically, our framework uses data from 328 different AI benchmarks for which there is enough information
available to measure their progress for different evaluation metrics. Table 4 in Appendix E contains the
details from the benchmarks used in our analysis.
When aiming at evaluating the progress in a specific (AI) discipline, we need to focus on objective evalu-
ation tools to measure the elements and objects of study, assess the prototypes and artefacts that are
being built and examine the discipline as a whole (Hernández-Orallo, 2017b). Depending on the disci-
pline and task, there is usually a loose set of criteria about how a system is to be evaluated. See for
instance Figure 3 showing the progress for various evaluation metrics of object recognition in the COCO
(Common Objects in COntext) (Lin et al., 2014) benchmark. Several questions might arise regarding the
latter: How can we compare results or progress between different metrics? How to compare between
different benchmarks for the same task (e.g., COCO vs. MNIST (Bottou et al., 1994) vs. ImageNet (Deng
et al., 2009)) or different tasks for the same benchmark? Or, even more challenging, how can we compare
results from different tasks in the same domain or different domains? Actually, although there might
be a general perception of progress due to the increasing trends of the metrics (or decreasing in case of
error-based measures), it would be misleading to consider that the progress in AI should be analysed by
the progress of specific systems solving specific tasks as there may be a complete lack of understanding
of the relationships between different tasks. What does it mean, for instance, that one AI system demon-
strates impressive (e.g., super-human) performance on a natural language processing task and another
demonstrates impressive performance in a perception task (wrt. some evaluation metrics) if this does
not imply that these developments can be integrated easily into a single agent in order to display more
general perceptual or linguistic capabilities, or both at the same time (Brundage, 2016)? On the other
hand, it is also hard to tell in many domains whether progress comes from better hardware, data, com-
puting, soſtware, and other resources, or better AI methods (Martínez-Plumed et al., 2018). Furthermore,
the specialisation of many metrics to the domain, the evaluation overfitting (Whiteson et al., 2011), and
the lack of continuity in some evaluation procedures can also be recognised as limitations and constraints
(Hernández-Orallo, 2017b) when evaluating the progress of AI.
Given the above difficulties, instead of using the rate of progress, what we can analyse is the activity level
around a specific benchmark, indicating the research intensity in a specific task in terms of the production
(e.g., outputs such as research publications, news, blog-entries, etc.) from the AI community related to
the above AI benchmarks. Benchmarks that have an increasing trend in their production rates indicate
that more AI researchers and practitioners are working on them (i.e., there is a clear research effort and
intensity). Note that this is not an indication of progress, although, presumably, effort may lead to some
progress eventually. It is also worth considering that areas that usually gather more intensity are those
where there is a general perception that breakthroughs are being made or about to be made. For instance,
those problems that are already solved, where progress is expected to be minimal or those that are too
12Measuring the Occupational Impact of AI: Tasks, Cognitive Abilities and AI Benchmarks
COCO
60
● ● ● Evaluation Metric
● ●
●
● ●● ●● ● ● ● ●
value
40 Average Precision
● ● ●● ● Bounding Box
● ●
mAP
20 ●
0
2016 2017 2018 2019
date
Figure 3: Progress (trends represented with dashed coloured lines) across different evaluation metrics for COCO
object recognition benchmark (Krizhevsky et al., 2009).
challenging for the state of the art usually capture less attention.
CIFAR MNIST CoNLL
Adj R2 = 0.91419 Adj R2 = 0.81582 Adj R2 = 0.71947
Intercept = −0.010985 Intercept = 0.033827 Intercept = 0.032139
0.06 0.03
Slope =0.0060866 Slope =0.0048215 Slope =−0.0019787
P =0.00000073521 P =0.000034925 P =0.00029937
0.075
Mean =0.0285781964157085 Mean =0.0651664278485946 Mean =0.019277626851779
AItopics hits (normalised)
AItopics hits (normalised)
AItopics hits (normalised)
0.04
0.02
0.050
0.02
0.01
0.025
0.00
0.000 0.00
2008 2009 2010 2011 2012 2013 2014 2015 2016 2017 2018 2008 2009 2010 2011 2012 2013 2014 2015 2016 2017 2018 2008 2009 2010 2011 2012 2013 2014 2015 2016 2017 2018
Go MovieLens UCI
0.20
Adj R2 = 0.20415 Adj R2 = 0.26958 Adj R2 = 0.69639
Intercept = 0.18952 Intercept = 0.020302 Intercept = 0.13968
Slope =−0.0030161 Slope =−0.00099946 Slope =−0.0078001
P =0.079103 0.020 P =0.048229 P =0.00044962
0.15 Mean =0.169918844917645 Mean =0.0138057312057117 0.10
Mean =0.0889778207090231
AItopics hits (normalised)
AItopics hits (normalised)
AItopics hits (normalised)
0.015
0.10
0.010
0.05
0.05
0.005
0.00 0.000 0.00
2008 2009 2010 2011 2012 2013 2014 2015 2016 2017 2018 2008 2009 2010 2011 2012 2013 2014 2015 2016 2017 2018 2008 2009 2010 2011 2012 2013 2014 2015 2016 2017 2018
Figure 4: Average rate of activity level or intensity (green dashed line) for a set of illustrative AI benchmark over the
last decade (2008-2018).
We can derive the activity level or intensity using some proxies. In particular, we performed a quantitative
analysis using data obtained from AI topics12 , an archive kept by the Association for the Advancement of
12 https://aitopics.org
13Measuring the Occupational Impact of AI: Tasks, Cognitive Abilities and AI Benchmarks
Artificial Intelligence (AAAI)13 . This platform contains a myriad of AI-related documents (e.g. news, blog
entries, conferences, journals and other repositories from 1905 to 2019) that are collected automatically
with NewsFinder (Buchanan et al., 2013). In this regard, in order to calculate the intensity in each particular
benchmark, we average the (normalised14 ) number of hits (e.g., documents) obtained from AI topics per
benchmark and year over a specific period of time (e.g, last year, lustrum or decade). This way we obtain a
benchmark intensity vector (328 × 1) with values in [0, 1], as they are counts divided by the total number
of documents. Figure 4 presents the calculated relative intensity for a set of illustrative AI benchmarks
over the last decade. Note that we make the assumption that a high relative intensity corresponds to
breakthroughs or significant progress that can be translated to real applications in the short term.
4 Methodology
In this section we explain the construction of the framework. That is, we map between the three layers:
(1) tasks (2) cognitive abilities, and (3) AI research.
4.1 Tasks to cognitive abilities
This section elaborates on the construction of the links between tasks (see Section 3.1) and cognitive
abilities (see Section 2). To generate this mapping, a multidisciplinary group of researchers conducted an
annotation exercise for each item of the task database. More precisely, in a cross-tabulation of the list
of tasks (rows) and the cognitive abilities (columns) rubric (see Appendix A), each annotator was asked
to put a 1 in a cell if an ability is inherently required, i.e. absolutely necessary to perform the respective
task. In order to increase robustness in the annotations, we followed a Delphi Method approach (Dalkey
and Helmer, 1963). That is, this process is repeated, in order to increase agreement among annotators.
In the second round the annotators were asked to repeat the mapping exercise in light of the results of
the first round and corresponding feedback. To increase robustness in the assignment of abilities to tasks,
we define an ability as assigned to a task if at least two annotators assigned this ability. This makes the
assignment less sensitive to outlier assignments.
Next, we adjust the {1, 0} assignment of abilities to tasks by the intensity of the respective task in each
occupation, where we obtain the measure of task intensity in each occupation from the dataset described
in Section 3.1. The outcome of this reflects the occupational task intensity in the abilities assigned to the
tasks in each occupation.
4.2 AI benchmarks to cognitive abilities
Similar to the mapping between cognitive abilities to tasks, we link these 14 cognitive abilities to the
data on AI benchmarks (see Section 3.2). Specifically, a group of AI-specialised researchers was asked to
consider how each AI benchmark is related to each cognitive ability: in a cross-tabulation of the vector
of benchmarks b of length |b| = 328 and cognitive abilities a of length |a| = 14, a 1 is put in a ability-
benchmark correspondence (or mapping) matrix (14 × 328) if an ability is inherently required, i.e. ab-
solutely necessary to solve the respective benchmark. Note that since our correspondence or mapping
matrix mean ``requires" (e.g, a particular benchmark needs a particular (set of) cognitive abilities to be
addressed successfully), it makes sense to distribute the intensity values when a benchmark requires
many abilities So, assuming that when more abilities are needed this requires more research effort or
13 https://www.aaai.org/
14 Document counts are normalised to sum up to 100% per year
14Measuring the Occupational Impact of AI: Tasks, Cognitive Abilities and AI Benchmarks
work, we normalise the correspondence matrix through abilities. This means that columns are normalised
to sum up 1 and values are thus in [0, 1].
72.61 71.233
66.993
60
42.525
Relevance
40
33.317
20
8.108 9.543
5.293 7.117
5.093
1.993 2.093 2.083
0
0
MP SI VP AP AS PA CE CO EC NV CL QL MS MC
Figure 5: Relevance (counting) of the cognitive abilities.
From here we can calculate the vector of relevance for each cognitive ability from the correspondence
matrix as row sums, thus obtaining the results in Figure 5. We see a clear dominance of visual process-
ing (VP), attention and search (AS), comprehension and compositional expression (CE), conceptualisation,
learning and abstraction (CL) and quantitative and logical reasoning (QL).
4.3 Combining occupations and AI through abilities
From the leſt side in Figure 1 we now have every occupation described in terms of 59 task intensities and
the assignment (or non-assignment) of 14 abilities. That is, every cognitive ability appears in each occu-
pation multiple times, depending on the number of tasks the ability has been assigned to. We simplify this
mapping by summarising the information on the task layer in the abilities layer. In order to make sure that
the ability scores are not driven by data availability of tasks, we first sort the task variables, to which the
abilities have been assigned to, into the leſt side of the task framework presented in Fernández-Macías
and Bisello (2017) and create task-ability indices by averaging within each task subcategory. In order to
take into account the number of tasks that a cognitive ability is assigned to, we sum over all task indices
linked to the same cognitive ability for each occupation. The final score indicates the total required inten-
sity of each of the cognitive abilities for each of the 119 occupations.
Note that the differences in the intensities across different cognitive abilities are not linear, since the
score of each cognitive ability derives from variables with highly varying scales. However, these scores
take into account the number of tasks for which an ability is required weighted by the intensity of each
task in each occupation. The scores therefore do allow for a ranking of the relevance of each ability within
an occupation with a disregard for the distances. Similarly, the scores for the same cognitive ability across
different occupations are measured on the same scale, which allows for a clear ranking of occupations
along the same cognitive ability, again without interpretation of the distances between occupations.
For the computation of an AI impact score, we want the ability-specific scores to take into account the
inter-connectivity of abilities that are required at the same time for the same occupation. That is, two very
different occupations can have the same degree of intensity of one ability but can still be affected in very
different ways by AI research intensity of this ability if the corresponding tasks require a different number
of abilities at the same time. For instance, visual processing may be a very relevant ability for a person
15Measuring the Occupational Impact of AI: Tasks, Cognitive Abilities and AI Benchmarks
classifying offensive online content. Similarly, visual processing may be equally relevant for surgeons
but also in combination with sensorimotor interaction. If we considered the intensity of each cognitive
ability separately this would suggest that high AI intensity in visual processing but relatively low intensity
in sensorimotor interaction would affect both occupations equally. However, in reality the surgeon would
be affected less than the person classifying online content because the impact of high AI performance in
visual processing would not be that high if performance in sensorimotor interaction would not also be high.
This is not an issue if we only compare the impact of AI on occupations through specific abilities. However,
since AI research intensity is also connected with cognitive abilities, the ability-specific AI impact would be
the same for every occupation. In order to construct an overall occupation-specific AI impact score that
distinguishes occupations, we first establish a relation between the intensity scores of cognitive abilities
for each occupation, which we denote relative ability-specific AI impact score. In detail, we transform the
total score of each cognitive ability for each occupation such that the sum of scores within each occupa-
tion is equal to one. This transformed score entails a relationship between the different cognitive ability
scores within each occupation.
Finally, we combine AI benchmarks (see Section 4.2) to labour market information using the common link
to cognitive abilities. For this purpose we multiply the relative scores (described in the previous section)
with the respective AI research intensity for each cognitive ability. Next, we take the sum over the products
for each occupation. The final score indicates which of the studied occupations are relatively more likely
to be affected by AI research intensity in the analysed cognitive abilities. For illustrative purposes we
normalise this score, which we denote AI impact score, to a [0, 1] scale.
5 Results
Before presenting results of the AI impact score, we illustrate the process of the development of the frame-
work through intermediate results of the mapping of abilities to tasks and the mapping of AI benchmarks
to abilities. More detailed results of the annotation exercise for the assignment of abilities to tasks are
shown in Appendix B.
5.1 Tasks and cognitive abilities
In order to gain an overview of the task-ability mapping, we implement a principal component factor anal-
ysis on tasks and abilities. Principal component analysis (PCA) consists in the orthogonal transformation
of a set of possibly correlated variables into components (values) that are linearly uncorrelated. That is,
this transformation could be thought of as revealing the underlying structure in the data explaining the
most of data variance.
PCA could provide us with two useful insights. First, it will tell us how many principal components we need
to explain the most of the variance in the data. Second, it might help us gain a better insight into the
structure of abilities and tasks. Let us clarify using the results reported in Figure 6.
The results of the PCA in Table 6 show that the first four components explain 66% of the variance in the
data, two thirds of the original variance of all 14 cognitive abilities. The first component mostly sum-
marises cognitive abilities that have a direct relationship with other abilities (such as mind modelling and
social interaction, planning and communication) and could be interpreted as the latent variable measuring
cognitive abilities in what we categorise as social tasks (i.e. tasks whose object is people). The second
and the third components are mostly associated with tasks that necessitate a processing of information
16Measuring the Occupational Impact of AI: Tasks, Cognitive Abilities and AI Benchmarks
Figure 6: PCA on tasks and abilities
streams without social interaction. The second component identifies particularly those tasks that involve
the processing of encoded information (text and numbers) but requires a less extent of originality or
problem-solving. Indeed the main cognitive abilities explaining the second factor are memory processing,
attention and search and conceptualisation, learning and abstraction, which all resemble the abilities of
recognising specific patterns/criteria in order to perform the task. On the other hand, the third component
presents a broader variety of cognitive abilities which seems to point mostly to those tasks that require a
certain degree of flexibility and problem solving capacity, without necessarily being demanding in terms
of abstraction. The fourth component is clearly associated to more physical abilities since navigation and
sensorimotor interaction are mostly required in more physical tasks. Finally, the fiſth and sixth components
are mostly explained respectively by visual processing and auditory processing associated to quantitative
and logical reasoning.
In order to structure the discussion on cognitive abilities, we conduct a cluster analysis to categorise them.
The detailed analysis and results can be found in Appendix C. Overall, the resulting clusters allow us to
sort the cognitive abilities in more rough categories of social abilities (EC, MS, MC, CO), object oriented
abilities (CE, PA, MP, AS, CL, QL), and physical abilities (SI, NV, VP, AP). This gives further insights into the
nature of abilities and the corresponding occupations.
As mentioned in Section 4.3, we expect the impact of higher AI research intensity in a specific ability on a
specific task and occupation to be lower, if the performance of this tasks requires a combination of multiple
cognitive abilities. To further explore this idea, we analyse the likelihood of each cognitive ability to be
assigned to a task in combination with multiple other cognitive abilities. For this purpose we compute the
sum of assigned abilities per task and conduct a dominance analysis, an extension of multiple regression
developed by Budescu (1993), of this sum on the 14 cognitive abilities.15 The findings of the dominance
analysis confirm the results of the cluster analysis. We can group the ranked abilities into social (rank
1-4), object oriented (rank 5-10) and physical abilities (rank 11-14).
5.2 AI research intensity in cognitive abilities
We can translate also the benchmark intensity vector (see Section 4.2) to cognitive abilities as a matrix-
vector multiplication thus obtaining an ability intensity vector (14 × 1). This yields the relative ability
15 More detailed results can be found in Appendix C.
17Measuring the Occupational Impact of AI: Tasks, Cognitive Abilities and AI Benchmarks
indirect intensity, i.e. the relative AI research intensity for different periods of time. Figure 7 shows the
computed AI research intensity for each cognitive ability for every two-year period from 2008 to 2018.
The figure depicts that AI is currently having a larger relative intensity on those cognitive abilities that rely
on memorisation, perception, planning and search, understanding, learning and problem solving, and even
communication; smaller influence on physical-related abilities such as navigation or interaction with the
environment. Since ``intensity'' depends on the the level of activity on AI topics, this would mean that
there is a lower amount of documents related to those benchmarks for physical AI, but also, although to
a lesser extent, due to a more limited number of robotics benchmarks, which are usually more difficult to
build and maintain. Moreover, note that the focus of this paper is AI (i.e. rather cognitive robotics), which
in many cases is distinct from robotics.
0.00100
0.00075
Ability intensity
0.00050
0.00025
0.00000
MP SI VP AP AS PA CE CO EC NV CL QL MS MC
2008−2010 2011−2013 2014−2016 2017−2018
Figure 7: Relevance per cognitive ability weighted by (average) rate intensity for different periods of years over the
last decade (2008-2018). Empty grey dashed bars represent average values per ability for the whole period.
We also see almost no research intensity on those abilities related to the development of social interaction
(MS) and metacognition (MC). This may be due to the lack of suitable benchmarks to evaluate the inter-
actions of agents (human and virtual) in social contexts; as well as the challenge (today) of developing
agents able to properly perform in social contexts with other agents having beliefs, desires and intentions,
coordination, leadership, etc. as well as being aware of their own capacities and limits.
Note that Figure 7 also shows trends over the years for each cognitive ability. There is a clear "increasing"
trend in visual processing (VP) and attention and search (AS), while other abilities remain more or less
constant (MP, SI, AP, CO, CL and MS) or have a small progressive decline (PA, CE, EC and QL). Note that
these values are relative. For instance, PA, CE or QL have decreased in proportion to the rest. In absolute
numbers, with an investment in AI research that is doubling every 1-2 years (Shoham et al., 2018), all of
them are actually growing. Thus the figure shows that imbalances are becoming more extreme.
18Measuring the Occupational Impact of AI: Tasks, Cognitive Abilities and AI Benchmarks
5.3 AI impact score
In this section we present the results from the the combination of all three layers of the framework:
(1) tasks, (2) cognitive abilities, and (3) AI benchmarks in terms of occupations (see Section 4.3 for the
corresponding methodology). We compute the AI impact score for each occupation using the AI research
intensity scores from 2018. Before showing the final AI impact scores, we present the task-intensity of
each cognitive ability and the ability-specific AI impact score in detail and focus on the following relevant
selected occupations from ISCO-3 specifications: general office clerks; shop salespersons; domestic, hotel
and office cleaners and helpers; medical doctors; personal care workers in health services; primary school
and early childhood teachers; heavy truck and bus drivers; waiters and bartenders; building and related
trades in construction.
Figure 8: Ability-specific scores of cognitive abilities for selected occupations
Figure 8 depicts the relative ability-specific task intensity scores for the nine selected occupations men-
tioned above. That is, the figure shows for each of the nine selected occupations the relevance of each
cognitive ability relative to the other cognitive abilities. In line with above findings, each subfigure is di-
vided between social, object oriented and physical abilities. First, note that all occupations tend to exhibit
similar profiles. On average, the most relevant ability is comprehension (CE), which is followed by com-
munication (CO), and ? (AS). Furthermore, we find a relatively high relevance for conceptualisation (CL)
and quantitative reasoning (QL). Thus, all occupations tend to require social and object oriented abilities
more than physical abilities.
19Measuring the Occupational Impact of AI: Tasks, Cognitive Abilities and AI Benchmarks
Moreover, the figure shows that medical doctors, teachers and office clerks have high intensity scores for
most cognitive abilities. These occupations also exhibit less pronounced scores for physical abilities. In
contrast, heavy truck and bus drivers, waiters and bartenders as well as workers in building and related
trades in construction have lower intensity levels for social and object-oriented abilities but higher in-
tensity levels for the physical ability, sensorimotor interaction (SI). Finally, shop salespersons and waiters
and bartenders have the highest levels for the social cognitive abilities, while these levels are very low
for general office clerks. Overall, considering the nature of these occupations, the present scores depict
reasonable ability profiles.
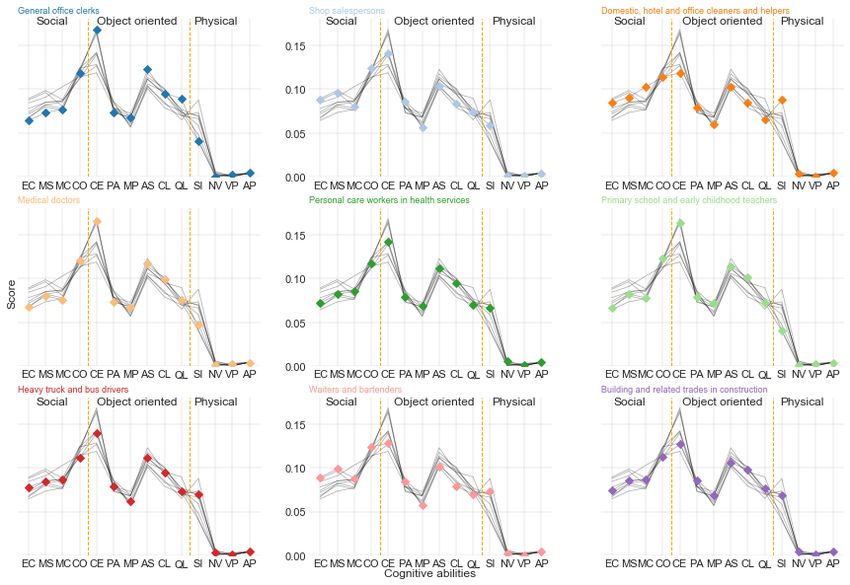
Figure 9 depicts the computed AI exposure score differentiated by cognitive abilities, for nine selected
occupations. First, the figure shows that high-skill occupations such as medical doctors and teachers are
more exposed to AI progress than comparatively low-skill occupations such as cleaners, waiters or shop
salespersons. This is in line with the findings from Brynjolfsson et al. (2018) and Webb (2020). According
to some studies, previous waves of technological progress led to more automation of mid-skill occupa-
tions, pushing mid-skill workers to either low- or high-skill occupations depending on education and skills,
a phenomenon called technology driven labour market polarisation (Autor et al., 2003; ?). This would
contrast with the occupational impact of AI, which would be stronger in high-skilled occupations. If this
effect is in fact a labour-replacement one, it would affect occupations that mostly remained unaffected
by previous waves of automation, potentially leading to unpolarising effects and a reduction in income
inequality (Webb, 2020). If this effect is a labour-enhancing one, it could imply a significant expansion of
productivity for high-skilled occupations, potentially leading to occupational upgrading effects and an ex-
pansion of income inequality (very much like the traditional hypothesis of skills-biased technical change;
see Acemoglu (2002)).
Second, Figure 9 shows that most of AI exposure is driven by its impact on tasks that require intellectual
abilities, such as comprehension, attention and search as well as conceptualisation. On the other hand, not
much AI impact can be expected through basic processing abilities, such as visual or auditory processing,
nor through more social abilities, such as mind modelling and social interaction, or communication. How-
ever, our findings based on the task and occupation data indicate a relatively high need for social abilities
in most occupations and a relatively low need for basic processing abilities. Equivalently, the findings on
AI research intensity suggest high activity in AI areas that contribute to basic processing abilities but also
to the abilities with the highest exposure score mentioned above, and low activity for social abilities.
This finding contributes to Deming (2017) who finds growing market returns to social skills in the 2000s
as opposed to the 1980s and 1990s because social and cognitive skills (i.e. maths, statistics, engineering
and science) are complements. In more detail, an increase in efficiency and quality due to automation of
intellectual abilities could lead to increased demand for tasks that require intellectual abilities (Bessen,
2018). If these tasks also contain a high need for social abilities, of which we find that they are not likely
to be automated in the near future, we can expect an increase in the returns to social abilities.
To complete this analysis, we present in Table 5 in Appendix F the overall AI impact score for all occupa-
tions. Note that this score does not represent a percentage but it can be used to infer a ranking between
occupations in terms of AI impact. Regarding the nine selected occupations the table reflects the findings
from the more detailed analysis. General office clerks have a relatively high AI impact score while we find
relatively lower scores for shop salespersons. Surprisingly, the table suggests higher impact for many high
skill occupations such as medical doctors or school teachers. These are occupations that were traditionally
less affected by previous waves of automation. However, since we do not focus on the automation effect
of AI but rather on the general impact, a lot of this impact can also be an indicator for a transformation
20Measuring the Occupational Impact of AI: Tasks, Cognitive Abilities and AI Benchmarks
Figure 9: Ability-specific AI impact scores for selected occupations
of this occupation around the implementation of AI.
6 Conclusion
In this paper we developed a framework that allows for the analysis of the impact of Artificial Intelligence
on the labour market. The framework combines occupations and tasks from the labour market with AI
research intensity through an intermediate layer of cognitive abilities. This approach allows us to accu-
21Measuring the Occupational Impact of AI: Tasks, Cognitive Abilities and AI Benchmarks
rately assess the technological feasibility of AI in work related tasks and corresponding occupations. We
use the framework to rank selected occupations by potential AI impact and to show the abilities that are
most likely to drive the AI impact. Moreover, we find that some jobs that were traditionally less affected
by previous waves of automation may now be subject to relatively higher AI impact.
The focus on abilities, rather than task characteristics, goes beyond measuring the substitution effect of
AI. Most AI applications are built to perform certain abilities, rather than execute full work-related tasks
and most tasks will require multiple abilities to be executed. Identifying the specific abilities that can be
performed by AI gives a broader understanding on the impact of AI. Relying on AI field benchmarks that
are used as orientation by AI researchers and other AI industry players makes the framework adoptable
to future developments in AI research.
As mentioned above, AI exposure does not necessarily mean automation. Our findings do not imply that
purely intellectual tasks will be automated, as other processes could occur when technology takes over
some work that was previously performed by a human. For instance, better analytical predictions through
AI could increase the value of human judgement, i.e. the ability to conduct meaningful inference and
suggest appropriate actions (Agrawal et al., 2018). Overall, our findings show that most occupations will
be significantly affected by AI but suggests that we should not fear an AI that is "taking over our jobs".
For instance, most occupations involve a significant amount of social interaction tasks, and as previously
mentioned progress in AI can in fact increase the value of social abilities and thus their demand in the
future. We can be much more certain about the capacity of AI to transform jobs than about its capacity
to destroy them.
In future work, this framework can be extended to integrate task characteristics of work organisation. This
will allow us to measure and distinguish the impact of AI through newly acquired technical capabilities
and the automation potential of tasks. Moreover, the measurement can be refined as more data on the
relevance of specific work-related tasks as well as new benchmarks on AI progress arise. Overall, this
framework presents an appropriate way to measure AI impact on labour markets as the connecting link,
cognitive abilities, can capture general advances and advances in data collection well for both labour
markets and AI research.
22You can also read