MI COVID response Data and modeling update - February 23, 2021 - State of ...
←
→
Page content transcription
If your browser does not render page correctly, please read the page content below
MI COVID response
Data and modeling update
February 23, 2021

NOTE: all data as of Feb 20 unless otherwise noted

Executive summary
Michigan has the 18th highest number of cases (↑5), 18th highest number of deaths (↑2), 48th highest case rate (↓1),
and T35th highest death rate (↑1) in the last 7 days (source: CDC COVID Data Tracker)

Michigan has the 37th highest hospitalization rate as a percent of total beds (↔), and 18th highest number of
COVID patients in the ICU (↓4) (source: Becker’s Hospital Review)

Case rates (94.7, ↓18.2) and percent positivity (3.5%, ↓0.4%) are declining for 6 weeks

4.9% of available inpatient beds are filled with COVID patients (↓0.9%) and state trends for COVID hospitalizations
are decreasing

There were 195 deaths (↓87) between Feb 7 and Feb 13, and the death rate is 2.8 deaths per million residents (↓1.2)

The 7-day average state testing rate is 2,691.3 tests/million/day (↓429.7). Daily diagnostic tests (PCR) decreased to
26.7K per day (↓4.3K), and the weekly average for PCR and antigen tests conducted in Michigan is 35.5K (↓2.9K).

1.94 million COVID-19 vaccine doses reported to MDHHS, 15.5% of Michigan population has at least one dose
Comparison across states: Summary 2/22/21
What we see today:
• Two states (ND, WY) are seeing increasing 1 week case trends (stable vs. last week)
• 31 states (down vs. 32) with significant outbreaks (high/increasing cases, increasing/high
  positivity increasing/high hospitalizations over 2 weeks (>100 per M))
• New York (296/M), Georgia, Texas, New Jersey, Arizona have highest per capita
  hospitalized patient numbers
• Midwest:
   –   Wisconsin showing drop in hospitalizations (61/M) and drop in cases (123/M)
   –   Indiana with decline in hospitalizations (129/M), and drop in cases (142/M)
   –   Illinois showing decline in hospitalizations (116/M), cases dropping (138/M)
   –   Ohio with declining hospitalizations (123/M) and drop in cases (176/M)
   –   Michigan showing continued decline in hospitalizations (72/M) and decline in cases (105/M)

                                                                                                    3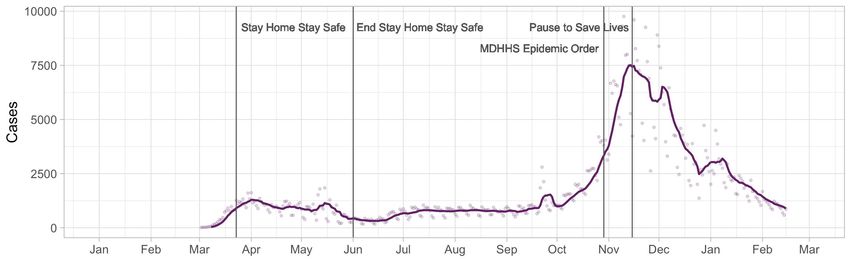
COVID-19 Spread
Statewide positivity has decreased to 3.5%, and is decreasing in all MERC regions
• All eight MERC regions now below 7% (Risk Level A)
• One region, Upper Peninsula, is below 3% (Risk Level Low)
• All counties (83) have positivity below 10%
Case rates have steadily declined to 94.7 cases per million (Risk Level D)
87% decrease from the mid-November peak and first time the state rate is below the Oct 1 rate
Declines are seen among all age groups, races, and ethnicities
In the past 30 days, about than one of six cases have unknown race and ethnicity
Variant is in Michigan: increased vigilance in use of masks and social distancing and increase testing
— 1,661 cases with the B.1.1.7 variant have been identified in the US (↑488), 314 in Michigan (↑247)
Number of active outbreaks is down 14% from previous week
— Reported school outbreaks have decreased since last week (107 to 104) with reported outbreaks decreasing among
Pre K-Elementary and administration.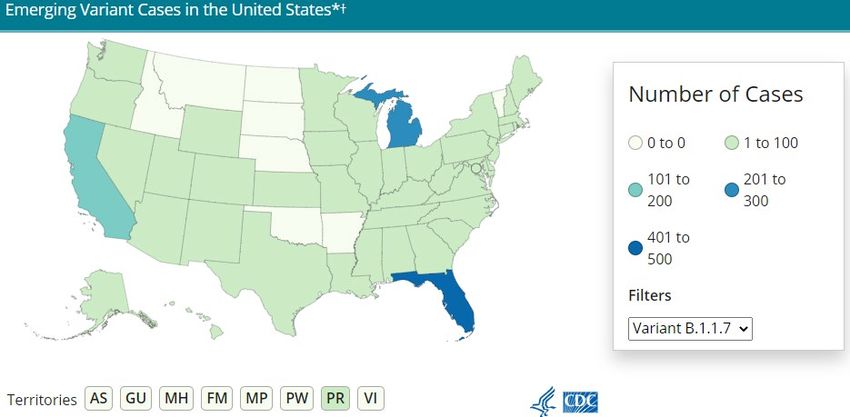
Confirmed and probable case indicators                                             Risk levels
Table Date: 2/20/2021 (7 days from date table was produced: 2/13/2021)   Low   A    B      C     D   E

 Cases                                             Positivity
Recent statewide trends
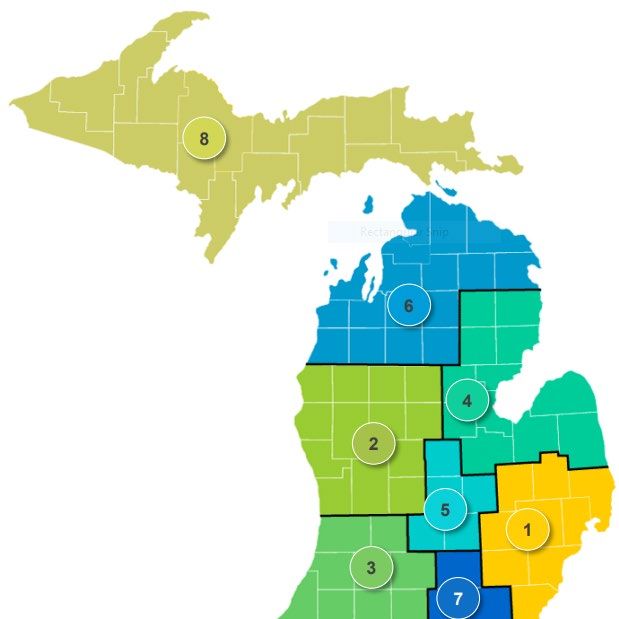
Statewide trends Regional breakdown: Cases, hospitalization rate, and
positivity
7-day average Daily values Positivity: 7-day average positivity, %
Cases: 7-day average cases per million
Hosp. rate: 7-day average hospitalization rate, %
15%
10%
Positivity, %
5% Positivity: 2.0%
Current: 3.5% Cases: 73.8
Hosp. rate: 1.3%
0%
11/23 12/7 12/21 1/4 1/18 2/1 2/15
800
Positivity: 3.1%
600 Cases: 86.7
Daily cases Hosp. rate: 2.1%
400
per million
200
Current: 94.7 Positivity: 4.1%
Positivity: 3.4%
0 Cases: 112.7
Cases: 82.3
11/23 12/7 12/21 1/4 1/18 2/1 2/15 Hosp. rate: 3.9%
Hosp. rate: 5.2%
20% Positivity: 4.8%
15% Cases: 123.3
Daily Hosp. rate: 7.3%
10% Positivity: 3.3%
hospitalization Cases: 88.6
5%
rate, % Current: 4.3% Positivity: 4.1%
Cases: 94.9
Hosp. rate: 4.1%
0%
Hosp. rate: 4.8%
11/23 12/7 12/21 1/4 1/18 2/1 2/15 Positivity: 4.9%
Cases: 113.1
Hosp. rate: 6.9%
Source: https://mistartmap.info/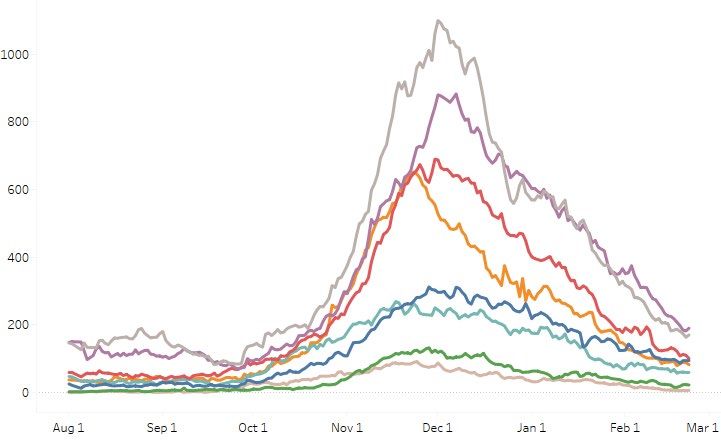
Positivity by county, 2/12-2/18
                                                 Average            # of counties             This week
                                                 positivity per day                           Last week

                                                       =20%           0
                                                                       1

                                                 Updates since last week:
                                                 0 of 83 counties saw double digit positivity in
                                                 the last week (4 county decrease)
                                                 2 of 83 counties saw positivity > 7% in the
                                                 last week (9 county decrease)
                                                 52 of 83 counties saw positivity > 3% in the
                                                 last week (6 county decrease)
 Source: SEOC Testing Results – Excluding MDOC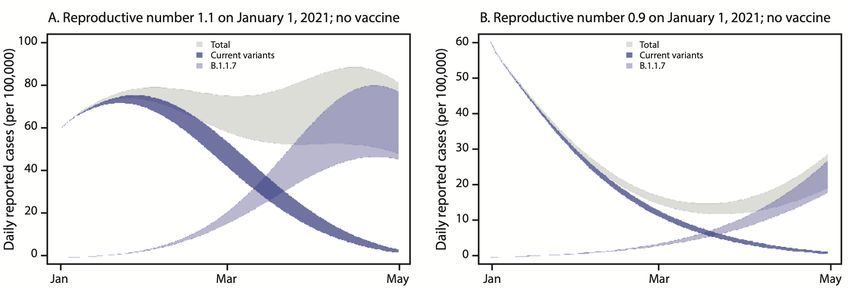
Age group: average new daily cases
Daily new confirmed and probable cases per million by age group (7-day rolling average)
1000
                      0-29          50-69
 900                  30-49         70+

 800

 700

 600

 500

 400

 300

 200

 100

     0
         3/1              4/1               5/1                6/1                 7/1   8/1   9/1   10/1   11/1   12/1   1/1   2/1

    •     All four age groups are decreasing
    •     Compared to other ages groups, 0-29 have deceased more slowly

Note: Case information sourced from MDHHS and reflects date of onset of symptoms
Source: MDHHS – Michigan Disease Surveillance System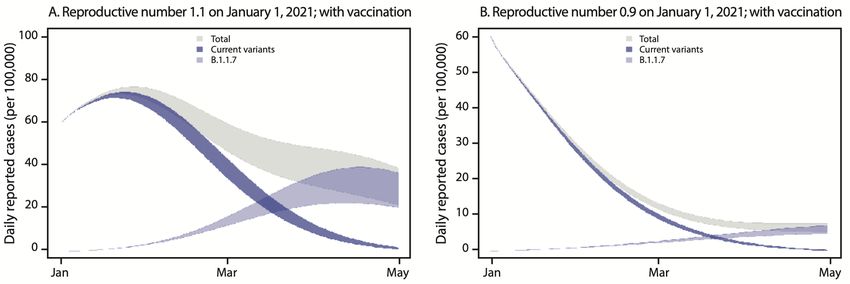
Age group: average new daily cases
Daily new confirmed and probable cases per million by age group (7-day rolling average)
1100                   0-9                 30-39               60-69
1000                   10-19               40-49               70-79
                       20-29               50-59               80+
 900

 800

 700

 600

 500

 400

 300

 200

 100

     0
      11/23                              12/7                             12/21    1/4   1/18   2/1   2/15
    •     Ages by decade are all decreasing
    •     Within the 0-29, those aged 10-19 and 20-29 are the two highest groups

Note: Case information sourced from MDHHS and reflects date of onset of symptoms
Source: MDHHS – Michigan Disease Surveillance System
Average daily new cases per million people by race and ethnicity

        Daily new confirmed and probable cases per million                                                    Daily new confirmed and probable cases per
        (7 day rolling average) by race category                                                              million (7 day rolling average) by ethnicity category
                        American Indian/Alaska Native                     Black/African American                           Hispanic or Latino         Not Hispanic or Latino
          600
                        Asian/Pacific Islander                            White                                600

          500                                                                                                  500

          400                                                                                                  400

          300                                                                                                  300

          200                                                                                                  200

          100                                                                                                  100

              0                                                                                                 0
                  3/1   4/1     5/1     6/1     7/1      8/1     9/1 10/1 11/1 12/1 1/1                 2/1          3/1   4/1   5/1   6/1      7/1   8/1   9/1 10/1 11/1 12/1 1/1   2/1

Updates since last week:
•    Cases per million are now decreasing for all racial groups, as well as both Hispanic/Latinos and non-Hispanic/Latinos
•    In the past 30 days, 22% of all cases represent unknown, multiple, or other races (14% of race is unknown, ↔)
•    In the past 30 days, 17% of all cases have an unknown ethnicity reported (↓1%)

Note: Case information sourced from MDHHS and reflects date of death of confirmed and probable cases.
Source: MDHHS – Michigan Disease Surveillance System
Identified US COVID-19 Cases Caused
by All Variants of Concern
State Cases Count
FL 433
MI* 314
CA 195
GA 85
NY 82
CO 71
TX 60
NJ 50
34 other states < 50
* 104 additional cases identified within MDSS that do not yet
appear on the CDC dashboard
Data last updated February 21, 2021
Source: https://www.cdc.gov/coronavirus/2019-ncov/transmission/variant-cases.htmlMichigan COVID-19 Variant and Response
• 314 B.1.1.7 cases and counting
• 19 counties
• 192 cases within MDOC (61%)
• Not including MDOC staff
• 1 case undergoing investigation to determine county
• Goal: Slow spread of B.1.1.7 to allow for vaccination of
vulnerable individuals
• Public Action:
• Masks
• Social Distancing
• Hand washing
• Get tested if traveled out of MI in last 14 days
*
* Six cases within Detroit CityNumber of outbreak investigations by site type, week ending Feb 4
Easier to identify outbreak
Pr e - d ecision al, f o r d iscussion o nly Dr af t Harder to identify outbreak
Site type Outbreaks by ongoing/new classification, # Visibility1 Total number of active
Ongoing New Total outbreaks is down 14% from
previous week
SNF/L T C/ O T HE R A SSIS T E D LIV ING 230 21 251
K- 12 SCHO O L 86 18 104
59 11 70 Following SNF/LTC, the
MA NUF A CT UR IN G , CONS T R U CT IO N
HEA L T HCA R E 28 5 33 greatest number of new
*RETA IL 24 4 28 outbreaks were reported in K-
COLL EG E/ U N IV E R S IT Y 25 2 27 12 (18), and manufacturing/
OFF ICE SET T IN G 21 4 25 construction (11).
CHIL DCA R E/Y O U T H PRO G RA M 17 2 19
OTHER 13 3 16 LHDs reported new outbreaks
CORRE C T I O N S 15 0 15 in all settings except outdoor
*SOCIA L GA THER IN G 7 3 10 community exposures, indoor
A GRICU L T U RA L / F O O D PRO CE S S I NG 7 2 9 community exposures, and
*SHEL T E RS 8 1 9 personal services
*REL I G I O U S SERV I CE S 6 2 8
*RES TA U RA N T S A ND BA RS 3 2 5
*PER S O NA L SERV IC E S 1 0 1
*CO MMU N IT Y EXPO S UR E - INDO O R 1 0 1
*CO MMU N IT Y EXPO S UR E - OUT DO O R 0 0 0
TO TA L 551 80 631
1. Based on a setting’s level of control and the extent of time patrons/residents spend in the particular setting, different settings have differing levels of ability to ascertain whether a case derived from that setting
NOTE: Many factors, including the lack of ability to conduct effective contact tracing in certain settings, may result in significant underreporting of outbreaks. This chart does not provide a complete picture of
outbreaks in Michigan and the absence of identified outbreaks in a particular setting in no way provides evidence that, in fact, that setting is not having outbreaks.
Source: LHD Weekly SitrepsK-12 school outbreaks, recent and ongoing, week ending Feb 4
Number of reported outbreaks decreased since last week (107 to 104) including decreases in Pre K-Elementary (38 to 32), and
Administrative (4 to 3). Only Middle/Jr High (21 to 24), and High Schools (44 to 45) had an increase in reported outbreaks.
Number of Range of cases
Region Number of reported cases,# # Ongoing - Excluding New # New outbreaks per outbreak
Region 1 93 13 19 2-24
Region 2n 18 16 12 2-5
Region 2s 17 11 8 2-6
Region 3 212 18 19 2-48
Region 5 22 8 9 2-8
Region 6 96 22 19 2-24
Region 7 51 6 15 2-8
Region 8 29 3 3 5-20
Total 538 97 104 2-48
Number of Range of cases
Grade level Number of reported cases,# # Ongoing - Excluding New # New outbreaks per outbreak
Pre-school - elem. 121 21 32 2-23
Jr. high/middle school 149 16 24 2-20
High school 261 58 45 2-48
Administrative 7 2 3 2-5
Total 538 97 104 2-48
Many factors, including the lack of ability to conduct effective contact tracing in certain settings, may result in significant underreporting of outbreaks. This chart does not provide a complete picture
of outbreaks in Michigan and the absence of identified outbreaks in a particular setting in no way provides evidence that, in fact, that setting is not having outbreaks.
Source: LHD Weekly SitrepsCOVID-19 and Healthcare Capacity and COVID Severity Hospitalizations and ICU utilization are decreasing COVID-like illness (CLI) continues with downward trend and is below 2% (data in appendix) Hospitalizations down 82% since December 1st peak ICU occupancy declined 13% over last week Eight regions below 15% of Adult ICU beds with patients positive for COVID; six regions below 10% Current deaths are a lagging indicator of cases, but the number of deaths have declined for nine weeks 79% decrease from the peak on December 10 Decreases in deaths seen among most ages, races, and ethnicities
Statewide Hospitalization Trends: Total COVID+ Census
         Hospitalization Trends 7/1/2020 – 2/22/2021          This week, COVID+ census in hospitals is
     Confirmed Positive & Persons Under Investigation (PUI)   down 14% from the previous week and
                                                              down 82% from the December 1 peak.

                                                              Hospitalizations are similar to levels seen in
                                                              Oct 2020.

                                                                   Hospitalized COVID Positive Long Term
                                                                      Trend (beginning March 2020)

            Confirmed Positive
                                                  PUI

                                                                                                           16
Statewide Hospitalization Trends: Regional COVID+ Census
All regions are showing decreasing or flat
Hospitalization Trends 8/1/2020 – 2/22/2021
trends in COVID+ hospitalizations.
Confirmed Positive by Region
Region 1 All regions are below 100 hospitalized per
Region 2N million of the population for the first time
Region 2S
Region 3
since October.
Region 5
Region 6
Region 7 Region COVID+ COVID+
Region 8
Hospitalizations (% Δ Hospitalizations
from last week) / MM
Region 1 94 (-3%) 87/M
Region 2N 170 (-17%) 77/M
Region 2S 190 (-16%) 85/M
Region 3 100 (21%) 88/M
Region 5 59 (-16%) 62/M
Region 6 82 (-8%) 56/M
Region 7 22 (-4%) 44/M
Region 8 6 (-14%) 19/M
17Statewide Hospitalization Trends: ICU COVID+ Census
The census of COVID+ patients in ICUs continue to
Hospitalization Trends 8/1/2020 – 2/22/2021 decline overall, with nearly all regions showing
Confirmed Positive in ICUs declining trend. Overall, this week is down 13%
from the previous.
All regions are at/below 85% overall ICU occupancy
and 6/8 regions have less than 10% of ICU beds
occupied with COVID+ patients.
Region Adult COVID+ in Adult ICU % of Adult ICU
ICU Occupancy beds COVID+
Region 1 23 84% 12%
Region 2N 42 68% 7%
Region 2S 49 76% 6%
Confirmed Positive in ICU Region 3 25 85% 7%
Region 5 21 79% 14%
Region 6 32 71% 9%
Region 7 11 62% 6%
Region 8 5 50% 9%
Hospital bed capacity updated as of 2/19
18Average and total new deaths, by age group
Daily confirmed and probable deaths per million by Total confirmed and probable deaths by age group
age group (7 day rolling average) (past 30 days, ending 2/13/2021)
0-19 40-49 70-79
20-29 50-59 80+
200
30-39 60-69 Total
180 10% of deaths below age sixty
160
655
140
120
100
326
80
60 233
40
20 89
8 9 30
0 1-5
11/23 12/7 12/21 1/4 1/18 2/1 2/15
0-19 20-29 30-39 40-49 50-59 60-69 70-79 80+
Note: Death information sourced from MDHHS and reflects date of death of confirmed and probable cases.
Source: MDHHS – Michigan Disease Surveillance System30-day rolling average daily deaths per million people by race and
ethnicity
Average daily deaths per million people by race Average daily deaths per million people by
ethnicity
American Indian/Alaska Native Black/African American Hispanic or Latino Not Hispanic or Latino
15 Asian/Pacific Islander White 15
10 10
5 5
0 0
11/23 12/7 12/21 1/4 1/18 2/1 2/15 11/23 12/7 12/21 1/4 1/18 2/1 2/15
Updates since last week:
• Deaths are a lagging indicator of cases, and death rates are decreasing among racial and ethnic groups
• Whites and Non-Hispanic/Latino have the most reported deaths per capita
• Deaths are not adjusted for confounders (e.g., age, sex, comorbidities)
Note: Death information sourced from MDHHS and reflects date of death of confirmed and probable cases.
Source: MDHHS – Michigan Disease Surveillance SystemHow is public health capacity?
Diagnostic testing volume (PCR and antigen) has decreased from last week to 35,462
• PCR testing has also decreased (28,764)
• 18.9% are antigen tests (6,697)
Cases identified for investigations has plateaued
• Proportion of completed interviews has dropped since previous week
• Consistent low proportion of cases interviewed with a source of known infection (indicating community acquisition)
• Consistent low proportion of those quarantining when their symptoms begin (indicating no effective halt in community
transmission)`
Daily diagnostic tests, by message date
Last 90 Days Tests By Test Type and Message Date Weekly Update
90,000 • 35,462 rolling 7-day
80,000
average daily
diagnostic tests
70,000 reported to MDHHS
60,000 (PCR + Ag)
50,000
• 28,764 average daily
PCR tests
40,000
• 18.9% are antigen
30,000 tests over the past
20,000
week
• 2.5% positivity in
10,000
antigen tests
-
1/2/2021
1/4/2021
1/6/2021
1/8/2021
2/1/2021
2/3/2021
2/5/2021
2/7/2021
2/9/2021
12/1/2020
12/3/2020
12/5/2020
12/7/2020
12/9/2020
1/10/2021
1/12/2021
1/14/2021
1/16/2021
1/18/2021
1/20/2021
1/22/2021
1/24/2021
1/26/2021
1/28/2021
1/30/2021
2/11/2021
2/13/2021
2/15/2021
2/17/2021
11/21/2020
11/23/2020
11/25/2020
11/27/2020
11/29/2020
12/11/2020
12/13/2020
12/15/2020
12/17/2020
12/19/2020
12/21/2020
12/23/2020
12/25/2020
12/27/2020
12/29/2020
12/31/2020
Total Diagnostic Tests Total Antigen Tests 7 day moving average, diag. tests
Source: MDSS/Michigan Medical Advantage Group, MDHHS, testing labsNew Case Investigation Metrics (Statewide)
New Communicable Disease metrics slightly increased since last week:
• 42% of investigated cases having a known source (45% last week, 47% week prior)
• 25% of investigated cases noting that they were quarantining before symptoms (25% last week)
02/06-02/12 Case report form information 02/13-02/19 Case report form information
6,343
Yes No Not answered
5,387
2,216 4,127 4,127
17% 29%
2,010
3,377 3,377
38% 15% 24%
4,127 46%
(65%) 3,377 43%
(63%) 51%
45%
25% 42%
25%
Case investigation complete? Known source of infection? Already quarantining at time Case investigation complete? Known source of infection? Already quarantining at time
of symptom onset? of symptom onset?
Source: MDHHS – Michigan Disease Surveillance SystemCOVID-19 Vaccination
22nd in nation for doses administered per 100,000 people4.2%
More than 1.94 million doses reported to MDHHS
15.5% of aged 16+ years have first dose of vaccine (up from 13.7% last week)
• 674,668 people fully vaccinated
• 37.3% of people 65-74 years and 40.8% of people over 75 have had at least one dose
Of all doses reported in the last week, 31% are first doses administered to people aged 65 and older
Race data added to website
• Caveat: 43.7% missing race information
• Coverage was highest among those of White Race (7.9% and 4.7%)
LTC Federal Pharmacy Partnership:
• Percent of LTC with first clinic completed at 82% (up from 76% last week)
• 297,416 doses provided to residents and staff (up from 166,717 week prior)
• 695 clinics scheduled this week
•Michigan COVID Vaccine Distribution & Administration
as of 02/22/2021
State Rank
Total Distributed (Number) 10
Distributed per 100K 26
Total Administered (Number) 9
Administered per 100K* 22
People with One+ Doses (Number) 9
People with One+ Doses per 100k 36
People with Two Doses (Number) 7
People with Two Doses per 100k 16
CDC Ranking Data for the 50 States as of February 22, 2021 at 12:26 pmDoses Shipped and Administered
13.7% of Michigan residents have initiated their COVID vaccination series and 6.3% have completed their series.
Enrolled Doses Total Doses Administered 1st Dose 2nd Dose
Providers Shipped Coverage, Coverage,
16+ 16+
Data as of 2/22/21 2/23/21 2/22/21 1st Dose 2nd Dose 2/22/21 2/22/21
Michigan Distributed 2,433 2,119,825 1,942,759 1,261,798 380,961 15.5% 8.3%
Federal Programs 499,200
Total Distribution 2,619,025Vaccination by Age
Vaccine Coverage by Age Group
Group (2/22/21 data) 45
40.8
40
34.5
35
More than 660,036 people aged 65
years or older have received one or 30
more doses of vaccine (up 17% from
561,553 last week). 25
20 18.3
Persons 75 years of age and older
have the highest initiation coverage 15.1
15
(40.8% up from 35.4% last week) 11.7 11.7
10.3
10
7.1 7.6 7.1
6.4
31% of all doses have been 4.3
administered in the last week have 5
been to people aged 65 and older 1.1 0.6
0
16-19 20-29 30-39 40-49 50-64 65-74 75+
Initiation CompletionDoses Administered Per Day (2/22/21)
5 days administering more than 60,000 doses/day
13 days administering more than 50,000 doses/day
Over 68,000 doses administered in a single day.Data on Race and Ethnicity
• 1,252,497 Michigan residents Coverage by Race, 2/22/20
received >=1 dose of vaccine 9
7.9
• >70% missing ethnicity information 8
7
• 43.7% missing race information
Percent of Population
6 5.4
• 41.7% were of White race 5 4.7
5
• ~5% were of Black or African 4
4.1
3.6
American (3.7%), Asian 3
2.8
or Pacific Islander (1.1%) or 2 1.6
American Indian/Alaskan Native 1
(0.3%) race
0
• Coverage was highest among those White Black or African
American
Asian, NH or PI American Indian
of White Race (7.9% and 4.7%) Initiation CompletionFederal Long-Term Care Facility (LTCF) Pharmacy Partnership
Program Data as of 2/18/21 (most recent available)
1st Clinic Residents & Staff Clinics
Facilities % 2nd Clinic Complete
Complete Vaccinated Next 7 Days
Pharmacy and Phase
CVS Part A (SNF) 269 269 100% 100% 56,712 0
CVS Part B (Other LTCF) 717 717 100% 76% 52,334 0
Walgreens Part A (SNF) 145 145 100% 100% 30,057 29
Walgreens Part B (Other LTCF) 2,056 2,056 100% 34% 64,266 550
Managed Health Care Assoc (Other LTCF) 1,192 410 32% 2% 4,047 116
Totals 4,379 3,597 82% 207,416 695`
Percent of LTC with first clinic completed at 82% (up from 76% last week)
297,416 doses provided to residents and staff (up from 166,717 week prior)
695 clinics scheduled this weekScience Round Up
• CDC modeling study suggests B.1.1.7 could become the predominant variant by the end of March
• Most recent mobility data shows some return toward baseline mobility patterns, particularly for numbers of trips taken
and non-essential visitsCDC modeling study suggests B.1.1.7 could become
the predominant variant by the end of March
• Model suggests B.1.1.7
Without Vaccination
may become predominant
by end of March based on
UK data suggesting 1.5x
transmissibility for B.1.1.7
• However, with mitigation
measures and vaccination
(assuming 1 million
doses/day across the US),
overall spread can be
With Vaccination
contained even as variant
transmission grows
Galloway et al., MMWR 2021. Compartmental model
assuming an initial Rt of 1.1 or 0.9 for existing lineages,
with B.1.1.7 Rt = 1.5 x Rt for existing lineages. Initial
prevalence of B.1.1.7 estimated at 0.5% based on SGTF
data, and the model assumed an initial incidence of 60
daily cases per 100,000. Bands represent simulations with
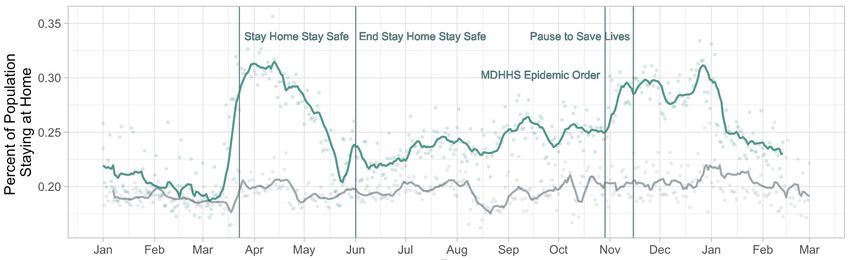
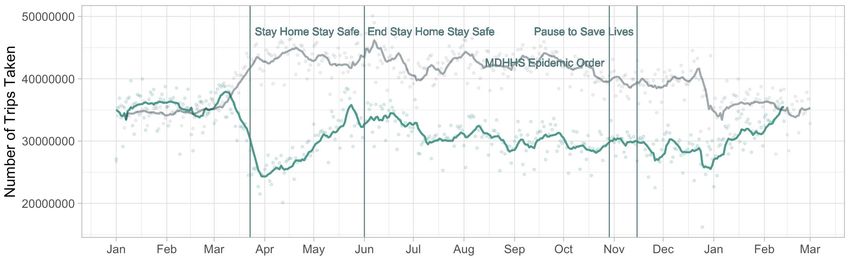
10%–30% population-level immunity as of January 1, 2021.How many people are staying at home in Michigan?
2020 • % Stay-at-home levels
2019 increased in
November
• Recently declined
back to pre-November
levels, though still
higher than 2019
• Number of trips
taken/day has
recently increased to
2019 levels
• Most recent data is
2/22/21
Data Source: Bureau of
Transportation StatisticsChange in average mobility
Unacast mobility
patterns in MI
• Most recent data shows Change in non-essential visits
some return toward
baseline mobility
patterns, particularly
for non-essential visits.
• Encounter density has
stayed relatively low. Difference in encounter density
• Data through 2/22/21
unacast social distancing
scoreboard
https://www.unacast.com/co
vid19/social-distancing-
scoreboardYou can also read