Michigan Climate and Health Profile Report - State of ...
←
→
Page content transcription
If your browser does not render page correctly, please read the page content below
Michigan Climate and Health Profile Report

                             2015
Building Resilience Against Climate Effects on Michigan’s Health

         Michigan Department of Health and Human Services
                    Division of Environmental Health
           Climate and Health Adaptation Program (MICHAP)

                                &
    Great Lakes Integrated Sciences Assessments Program (GLISA)

                                                                  1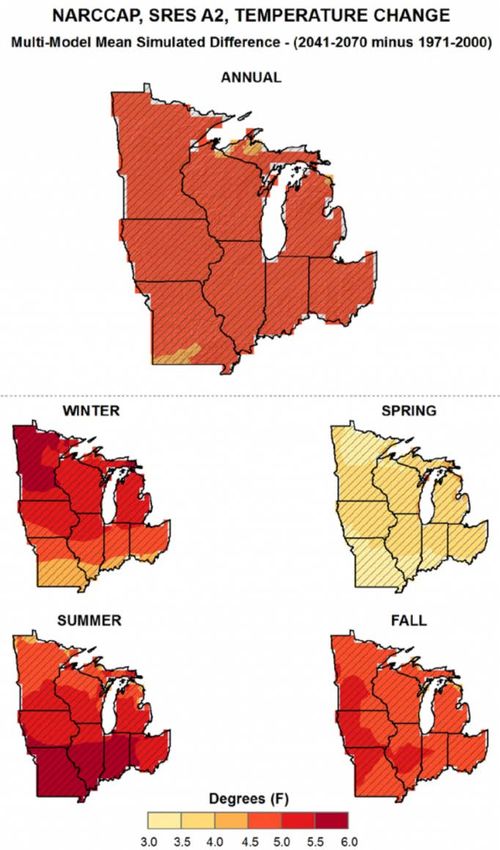
Authors
Principal Investigator, MICHAP, MDHHS              Climatologist, University of Michigan Climate
Lorraine Cameron, MPH, PhD                         Center, GLISA
                                                   Laura Briley, MS
Program Manager, MICHAP, MDHHS
Aaron Ferguson, MPA                                Climatologist, University of Michigan Climate
                                                   Center, GLISA
Climate and Health Epidemiologist, MICHAP,         Daniel Brown, MS
University of Michigan
Robert Walker, MPH

                                           Contributors
Epidemiologist, MDHHS                             Director, University of Michigan Climate Center,
Thomas Largo, MPH                                 GLISA
                                                  Elizabeth Gibbons, MUP
Medical Entomologist, MDHHS
Eric Foster, MPH                                  Associate Professor of Environmental Health
                                                  Sciences and Epidemiology, University of
Applied Epidemiology Waterborne Disease           Michigan
Fellow, CDC/CSTE                                  Marie O’Neill, PhD
Leigh Tyndall Snow, MPH
                                                  Associate Professor of Urban and Regional
Applied Epidemiology Vector-borne Disease         Planning and Natural Resource, University of
Fellow, CDC/CSTE                                  Michigan
Veronica Fialkowski, MPH                          Larissa Larsen, PhD

Assistant Professor of Epidemiology and
Biostatistics, Michigan State University
Julie Wirth, PhD

Suggested Reference:
Cameron, L., A. Ferguson, R. Walker, D. Brown, & L. Briley, 2015: Michigan climate and health profile
report 2015: Building resilience against climate effects on Michigan’s health. Accessed at:
www.michigan.gov/climateandhealth.

                                                                                                        2
External Reviewers
MI Department of Environmental Quality           State Climatologist of Michigan
Water Resources Division                         Michigan State University
Charles Hill                                     Department of Geography
Christie Alwin                                   Jeffrey A. Andresen, Ph.D.

Air Quality Division
Kaitlyn Leffert
Joy Taylor Morgan

Acknowledgement:
This report was supported by the Cooperative Agreement Number EH001124 from the Centers for
Disease Control and Prevention. Its contents are solely the responsibility of the authors and do not
necessarily represent the official views of the Centers for Disease Control and Prevention.

                                                                                                  3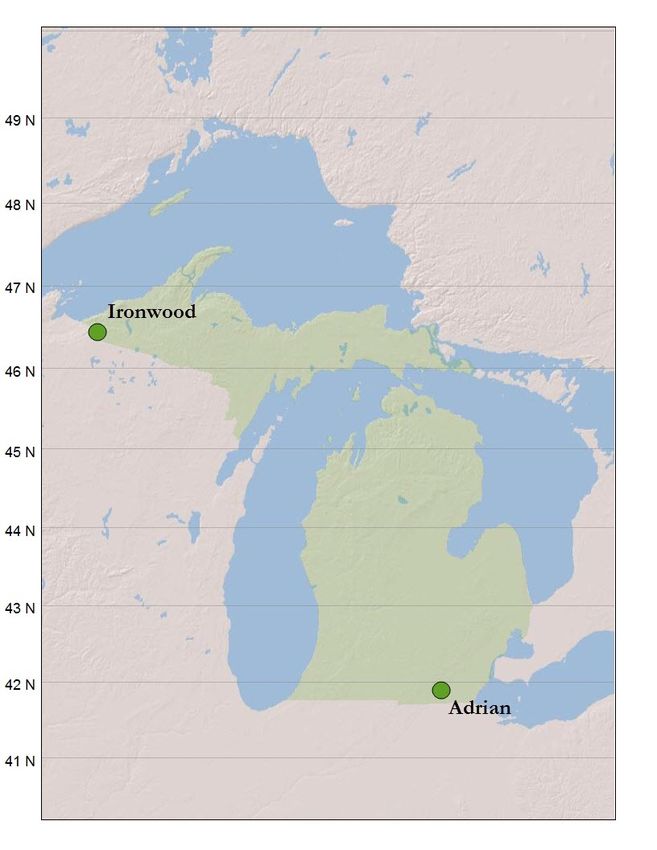
Table of Contents
List of Figures and Tables ............................................................................................................................ 5
List of Acronyms .......................................................................................................................................... 7

Executive Summary..................................................................................................................................... 9

I.       Building a Resilient Public Health System ......................................................................................... 10
      Introduction .......................................................................................................................................... 11
      Rationale and Objectives ...................................................................................................................... 11
      History of MDHHS Engagement with Climate and Health.................................................................... 13
      Geographic Scope ................................................................................................................................. 13
      Economic Features ................................................................................................................................ 18
      Natural Features ................................................................................................................................... 18
      Introduction to Michigan’s Climate ...................................................................................................... 20
      References ............................................................................................................................................ 22
II.      Michigan’s Current and Future Climate Conditions ......................................................................... 23
      Baseline Climate Description ................................................................................................................ 24
      Summary of Climate Projections: Description and Rationale .............................................................. 31
      Summary of Climate Projections: Spatial and Temporal ...................................................................... 34
      Appendix ............................................................................................................................................... 43
      References ............................................................................................................................................ 44
III. Linking Climate Changes to Health Outcomes.................................................................................. 47
      Introduction .......................................................................................................................................... 48
      Climate Related Health Impact Pathway Descriptions ......................................................................... 48
      Conclusions ........................................................................................................................................... 61
      Health Outcomes Surveillance Systems................................................................................................ 61
      Exposure Surveillance Systems ............................................................................................................. 63
      References ............................................................................................................................................ 67
IV. Michigan’s Vulnerabilities to Climate Change .................................................................................. 74
      Defining Vulnerability Assessments...................................................................................................... 75
      Priority Health Outcome Vulnerabilities............................................................................................... 78
      Climate exposures, vulnerability, and health outcomes ...................................................................... 81
      References ............................................................................................................................................ 82
V.       The Burden of Climate Change and Human Health .......................................................................... 84
      Introduction .......................................................................................................................................... 85
      Future Health Impacts from Climate Change ....................................................................................... 85
      Regional Considerations ....................................................................................................................... 87
      Summary and Synthesis ........................................................................................................................ 89
VI. Partnerships and Collaborations....................................................................................................... 94
      Introduction .......................................................................................................................................... 95
      Description of Partnerships and Collaborations ................................................................................... 95

                                                                                                                                                               4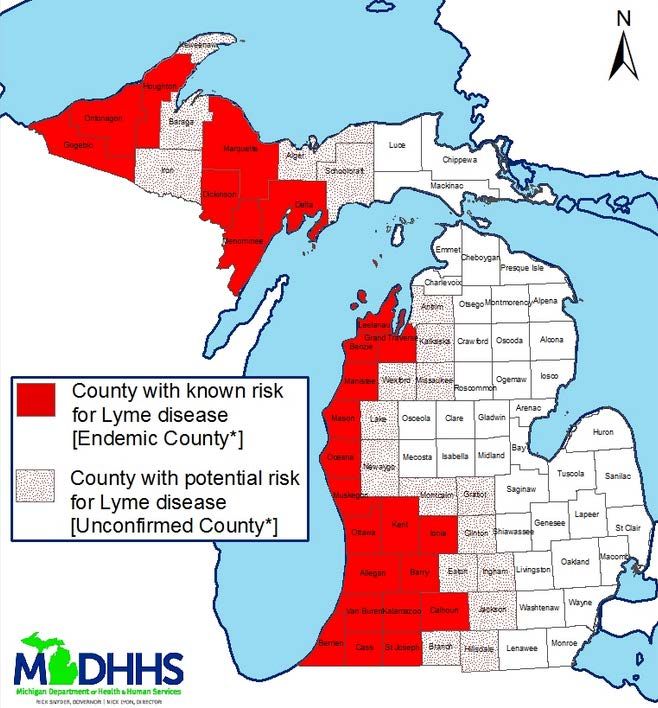
List of Figures and Tables

Figures

I. Building a Resilient Public Health System
   1.1: Major Political Boundaries of Michigan
   1.2: Michigan Population Density (by census tract)
   1.3: Percentage of non-White Population by Census Tract in Michigan
   1.4: Median Age of Population by Census Tract in Michigan
   1.5: Natural Features of Michigan
   1.6: Elevation of Michigan

II. Michigan’s Current and Future Climate Conditions
   2.1: Michigan Reference Map Indicating Latitudinal Coverage
   2.2: NOAA Climate Division Boundaries and Climate Observation Station Locations
   2.3: Air Masses over the United States
   2.4: Typical January-March Weather Anomalies and Atmospheric Circulation during Moderate to Strong El
 Nino & La Nina
 2.5: Approximate Extent of Major Lake-Effect Snow Belts in the Great Lakes Region
 2.6: Projected annual and seasonal temperature changes
 2.7: Projected change in annual number of days falling below 32 degrees F
 2.8: Projected annual number of days exceeding 950 F averaged
 2.9: Projected annual number of consecutive hot days exceeding 950 F averaged
 2.10: Projected change in the number of days in the freeze-free season, and observed and simulated freeze-
 free days per year
 2.11: Projected annual and seasonal precipitation changes (%) averaged
 2.12: Projected annual number of days with more than 1" of precipitation averaged
 2.13: Projected annual number of days with less than 3mm (0.1 in.) of precipitation averaged

III. Linking Climate Changes to Health Outcomes
   3.1: Extreme heat related direct and indirect conceptual human health impact pathway based on climate
 changes resulting from increased Greenhouse Gas Emissions (GHG)
 3.2: Statewide Heat-Related ED Visits as reported to the Michigan Syndromic Surveillance System and
 National Oceanic and Atmospheric Administration (NOAA) Maximum Daily Temperature Averages for 6 Select
 Cities (April 1 – August 31, 2013)
 3.3: Annual rate of allergic disease-related hospitalizations in Michigan
 3.4: Maps of 2013 Michigan ’exposed’ Lyme disease cases per 100,000 (left), and risk of encountering infected
 ticks based on field surveys (right). The endemic range of infected ticks is increasing over time
 3.5: Precipitation related direct and indirect conceptual human health impact pathway based on climate
 changes resulting from increased Greenhouse Gas Emissions (GHG)
 3.6: Summer and winter extreme weather event related direct and indirect conceptual human health impact
 pathway based on climate changes resulting from increased Greenhouse Gas Emissions (GHG)
 3.7: Household power outages by county as reported in the press on December 22-23, 2013
 3.8: Carbon Monoxide chief complaint emergency department (ED) visits by county of residence December
 21-29, 2013

                                                                                                              5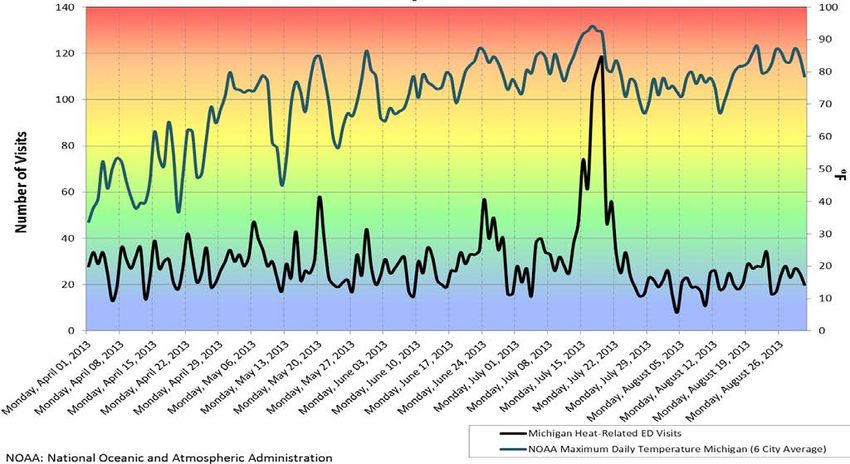
IV. Michigan’s Vulnerabilities to Climate Change
  4.1: Vulnerability Assessment Model

V. The Burden of Climate Change and Human Health
  None

VI. Partnerships and Collaborations
  None

Tables

I. Building a Resilient Public Health System
   1.1: Michigan Climate & Health Adaptation Program BRACE Goals and Objectives
   1.2: Previous Michigan Climate and Health Program Grants: Objectives & Key Findings
   1.3: Michigan’s Largest Cities (2013 estimate)
   1.4: Demographic characteristics of Michigan and its two largest cities
   1.5: Michigan Industries and their significant contributions to GDP, employment, and services
   1.6: Michigan Natural Feature Statistics

II. Michigan’s Current and Future Climate Conditions
   2.1: Changes in average annual and seasonal temperatures (in degrees F) from the 1951-1980 period to the
  1981-2010 period for Michigan’s ten NOAA Climatic Divisions
  2.2: Changes in average annual temperatures, average mid-day high temperatures, and average overnight low
  temperatures (in degrees F) from 1951-1980 to 1981-2010 for 22 weather observation stations in Michigan
  2.3: Percent change in mean total annual and seasonal precipitation from the 1951-1980 period to the 1981-
  2010 period for Michigan’s ten NOAA Climatic Divisions
  2.4: Percent change in total annual precipitation from 1951-1980 to 1981-2010 for 22 Michigan weather
  observation stations
  2.5: Change in average number and percent of days per year with precipitation >1 inch from 1951-1980 to the
  1981-2010 period for 22 Michigan weather observation stations
  2.6: Change in average number of days with extreme heat (>90oF) and extreme cold (< 32o F) temperatures
  from 1951-1980 to 1981-2010 for 22 Michigan weather observation stations
  2.7: Temperature Projection Summary for Michigan
  2.8: Precipitation Projection Summary for Michigan

III. Linking Climate Changes to Health Outcomes
  None

IV. Michigan’s Vulnerabilities to Climate Change
  4.1: Summary of “sensitivity” and “exposure” risk factors of vulnerability for 5 priority health outcomes in
  Michigan

V. The Burden of Climate Change and Human Health
  5.1: Summary of Future Impacts to Priority Health Outcomes Based on Existing Vulnerabilities and Climate
  Change Projections

VI. Partnerships and Collaborations
  None

                                                                                                                 6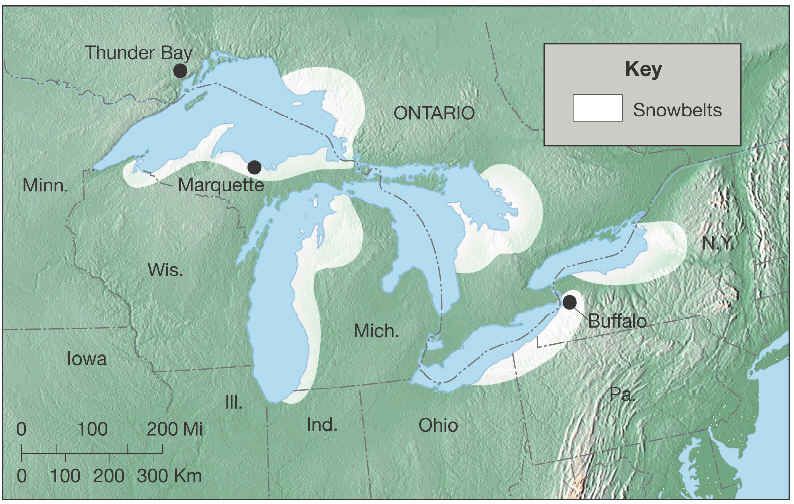
List of Acronyms

AMU         Air Monitoring Unit
AQD         Air Quality Division
AQI         Air Quality Index
ASTHO       Association of State and Territorial Health Officials
BRACE       Building Resilience Against Climate Effects
BRFSS       Behavioral Risk Factor Surveillance System
CAA         Clean Air Act
CAP         Climate Action Plan
CDC         Centers for Disease Control & Prevention
CHPR        Climate and Health Profile Report
CMAQ        Community Multi-scale Air Quality
CMIP3       Climate Model Inter-comparison Project phase 3
CO          Carbon Monoxide
CRSCI       Climate Ready States & Cities Initiative
CSO         Combined Sewer Overflow
CSTE        Council of State and Territorial Epidemiologists
CWS         Community Water System
DCAC        Detroit Climate Action Collaborative
DEJ         Detroiters for Environmental Justice
DEQ         Michigan Department of Environmental Quality
DS          Downscaler
DVRHS       Division for Vital Records and Health Statistics
ED          Emergency Department
ENSO        El Niño-Southern Oscillation
EPA         Environmental Protection Agency
FEMA        Federal Emergency Management Agency
GCM         Global Climate Models
GHG         Greenhouse Gas Emissions
GLISA       Great Lakes Integrated Sciences + Assessments Program
HAAS        Haloacetic Acids
IPPC        The United Nations Intergovernmental Panel on Climate Change
LHD         Local Health Department
LIAA        Land Information Access Association
MALEHA      Michigan Association of Local Environmental Health Administrators
MAP         Michigan Association of Planners
MCC         Michigan Climate Coalition
MDHHS       Michigan Department of Health and Human Services
MDHHS-DEH   Michigan Department of Health and Human Services Division of Environmental
            Health
MDHHS-      Michigan Department of Health and Human Services Climate and Health
MICHAP      Adaptation Program

                                                                                         7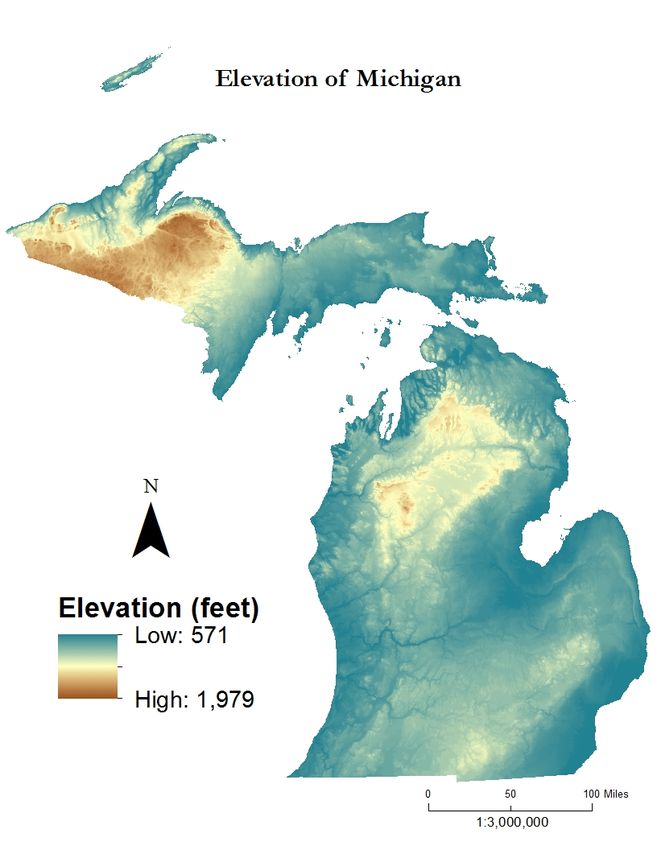
MDSS      Michigan Disease Surveillance System
MGC       Michigan Green Communities
MiBRFS    Michigan Behavioral Risk Factor Survey
MICHAP    Michigan Climate & Health Adaptation
MIDB      Michigan Inpatient Database
MiSWIMS   Michigan Surface Water Information Management System
MML       Michigan Municipal League
MPHA      Michigan Public Health Association
MRLC      Multi-Resolution Land Characteristics
MSSS      Michigan Syndromic Surveillance System
MSU       Michigan State University
NAAQS     National Ambient Air Quality Standards
NARCCAP   North American Regional Climate Change Assessment Program
NLCD      The National Land Cover Database
NNDSS     National Notifiable Diseases Surveillance System
NOAA      National Oceanic and Atmospheric Administration
NTNCWS    Non-Transient Non-Community Water System
NWS       National Weather Service
OPHP      Office of Public Health Preparedness
RCM       Regional Climate Models
RTB       Retention Treatment Basin
SDWIS     Safe Drinking Water Information System
SES       Socio-Economic Status
SSO       Sanitary Sewer Overflows
TNCWS     Transient Non-Community Water System
TTHM      Trihalomethanes
U of M    University of Michigan
WICCI     Wisconsin Climate Change Initiative’s
WMEAC     West Michigan Environmental Action Council
WNV       West Nile Virus
WRD       Water Resources Division

                                                                      8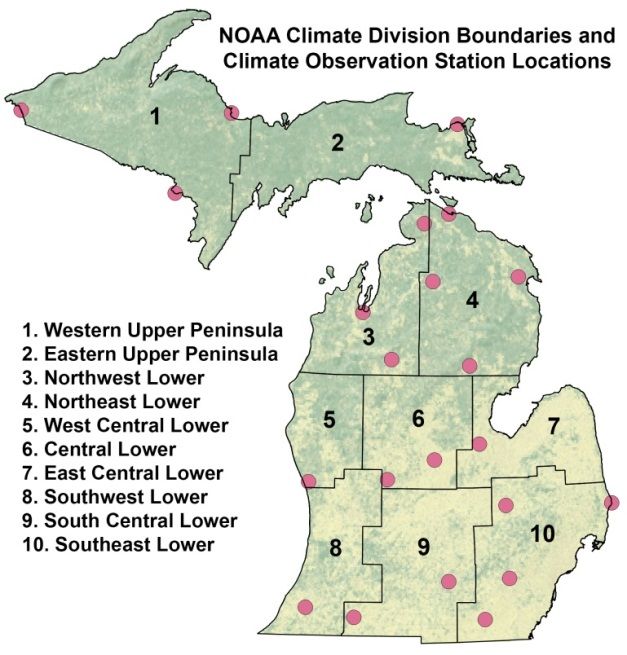
Executive Summary

Through the 20th and into the 21st century, Michigan’s climate has changed in measurable and
impactful ways. Since 1951 the average annual temperature has increased by 0.6°F in the southeastern
Lower Peninsula, and up to 1.3°F in the northwestern Lower Peninsula. During that same period total
annual average precipitation across the state increased by 4.5%, or 1.4 inches. Additional changes
include an increased frequency of some types of weather extremes such as heavy precipitation events.
These changing climate conditions have had an impact on both environmental and human systems,
representing an emerging threat to public health in Michigan. In response, the Michigan Department of
Health and Human Services Climate and Health Adaptation Program (MDHHS – MICHAP) in partnership
with the Great Lakes Integrated Sciences Assessments Program (GLISA) is using the Centers for Disease
Control and Prevention’s (CDC) Building Resilience Against Climate Effects (BRACE) framework to build
capacity for public health adaptation at the state and local levels. This Climate and Health Profile
Report is the initial step of the BRACE framework, laying the foundation for future assessments of
vulnerability, disease burden, and interventions.

Based on current trends and projections of the most recent period for which information is available,
2021 – 2050, the most likely impacts from climate change in Michigan are extreme heat events,
defined as prolonged periods of increased temperatures and humidity; changes in precipitation
patterns, including excess rain leading to flooding; and extreme weather such as heavy snow and
freezing rain. For Michigan, five priority climate-related health outcomes have been identified:
respiratory diseases, heat related illnesses, waterborne diseases, vector-borne diseases, and injuries,
specifically carbon monoxide (CO) poisoning. Conceptual pathways were created to describe how each
climate impact directly and indirectly affects those priority health outcomes based on Michigan’s
vulnerabilities that were identified and classified as either relating to exposures or sensitivities.
Combining the vulnerabilities, priority health outcomes, and climate projections, a qualitative synthesis
of the relationship between expected future climate conditions and the likely health burden on
Michigan’s communities was created. A summary of findings is shown here:

1. Respiratory Diseases: Overall, projected conditions favor increased air pollution and worsening respiratory
   disease. Climate projections also favor earlier and longer growth period for plants indicating increased pollen
   levels, which could increase allergies and exacerbate symptoms including asthma.
2. Heat Illness: Air mass stagnation events may increase in frequency if high humidity occurs with high
   temperature and low winds, leading to increased heat stress-related morbidity and mortality. Projected
   increasing numbers of high heat days by mid-century suggest there will likely be large direct impacts on
   human health, especially if occurring simultaneously with other variables such as urban heat island effect.
3. Water-borne Diseases: In general, climate conditions leading to flooding will be the same or more intense in
   the future. This leaves areas vulnerable to sewage/septic failures and runoff at an increased risk for
   waterborne diseases and in certain areas, development of harmful algal blooms.
4. Vector-borne Diseases: Projections point to warmer winters, earlier springs, and warmer summers,
   conditions suitable for West Nile Virus and its mosquito vector. Similarly, current and future conditions are
   suitable for Lyme disease and its tick vector although there is greater difficulty in projecting the burden based
   on the complex sequence of climate conditions and the tick’s life cycle needs.
5. Injury and CO Poisoning: Extreme weather events conducive to power outages are projected to increase,
   especially in winter, leading to increased use of generators and thus increased risk of CO poisoning. Clean up
   after an event utilizing power washers may also increase risk of CO poisoning. Freezing rain and flooding
   increases will raise traumatic injury risk.

                                                                                                                  9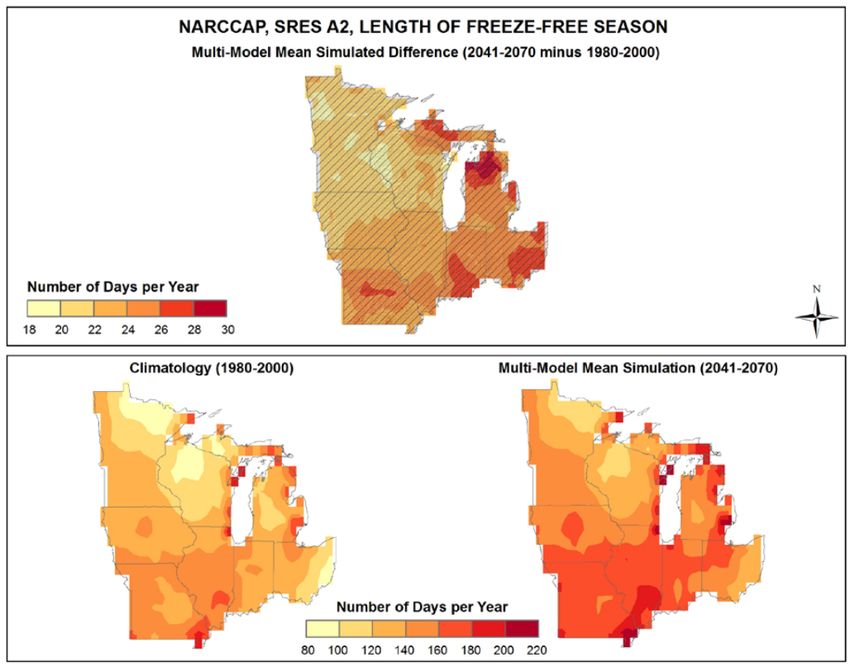
I.     Building a Resilient Public Health System

“The systemic reaction resulting from changing climate conditions has impacted environmental and
human processes; representing an emerging threat to public health in Michigan. This threat requires
altered response strategies from public health officials to confront the new pathways for disease and
illness as well as the added stress placed on many existing public health problems.” (pg. 10)

                                                                                                  10
Introduction
The United Nations Intergovernmental Panel on Climate Change (IPPC) in their Fifth Assessment Report
concludes that, “warming of the climate system is unequivocal and many of the observed changes are
unprecedented over decades to millennia” (IPCC, 2014). The U.S. Global Change Research Program’s
Third National Climate Assessment, conducted by more than 300 experts guided by a 60-member
Federal Advisory Committee from 13 Federal Departments, formed similar conclusions finding that
“Temperatures at Earth’s surface, in the troposphere (the active weather layer extending up to about 5
to 10 miles above the ground) and in the oceans, have all increased over recent decades. This warming
has triggered many other changes to the Earth’s climate” (Walsh, et al., 2014). What is of greatest
concern for decision makers at all levels and across all sectors is that “Worldwide, the observed
changes in average conditions have been accompanied by increasing trends in extremes of heat and
heavy precipitation events, and decreases in extreme cold” (Walsh, et al., 2014). This has led to
“shorter duration of ice on lakes and rivers, reduced glacier extent, earlier melting of snowpack,
reduced lake levels due to increased evaporation, lengthening of the growing season, changes in plant
hardiness zones, increased humidity, rising ocean temperatures, rising sea level, and changes in some
types of extreme weather” (Walsh, et al., 2014).
The systemic reaction of global changes in precipitation and temperature leading to environmental and
human system impacts represents an emerging threat to public health. This threat requires altered
response strategies from public health officials to confront the new pathways for disease and illness as
well as the added stress placed on many existing public health problems (Luber et al., 2014).
Furthermore, officials will have to consider more than ever how their communities and citizens are
vulnerable and if the health care infrastructure and delivery systems are capable of meeting those new
challenges. This will require cooperation and action between multiple sectors as climate change poses
indirect threats to health through impacts on fish and wildlife populations, energy and industry
demands, natural features, transportation systems, tourism and recreation, water quality and quantity,
and agriculture (Luber et al., 2014).
Acknowledging the need for a strategic and action oriented response, in 2010 the Michigan
Department of Health and Human Services’ Division of Environmental Health (MDHHS-DEH)
established the Michigan Climate & Health Adaptation Program (MICHAP) following a one-year
strategic planning activity funded by a grant from the Association of State and Territorial Health
Officials (ASTHO). MICHAP was charged with protecting the health of Michigan’s citizens from threats
related to climate change, with the support and guidance of the Centers for Disease Control &
Prevention’s (CDC) - Climate Ready States & Cities Initiative (CRSCI).
(www.cdc.gov/climateandhealth/climate_ready.htm)
After successfully creating and implementing Michigan’s climate and health strategic plan (MDHHS,
2011) from 2010 to 2013, the MDHHS - DEH was awarded a second grant from the CDC called Building
Resilience Against Climate Effects (BRACE) in State Health Departments. The CDC’s BRACE framework
builds upon the planning and preliminary implementation work completed from the two previous
grants. Their framework is composed of five steps which are described in Table 1.1.
Rationale and Objectives
This Climate and Health Profile Report (CHPR) establishes the foundation upon which the five steps of
the BRACE framework will be completed and implemented at the State and local levels in Michigan.
11The alignment of the BRACE framework with MICHAP’s activities and ultimate outcomes is further
explained in Table 1.1.
As the initial step in the BRACE framework the CHPR is intended to: (1) Inform internal and external
stakeholders of the most current climate science as it relates to existing and future temperature and
precipitation changes in Michigan leading to environmental and health impacts; (2) Describe the direct
and indirect pathways by which climate changes impact health outcomes; (3) Characterize the
variables that will be used to assess the vulnerabilities of the people and places within the State; (4)
Explore the relationships between current vulnerabilities, future climate change projections, and the
potential pathways of impact to better understand the additional burden to new and existing health
outcomes; (5) Identify MICHAP’s key collaborators and stakeholders, how they can be engaged and
how these partnerships will lead to successful implementation of BRACE at the State and local levels.
Table 1.1: Michigan Climate & Health Adaptation Program BRACE Goals and Objectives
Goal: Enhance local, regional, and state capacity to predict, assess, and effectively respond to extreme weather and climate
events to reduce and prevent the negative public health impacts associated with climate change.
BRACE Steps MICHAP Objectives (3 year) Purpose & Application
- Describe state climatology, related
exposures, health factors and health
outcomes of concern, and the
populations and systems most vulnerable
- Create MI Climate and Health
to these changes
Profile Report (CHPR)
1. Data analysis and climate - Identify and describe communities and
projections geographic areas at greatest risk for
- Develop comprehensive
climate-related health outcomes
Vulnerability Assessment
- Act as resource for local public health
decision makers and communities in
developing plans and for adaptation and
emergency response
- Describe the magnitude, trend and
2. Project health impacts and
- Create Burden of Disease Report estimation of additional burden of health
disease burden
outcomes due to climate change.
- Identify and prioritize the most
3. Identification of best - Develop Climate & Health appropriate interventions to address
intervention strategies Intervention Assessment vulnerabilities and health impacts for
each region in Michigan
- Assist local health departments - Advance the application of climate
(LHDs) to plan for relevant health science to public health practice
impacts and vulnerable - Develop and put in place a process for
populations ensuring that climate change factors are
considered adequately in public health
4. Adaptation planning and
- Work with regional research program operations.
implementation
partners to strengthen - Promote consideration of public health in
existing/develop new climate climate adaptation planning in other
related tools sectors
- Develop and deliver BRACE - Support local climate health adaptation
framework training planning
- Incorporate BRACE approach.
5. Evaluate and revise - Update existing Climate & Health - Prepare principal climate and health
adaptation plan Adaptation Plan preparedness guideline for local health
departments
12History of MDHHS Engagement with Climate and Health
The Michigan Department of Health and Human Services received funding from ASTHO in 2009 to
conduct a statewide needs assessment and develop an adaptation plan for Michigan. The planning
process focused on two specific deliverables; a Needs Assessment and Strategic Plan. In 2010, MDHHS
received a three-year grant from CDC that funded MICHAP to implement the Strategic Plan as part of
the national CRSCI. The MICHAP made great progress to build capacity in the state to address climate
and health issues through both the planning and implementation grants. Table 1.2 reflects the
objectives and results of those projects. Grant Final Reports and products are available from MICHAP
staff upon request or by visiting www.michigan.gov/climateandhealth.gov.
Table 1.2: Previous Michigan Climate and Health Program Grants: Objectives & Key Findings
Grant Objective Findings and Results:
Understand existing community Key stakeholder feedback
stakeholder interest in, capacity - Widespread interest but lack of knowledge regarding health
to, and knowledge of climate & impacts of climate change
health impacts and implementing - Strong desire to identify partners with other organizations to
adaptation strategies. address the issue
Advisory Committee agreed upon goals
- Climate change is recognized as a public health issue &
integrated into public health practice
Identify long-term goals,
Strategic - Public health agencies have the tools, resources, and
objectives, strategies to form the
activities to respond to climate change impacts within
Planning impetus for future initiatives
existing programs
- Vulnerable populations are explicitly considered in programs
and policies addressing climate change impacts
Advisory Committee & Staff agreed upon priority issues
- Increasing number of heat events with related illnesses and
deaths
Identify the priority climate-driven
- Declining air quality as a result of increased production of
health impacts
ozone and particulate matter from heat and drought events
- Adverse changes to water quality and quantity following
severe weather events
Advisory Committee & Staff agreed upon activities
Integrate identified issues, - Incorporated extreme weather considerations into
resources, and strategies into emergency planning
state and local public health - Supported climate-related Health Impact Assessments (HIA)
Implementation
planning, assessments, in 3 communities and heat health surveys in two
outreach/education, partnerships, - Initiated health effects surveillance and calculated Indicators
and tool development - Trained partners on climate health effects, HIA tool, and
emergency response
Geographic Scope
MICHAP is a statewide initiative with a mandate to identify the unique health impacts from climate
change for various communities and regions within Michigan and to integrate adaptation strategies
and actions into their local health departments, municipalities, or other planning organizations
depending upon the scale of the potential health impact and recommended interventions. This CHPR is
intended to act as a resource to direct and inform this initiative, and is anchored in the breadth of
political, social and physical characteristics of the state as summarized below.
13Jurisdictional Features
Michigan is located in the eastern north-central United States. The state is composed of two
peninsulas, the Upper and Lower. The Upper Peninsula is bordered by Lake Superior to the north, by
Wisconsin on the west and on the south by Lake Michigan and Lake Huron. The Lower Peninsula is
bordered on the west by Lake Michigan and on the east by Lake Huron and Lake Erie. On the south it is
bordered by Indiana and Ohio. Michigan is divided into 83 counties, 257 villages, 276 cities and 1,240
townships. Additionally, the state is covered by 45 Local Public Health Departments with some
encompassing several counties (Michigan Legislative Service Bureau, 2013). Figure 1.1 depicts the
relevant jurisdictional boundaries of interest to MICHAP.
Fig. 1.1
Social Features
The 2010 U.S. Census identifies Michigan as the eighth Table 1.3: Michigan’s Largest Cities
most populous state in the U.S., with a total population City Population Area (sq.
of 9,883,640. County populations range from a low of mi)
2,156 in Keweenaw County (North Western Upper Detroit 688,701 142
Peninsula) to slightly less than two million persons in Grand Rapids 192,294 45
Wayne County (South Eastern Lower Peninsula). Warren 134,873 34
Michigan’s largest city by population and area is Detroit Sterling Heights 131,224 36
(South Eastern Lower Peninsula) followed by Grand Ann Arbor 117,025 28
Rapids (Western Lower Peninsula), as shown in Table Lansing 113,972 36
Flint 99,763 34
1.3.
Source: U.S. Census Bureau, 2014 (estimated 2013)
14Forty four percent of Michigan’s total population is located in the Detroit Eligible Metropolitan Area
(DEMA), which encompasses Wayne, Macomb, Oakland, Monroe, St. Clair, and Lapeer Counties (U.S.
Census, 2013). Population density of Michigan by census tract is visualized in Figure 1.2.
Fig. 1.2 (U.S Census Bureau, American Community Survey, 2010)
15The racial and ethnic compositions and median ages of
the State of Michigan and its two largest metropolitan
areas, Grand Rapids and Detroit, are presented in Table
1.4. The percentage of non-white populations and the
median ages within census tracts of Michigan are
visualized in Figures 1.3 & 1.4.
Percentage of non-White
Population Density in Michigan
Percentage of non-white population
Fig. 1.3 (U.S Census Bureau, American Community Survey, 2010)
16Fig. 1.4 (U.S Census Bureau, American Community Survey, 2010)
17Table 1.5: Michigan Industries’ contributions to Gross
Economic Features Domestic Product, employment, and services
Michigan’s economy is predominantly Economic
Category Number Primary
driven by the manufacturing, agriculture, Output
of Jobs Contributions
tourism, and mining industries. Changes (billions)
in temperature and precipitation from Automobiles,
climate change can have significant chemicals, paper,
Manufacturing $58.2 > 470,000
furniture, breakfast
impacts on these systems, including oc-
foods
cupational health hazards and economic Farming, wholesale
stressors. Four primary economic Food &
$91.4 923,000 and retail
features are highlighted in Table 1.5. Agriculture
distribution
Rural/urban
Natural Features recreation,
Glaciers covered Michigan as recently as Tourism $20.9 > 150,000 freshwater
14,000 years ago, leaving behind hills and recreation, hiking,
valleys, snake-shaped eskers, patterned winter activities
mounds of drumlin fields, steep end Peat, bromine,
moraines, and old weathered mountain calcium-magnesium
Mining $2.4 N/A chloride, gypsum &
ranges. As the modern day Great Lakes
magnesium
receded about 4,000 years ago, broad
compounds
flat lakebeds were exposed, sandy Source: MI Economic Development Corporation, 2014
beaches were formed, and large sand
dunes were created (Michigan Department of Natural Resources, 2014).
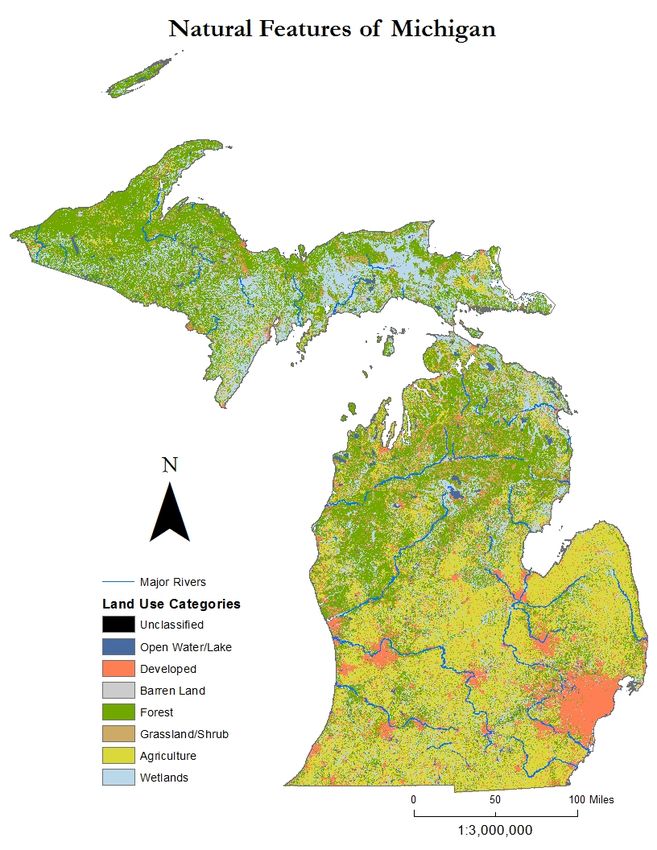
Michigan has over 19.3 million acres of forests covering more than half the land area of the state,
mainly in the Upper Peninsula and northern Lower Peninsula. Michigan has the fifth largest amount of
timberland (forestland that can produce commercial timber) in the United States. Hardwoods such as
maple, aspen, and oak make up 75% of the trees in the state, while softwoods, including pine, spruce,
and cedar comprise the remaining 25%. Distribution of forests, along with wetlands, developed land,
bodies of water, etc. is displayed in Figure 1.5 (Michigan Department of Natural Resources, 2014).
Perhaps the State’s greatest natural feature is the abundance of fresh water. The five Great Lakes and
their connecting waterways that define the
region hold 6 quadrillion gallons of water Table 1.6: Michigan Natural Feature Statistics
representing 90% of the United States’ Total Land Area 58,110 sq. mi.
surface freshwater supply. The Great Lakes Total Great Lakes Water Area 38,575 sq. mi.
basin (the surface area of the Great Lakes Total Inland Water Area 1,305 sq. mi.
and the land draining into the Lakes) covers Highest Point Mount Arvon – 1,979 feet
Lowest Point Lake Erie Surface – 571 feet
more than 295,000 square miles and is home
Rivers and Streams 36,600 miles
to over 33 million people in the United Freshwater Coastline > 3,200 miles
States and Canada Figure 1.6 (Great Lakes Number of Inland Lakes > 11,000
Information Network, 2014). Additional vital Source: Michigan Department of Natural Resources, 2014
natural features are described in Table 1.6.
18Fig. 1.5
19Topography of Michigan
Elevation above sea level (feet)
High: 1, 979
Low: 571
Fig. 1.6
20Introduction to Michigan’s Climate
Michigan’s climate is influenced largely by the Great Lakes. The Lakes moderate the temperatures of
the surrounding land, cooling the summers and warming the winters. Michigan has a humid
continental climate, although there are two distinct regions. The southern and central parts of the
Lower Peninsula have a warmer climate with hot summers and cold winters. The northern part of
Lower Peninsula and the entire Upper Peninsula have a more severe climate, with warm, but shorter
summers and longer, cold to very cold winters. For an in-depth description of Michigan’s current and
future climate statistics and trends see Chapter II: Michigan’s Current and Future Climate Conditions.
21References
Great Lakes Information Network, 2014. Great Lakes Facts & Figures. Retrieved at http://great-
lakes.net/lakes/ref/michfact.html
Great Lakes Integrated Sciences and Assessments Program. Climate Change in the Great Lakes Region:
Executive Summary Fact Sheet.
http://www.glisa.msu.edu/docs/fact_sheets/GLISA_climate_change_summary.pdf. Accessed
January 9, 2014.
IPCC, 2014: Summary for Policymakers. In: Climate Change 2014: Impacts, Adaptation, and
Vulnerability. Part A: Global and Sectoral Aspects. Contribution of Working Group II to the Fifth
Assessment Report of the Intergovernmental Panel on Climate Change [Field, C.B., V.R. Barros,
D.J. Dokken, K.J. Mach, M.D. Mastrandrea, T.E. Bilir, M. Chatterjee, K.L. Ebi, Y.O. Estrada, R.C.
Genova, B. Girma, E.S. Kissel, A.N. Levy, S. MacCracken, P.R. Mastrandrea, and L.L. White
(eds.)]. Cambridge University Press, Cambridge, United Kingdom and New York, NY, USA, pp. 1-
32.
Luber, G., K. Knowlton, J. Balbus, H. Frumkin, M. Hayden, J. Hess, M. McGeehin, N. Sheats, L. Backer, C.
B. Beard, K. L. Ebi, E. Maibach, R. S. Ostfeld, C. Wiedinmyer, E. Zielinski-Gutiérrez, and L. Ziska,
2014: Ch. 9: Human Health. Climate Change Impacts in the United States: The Third National
Climate Assessment, J. M. Melillo, Terese (T.C.) Richmond, and G. W. Yohe, Eds., U.S. Global
Change Research Program, 220-256. doi:10.7930/J0PN93H5.
MDHHS Division of Environmental Health, 2011. Michigan Climate and Health Adaptation Plan
(MICHAP) 2010 – 2015 Strategic Plan
http://www.michigan.gov/documents/MDHHS/MDHHS_climate_change_strategicPlan_final_1-
24-2011__343856_7.pdf
Michigan Department of Natural Resources, 2014: Michigan’s Natural Communities: Retrieved at
http://www.michigan.gov/dnr/0,4570,7-153-10370_22664---,00.html
Michigan Legislative Service Bureau, 2013: Michigan Manual 2013-2014. Retrieved at:
http://www.legislature.mi.gov/%28S%283aqg5m45ynhkat451lnb1l55%29%29/documents/201
3-2014/michiganmanual/2013-MM-P0000-p0000.pdf.
United States Census Bureau, 2013: "Table 1. Annual Estimates of the Population for the United States,
Regions, States, and Puerto Rico: April 1, 2010 to July 1, 2013: 2013 Population Estimates.
Retrieved at: www.census.gov/popest/data/state/totals/2013/tables/NST-EST2013-01.csv
U.S. Census Bureau, 2010. American Community Survey. Retrieved: http://www.census.gov/acs/www/
Walsh, J., D. Wuebbles, K. Hayhoe, J. Kossin, K. Kunkel, G. Stephens, P. Thorne, R. Vose, M. Wehner, J.
Willis, D. Anderson, V. Kharin, T. Knutson, F. Landerer, T. Lenton, J. Kennedy, and R. Somerville,
2014: Appendix 4: Frequently Asked Questions. Climate Change Impacts in the United States:
The Third National Climate Assessment, J. M. Melillo, Terese (T.C.) Richmond, and G. W. Yohe,
Eds., U.S. Global Change Research Program, 790-820. doi:10.7930/J0G15XS3.
22II. Michigan’s Current and Future Climate Conditions
Michigan’s climate may be
similar to the current climate
of these locations by the end
of the 21st century.
Source: Hayhoe, VanDorn, Croley II, Schlegal, & Wuebbles. (2010), modified
“The projections should be considered only one piece of information about future climate that fits into a
larger context of: 1) how climate has already changed based on observations and 2) what we know
from expert knowledge and local/regional future climate research” (pg. 33).
23Baseline Climate Description
Average weather conditions across the State of Michigan vary greatly as a result of the state’s north-to-
south latitude coverage and its unique positioning among several Great Lakes (see Figure 2.1). For
example, the average annual temperature of Ironwood, Michigan in the Western Upper Peninsula
(U.P.) is 40.1° F, while the annual average temperature of Adrian, Michigan in the Southeastern Lower
Peninsula (L.P.) is 48.6° F. These vast differences point to the need for localized information, especially
for planning purposes across the State of Michigan. In this chapter we summarize current climate
conditions, the physical drivers of our State’s weather and climate, and projected future climate
changes for the State of Michigan using local
observed weather data and climate model
projections, respectively.
Observed Weather Data
Michigan’s historic climate data in this report
comes primarily from a series of twenty-two
weather observation stations located
throughout the state. These stations have
reliable temperature and precipitation
measurements that have been systematically
collected since 1950 and can be used to
document historic changes annually and by
season. These point-based station data have
been collected along with observational
climate division data from the National Oceanic
and Atmospheric Administration (NOAA) to
produce historic averages for representative
locations and all Michigan Climate Divisions.
See Figure 2.2; map of climate stations and
divisions. Findings are summarized below.
Current Climate Conditions
In general, the northwestern Upper Peninsula
(U.P.) experiences harsh, long winters and mild
summers, and the Lower Peninsula (L.P.) Fig. 2.1: Michigan reference map indicating the latitudinal coverage
experiences milder winters with hot, humid of the state and the geographic distance between the Southeast and
Northwest areas of the State.
summers. Winter temperatures often fall
below 0°F, and the summers in the L.P., particularly the southern portion, commonly experience
several humid days with temperatures upwards of 90°F. The greatest seasonal temperature difference
from the summer occurs between December and February, with the coldest temperatures observed in
northern inland areas away from the Great Lakes. Average annual precipitation (all precipitation types
converted to their equivalent amount of liquid water) is somewhat consistent across the state, ranging
from 30 inches per year in the northwestern L.P. to 38 inches per year in the southwestern L.P. The
greatest contributions of precipitation generally occur during the summer, but frozen winter
precipitation can have just as great or greater impact on society.
24Snowfall in Michigan is usually associated with either
large weather patterns or with lake effects, often leading
to highly variable snowfall totals over short distances.
Snowfall in the Keweenaw Peninsula commonly exceeds
240 inches per year, making it the snowiest region in the
United States east of the Rocky Mountains. Municipal
records from Delaware, Michigan, for example, report the
seasonal snowfall total reached 390 inches during the
winter of 1978-1979. This is a stark contrast to southern
sections of Michigan where snowfall is often sparse,
averaging a little over 30 inches per year.
Climate Changes Already Experienced
Through the 20th and into the 21st century, Michigan’s
climate has changed in measurable and impactful ways. Fig. 2.2: NOAA Climate Divisions and high-quality
climate observation stations. Red dots represent station
Warmer Temperatures locations that have consistent records since 1951.
Average temperatures have increased in Michigan,
roughly consistent with global trends over the past century. There is tremendous short-term variability
in regional temperatures, however, and there have been multiple points in time when the multi-year
regional trend did not reflect the global pattern. Annual mean temperature over the Midwest
increased by approximately 0.11° F per decade during the 1900-2010 period, increased 0.22° F per
decade for the period 1950-2010, and 0.47° F per decade for the period 1979-2010 (Brohan et al.,
2006). For comparison, global temperatures have increased by about 1.4° F since 1850 (IPCC, 2007).
Most locations throughout the state have warmed during the past century. Most stations in Michigan
with reliable, long-term records show increases in average annual temperature from the 1951-1980
period to the 1981-2010 period. Overall, average low temperatures have increased slightly faster than
high temperatures, but there is great variability across stations by season (see Table 2.1). All Climate
Divisions in Michigan experienced warmer average annual temperatures during the 1981-2010
period than during the 1951-1980 period. Increases ranged from 0.6° F in southeastern parts of the
state up to 1.3° F in the Northwestern Lower peninsula.
Table 2.1: Changes in average annual and seasonal temperatures (in degrees F) from the 1951-1980 period to
the 1981-2010 period for Michigan’s ten NOAA Climatic Divisions
Michigan Climate Division Annual Winter Spring Summer Fall
(Dec/Jan/Feb) (Mar/Apr/May) (Jun/Jul/Aug) (Sep/Oct/Nov)
Western Upper Peninsula (1) 1.0 2.0 1.1 0.6 0.2
Eastern Upper Peninsula (2) 1.1 1.8 1.3 0.9 0.4
Northwest Lower (3) 1.3 2.4 1.6 0.9 0.4
Northeast Lower (4) 1.2 2.1 1.4 0.9 0.3
West Central Lower (5) 1.0 2.3 1.2 0.4 0.1
Central Lower (6) 0.9 1.9 1.0 0.4 0.1
East Central Lower (7) 0.6 2.0 0.7 -0.2 -0.2
Southwestern Lower (8) 0.9 1.9 1.1 0.6 0.2
South Central Lower (9) 0.7 1.8 0.9 0.1 -0.1
Southeastern Lower (10) 0.6 1.4 0.9 0.3 -0.1
State Average
1.2 2.3 1.3 0.8 0.6
(Area Weighted)
25Across Michigan, average temperatures have increased faster during winter than other seasons. In
some areas, mean summer and fall temperatures have actually decreased with time, possibly due to
increased use of land for agriculture, which can have an overall cooling effect (Pan et al., 2004). Over
the United States and the Midwest, much of the warming in recent decades has also been due to
warmer nighttime (minimum) temperatures (Lorenz et al., 2009a; Easterling et al., 1997), (see Table
2.2) resulting in a narrower daily temperature range.
Table 2.2: Changes in average annual temperatures, average mid-day high
temperatures, and average overnight low temperatures (in degrees F) from
1951-1980 to 1981-2010 for 22 weather observation stations in Michigan
Weather Station Annual Mid-Day High Overnight Low
Adrian 0.0 0.2 -0.1
Alma -0.5 -0.1 -0.9
Alpena 1.1 0.6 1.5
Ann Arbor 0.4 0.4 0.3
Cheboygan -0.4 -0.5 -0.2
Eau Claire 1.3 1.1 1.4
Flint 1.0 1.2 0.8
Gaylord 0.5 -0.2 1.2
Greenville 0.0 0.4 -0.4
Iron Mountain 0.5 0.7 0.3
Ironwood -0.3 -0.9 0.4
Jackson 0.6 0.6 0.6
Lake City 0.2 -0.2 0.6
Marquette 0.8 1.2 0.3
Muskegon 0.8 0.8 0.9
Pellston 1.6 1.3 1.8
Port Huron 0.0 -0.1 0.1
Saginaw 0.6 0.7 0.5
Sault Ste. Marie 1.4 1.4 1.4
Three Rivers 0.2 0.4 0.0
Traverse City 1.3 1.0 1.7
West Branch 0.3 1.1 -0.4
All station average 0.52 0.50 0.54
Changing Precipitation
Annual precipitation across the Midwest has increased overall during the past century (Groisman &
Easterling, 1994; Andresen et al., 2013). The winter and fall months have seen the greatest relative
changes in precipitation, while precipitation during the spring and summer has remained relatively
stable or decreased slightly. Overall, total annual precipitation in Michigan increased by 4.5% (or 1.4
inches) from the 1951-1980 average to the 1981-2010 average, but there has been large regional
variation (see Table 2.3).
26Table 2.3: Percent change in mean total annual and seasonal precipitation from the 1951-1980 period to the
1981-2010 period for Michigan’s ten NOAA Climate Divisions
Michigan Climate Division Annual Winter Spring Summer Fall
(Dec/Jan/Feb) (Mar/Apr/May) (Jun/Jul/Aug) (Sep/Oct/Nov)
Western Upper Peninsula (1) -2.9 0.1 -7.8 -9.7 8.1
Eastern Upper Peninsula (2) -2.8 -3.5 -9.6 -6.2 7.4
Northwest Lower (3) 5.6 6.6 3.9 2.4 10.1
Northeast Lower (4) 2.4 1.9 -1.3 1.4 7.9
West Central Lower (5) 6.8 -1.6 6.0 4.3 15.8
Central Lower (6) 8.6 10.0 8.8 2.3 15.4
East Central Lower (7) 11.5 5.3 8.4 7.9 23.8
Southwestern Lower (8) 7.0 3.8 3.0 4.1 16.9
South Central Lower (9) 10.1 8.4 5.4 4.9 24.8
Southeastern Lower (10) 9.5 7.3 2.0 4.5 27.7
State Average
4.5 3.5 0.5 0.1 14.6
(Area Weighted)
Annual precipitation totals have declined or remained Table 2.4: Percent change in total annual
largely unchanged across the U.P. and the precipitation from 1951-1980 to 1981-2010 for
northernmost sections of the L.P. of Michigan, while 22 Michigan weather observation stations
southern areas of the state report increases of Weather Station Change (%)
approximately 8-13%. The U.P. is also the only area to Adrian 9.3
see declining precipitation in the spring and summer Alma 11.2
months. Similarly, when looking at station data, most Alpena -4.3
locations across Michigan show increased annual Ann Arbor 25.0
precipitation. These changes are usually distributed Cheboygan 12.7
unevenly throughout the year, with historically wet Eau Claire 7.3
months seeing increases in precipitation and Flint 8.4
historically dry months seeing lesser increases or Gaylord 5.6
decreases (see Table 2.4). Ann Arbor is an extreme Greenville 4.8
case, with 25% more precipitation per year during the Iron Mountain 2.1
1981-2010 period than during the 1951-1980 period; Ironwood 1.6
while the northern city of Pellston showed the largest Jackson 8.0
decline of 7.6%. Lake City 13.1
Marquette -6.0
Lake Warming and Reduced Ice Cover Muskegon 5.2
Great Lakes surface water temperatures, evaporation Pellston -7.6
from the lakes, and the seasonality of lake freezing and Port Huron 12.6
thawing are key drivers of weather for many Michigan Saginaw 3.2
communities. Significant changes to any of these
Sault Ste. Marie -0.6
physical characteristics could have profound
Three Rivers 13.4
implications for Michigan’s climate. The Great Lakes
Traverse City 8.3
have warmed faster than nearby air temperature in
West Branch 10.7
recent years. Lake Superior summer (July–September)
surface water temperatures increased approximately All station average 6.5
274.5° F from 1979-2006, a significantly faster rate than regional atmospheric warming of 0.6 to 0.90 F.
Declining winter ice cover is the largest driving factor of this amplified lake warming. The Lakes are
freezing later in the year and thawing earlier, allowing a longer period to warm during the summer and
amplifying the effects of warmer air temperatures (Colman & Austin, 2007). Aside from altering nearby
air temperatures over land, warmer water temperatures can increase the risk of water contamination
and increase the likelihood of algal blooms.
Table 2.5: Change in average number and percent of
days per year with precipitation >1 inch from 1951- Extreme Precipitation
1980 to the 1981-2010 period for 22 Michigan Across the Upper Midwest, extreme precipitation
weather observation stations events have become more intense and more
Weather Station Number of Days % Change frequent over the past century. Several studies
Adrian 0.9 14.1examining different thresholds of precipitation
Alma 0.8 16.2and varying durations of precipitation events
Alpena -0.6 -15.1have arrived at similar conclusions. Twenty-two
Ann Arbor 1.3 29.4percent of the stations considered in a study by
Cheboygan 0.0 0.4Pryor et al., 2009, identified significant increases
Eau Claire 0.6 10.5in the total accumulated precipitation during the
Flint Bishop 0.6 13.2top-10 wettest days of the year. The occurrence
Gaylord -0.1 -3.3of intense precipitation events has also risen
Greenville 0.5 9.7substantially in recent decades. In the Midwest,
Iron Mountain -0.1 -1.8the number of 24 hour, 20% annual chance
Ironwood 0.8 15.7storms (storms that have a 20% chance of
Jackson 1.4 33.6occurring in a given year, also known as 5-year
Lake City 1.0 24.7storms) has increased by about 4% per decade
Marquette -0.1 -2.1
since the beginning of the 20th century (Kunkel,
Muskegon 0.7 16.2
2003, updated), and the amount of precipitation
falling in the 1% heaviest precipitation events has
Pellston -0.4 -8.1
increased by 37%, (Walsh et al., 2014). Michigan
Port Huron 0.4 7.2
has experienced a similar change between the
Saginaw 1.4 32.8
time periods of 1951-1980 and 1981-2010, with
Sault Ste. Marie 0.2 5.1
most observational stations recording increased
Three Rivers 1.7 26.9
number of days with precipitation exceeding 1
Traverse City 1.3 36.1
inch (see Table 2.5). The average change over
West Branch 1.1 27.4
the twenty-two stations was 13.1% or an
All Station 0.6 13.1 increase of 0.6 days per year; the greatest
Average increases were reported from Traverse City
(36.1%), Jackson (33.6%) Saginaw (32.8%), and Ann Arbor (29.4%). The trend towards heavier rainfall
has amplified the risk of flooding across the region (Walsh et al., 2014), but in many urban areas the
increased flood risk has been attributed more strongly to changes in land use than changes in climate
(Scharffenberg & Fleming, 2006; Changnon et al., 1996).
Extreme Temperatures
The first few decades of the 20th century and the years from 1965-1995 were periods of relatively
frequent intense cold waves, while they were infrequent from the 1920s through 1960 and from 1996
to present. Though there have been notable exceptions, extreme heat waves have also occurred less
frequently in recent years in comparison to other historical periods (Andresen et al., 2013).
28The number of days per year exceeding 90° F and 95° F has not changed significantly for most
locations in Michigan. Although some locations have reported declines in the number of days
exceeding 90°F, the overall average change was less than 0.1 days per year (see Table 2.6).
Alternatively, heat waves defined by both Table 2.6: Change in average number of days with
temperature and humidity driven by weather extreme heat (>90oF) and extreme cold (< 32o F)
systems such as air masses have shown a different temperatures from 1951-1980 to 1981-2010 for 22
pattern of change. The frequency of heat waves Michigan weather observation stations
defined by the presence of tropical air masses has Weather Station Days > 90°F Days < 32°F
significantly increased in Southeastern Michigan; Adrian -2.5 -6.0
while the number of dry, cool days during summer Alma 0.1 9.5
has significantly declined (UCS, 2012). From 1959 Alpena 0.2 -8.5
through 2011, Detroit saw slight but statistically Ann Arbor 0.5 -2.8
significant increases in hot, humid days and hot, dry Cheboygan -0.2 -1.2
days. The effect of rising temperatures was more Eau Claire 1.5 -11.3
clearly seen in a decline of 10.5 cool, dry days per Flint Bishop 1.6 -3.6
year during summer months (UCS, 2012). Gaylord -0.6 -3.8
Drought Greenville -0.7 4.7
As precipitation has increased across the region Iron Mountain 2.4 -2.6
during the past several decades, the incidence and Ironwood -0.4 0.9
geographic extent of drought has decreased with Jackson -3.9 -8.2
time (Mishra et al., 2010). For the agricultural Lake City -0.2 -1.1
industry, the trend towards a wetter climate and Marquette -0.7 -3.4
decreasing drought frequency has generally been a Muskegon -0.9 -6.7
positive impact, with relative increases in crop Pellston 0.7 -7.2
yields due to less moisture stress and more Port Huron -0.5 -0.7
favorable growing conditions overall (Andresen et Saginaw -0.4 -3.6
al., 2001). Sault Ste. Marie 0.2 -9.2
Three Rivers -0.9 -1.1
Michigan’s Weather and Climate Drivers Traverse City -0.7 -10.7
Weather for the State of Michigan is driven West Branch 0.2 3.8
primarily by the characterization of air masses
entering the region, large-scale atmospheric All station average -0.2 -3.3
oscillations, and local influences from the Great
Lakes. Each of these factors acts on different
time scales and durations. Short-term weather
patterns lasting less than a few weeks are
generally driven by the polar jet stream in the
winter, spring, and fall. Tropical air masses tend
to influence weather in the southern parts of
the state to a greater degree during the summer
months (Andresen & Winkler, 2009).
Three primary air mass types from three source
regions dominate the climatic patterns of
Fig. 2.3: Air masses over the United States. Source:
Michigan (Figure 2.3). Maritime tropical air
www.srh.noaa.gov/jetstream/synoptic/airmass.htm
29You can also read