CLIMATE CHANGEin Johannesburg - EcoMetrix Africa
←
→
Page content transcription
If your browser does not render page correctly, please read the page content below
CLIMATE CHANGE                                                                    in Johannesburg
Special Edition Publication for the C40 Summit, Johannesburg, 4-6 February 2014

  C40 Summit 2014
  hosted in Johannesburg

  Mayor Parks Tau elevates
  climate change to city’s long
  term strategy - GDS 2040

  City of Joburg showcases
  climate change best
  practices

  Special Edition
  This magazine is printed on 100% recyclable paper
Contents                                                                    Acknowledgements
Welcome - City of Joburg                                               1    This publication was produced by the City of Johannesburg
                                                                            as a special edition for the C40 Cities Mayors Summit:
Foreword – C40 Chair                                                   3
                                                                            Johannesburg 2014.
1. Introduction to C40                                                 4
2. Climate change in context                                                Project team responsible for the publication:
      Climate change in south africa                                    6   City of Johannesburg:
      Climate change in the city                                        8   Tiaan Ehlers, Lunelle Serobatse, Linda Phalatse, Mzukizi
      How the city is affected                                          9   Gwata, Jane Eagle, Devesh Mothilall, Nino Manus,
3. The City of Johannesburg – Policy Approach on Climate Action             Simphiwe Mbuli, Khosi Baker, Lisa Seftel and Kamini Pillay
      General approach towards climate change                          12
      Climate change mitigation action in the city                     13   South African Cities Network:
      Building resilience to climate change in the city                14   Sandiswa Tshaka, Gillian Maree, Khumo Sello and Bomikazi
      The city’s governance and institutional model                    15
                                                                            Nkolongwane
4.   Climate change resilience in the City                                  EcoMetrix (content management on behalf of the SACN):
      The city’s climate change themes                                 18   Lodewijk Nell and Henk Sa
      Sustainable communities                                          18
      Green transportation                                             22   Reviewed by: Linda Phalatse, Nontokozo Hadebe, Sandiswa
      Urban water management                                           24
                                                                            Tshaka, Sithole Mbanga
      Integrated waste management                                      27
5.   Climate change projects – good practices                               Graphic design, layout & production:
      Cosmo City – climate proofing of urban communities               32   RW Communications
      Upper Grayston - block E and F offices                           34
      Standard Bank - Rosebank building                                36
      Megawatt Park - Car park and rooftop PV                          38   Photo Credits: Johannesburg Road Agency, City of
      The GreenHouse Project - Sustainable living in johannesburg      40   Johannesburg and project photos supplied by project
      Rea Vaya - Bus rapid transit system                              42   proponents
      The Dobsonville bus rapid transit depot                          44
      Gautrain – Connecting the city to tshwane and or tambo airport   46   For more information on this document please contact
      Pick ‘n Pay “The Falls” – Greening retail                        48   Environment and Infrastructure Services Department
      Northern Water Works - Biogas to electricity project             50   The City of Johannesburg
      Robinson Deep Landfill - Gas to energy project                   52
                                                                            Website: www.joburg.org.za
      FNB Stadium - Events waste management                            54
      RE- Environmental solutions facility                             56
      Separation at source                                             58   © City of Johannesburg: Environment and Infrastructure
      6. Moving forward - Building on climate change resilience        60   Services Department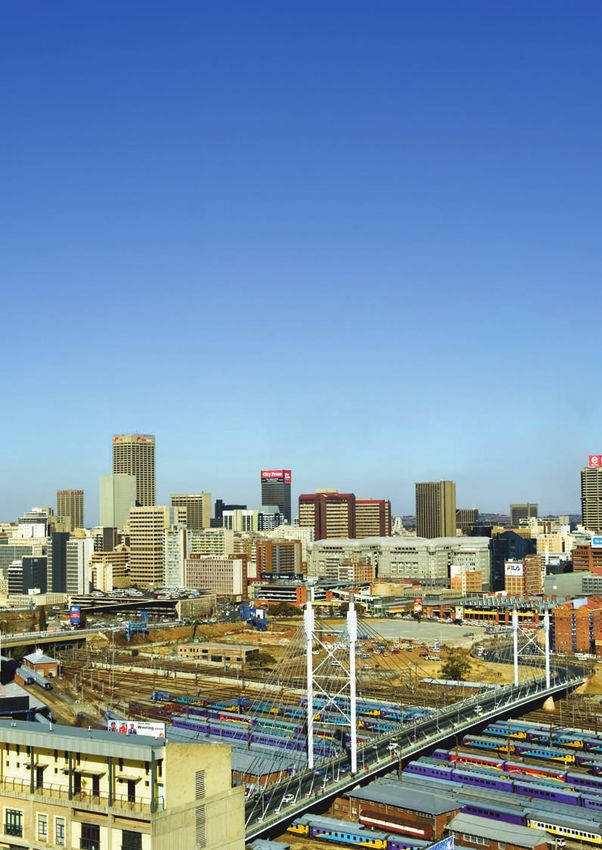
Mpho Franklin Parks Tau
                                             Executive Mayor
                                         City of Johannesburg

hello & welcome...
H
        osting of the 5th biennial C40 Mayors          premised on numerical modelling was developed
        Summit in Johannesburg, a first in the African that assessed climate risks to all the key sectors
        continent, resonates with the ‘Africa rising’  of the City. This plan was one of the shortlisted
mood that is geared towards profiling a positive       good practice projects in the inaugural C40 and
image of the continent. The Summit happens at a        Siemens Leadership Awards of 2013.
time when Africa is experiencing rapid urbanization
– the UN Habitat projected, for example, that by       The commitment to climate change adaptation
2025 fifty percent (50%) of the African population     was also demonstrated through the City signing
will be urban. The current reality                                        the Adaptation Charter at the
is that a significant proportion of                                       COP17 held in Durban in 2011.
urban dwellers in Africa live below                                       More importantly, the City has
poverty and are located in informal Johannesburg is building a city mainstreamed climate change
settlements that lack basic that adapts to Climate Change into                    its   seminal     strategic
services like storm water drains,                                         planning document – Growth and
proper roads and sanitation.                                              Development Strategy (GDS)
The Intergovernmental Panel on                                            2040. The GDS 2040 envisions a
Climate Change (IPCC) 4th assessment report            City that is resilient, sustainable and liveable.
emphasized that Africa is the most vulnerable
continent to the impacts of climate change due to      In the build up towards the upcoming event the
multiple stressors and low adaptive capacity.          City engaged with business on their view and
                                                       commitment towards Climate Change mitigation
Infrastructure and livelihoods in African cities are   and adaptation. It became clear that efforts to
at risk of climate change impacts that will manifest   build climate change resilience require a variety
themselves in the form of increase in frequency        of role players drawn from different sectors and
and intensity of storms, floods, heat waves, and       a strong interest was shown to work together
sea level rise. Erratic weather conditions threaten    with the City and other levels of Government to
to disrupt urban food supply, thereby exposing         address issues such as congestion, renewable
livelihoods to food insecurity.                        energy, public transport and waste minimization.
                                                       The City will provide the leadership and create
The foregoing presents an opportunity for              such a platform for purposes of cooperation and
African cities to develop adaptation strategies        forming partnerships. Together we can make a
with the view to understanding the risks at local      difference and influence the future for the sake
scale and building adaptive capacity. The City of      of a more sustainable, more resilient and a more
Johannesburg has walked this path as early as          liveable City. n
2009 wherein a comprehensive Adaptation Plan

                                                     1
Eduardo Paes
                                                    C40 Chair,
                            Mayor of the City of Rio de Janeiro

foreword
C
        ities are leading the way in the fight against          in which critical services – from waste management to
        global change, and Rio – like Johannesburg and          emergency response and traffic control – are monitored
        all of our members – are on the front lines. From       to improve the city’s efficiency and emergency response.
reducing emissions to preparing for the impacts of              We have also embarked on an ambitious program
climate change, C40 city administrations are taking bold        to revitalize Rio’s port district – Porto Maravilha – to
and measurable actions across key sectors to make their         transform the abandoned area into a centre for business,
cities more sustainable and improve the quality of life         tourism and leisure
for their citizens for years to come. As
the world becomes more urbanized,                                                  As this publication demonstrates,
our work going forward will be critical           Africa is a continent            Africa is a continent particularly
to creating a healthier, safer planet for  particularly vulnerable to the vulnerable to the effects of climate
all of our citizens today and for future      effects of climate change            change. However, the strong
generations. Cities’ global impact                                                 leadership       demonstrated        by
isn’t only in the fact that they are so                                            Mayor Parks Tau and the City of
important themselves, with more                                                    Johannesburg has set the city on a
than one-fifth of the entire planet’s GDP occurring in          path towards sustainability and provided a benchmark
the metro areas of C40 cities. It’s also in the fact that       for fellow African cities looking to take meaningful
cities routinely learn from each other. By engaging in          climate actions. Johannesburg’s Climate Change
City Diplomacy, mayors and city officials exchange              Adaptation Plan (CCAP), for example, was recently one
information and experience. They facilitate the spread          of only 29 projects globally nominated for the C40 and
of new technologies and access to innovative public             Siemens Climate Leadership Awards. The City’s Bus
policies. Creative ideas and projects in one city can be        Rapid Transit system is reducing the number of private
replicated in another, and that exchange of knowledge           cars on the streets and thereby reducing emissions. And
is taking place, far from lengthy and politically charged       the Mayor’s integrated waste management policy to
treaties. That’s in essence one of the strengths of our         reduce waste to landfill and increase recycling is already
organisation: collaboration.                                    making a positive impact. The hard work that Mayor
                                                                Tau and the City have put into preparing for the 2014
In Rio we have embraced both proven technologies                C40 Mayors Summit is evident and further confirms
and innovative sustainability solutions. We have                Johannesburg’s place as a sustainability leader.
implemented a Bus Rapid Transit that will increase the
high capacity transportation use from an initial level          I look forward to an exciting year ahead as C40 Chair
of 18% to 63% by 2016; we have also inaugurated the             and continued collaboration with Johannesburg and all
Rio Operations Centre, a digital nerve centre of the city       of our member cities. n

                                                            3
C40 CITIES
MAKE A DIFFERENCE
Each city in the C40 is unique in its
infrastrucrure and progress in addressing
climate change. C40 works to empower
cities to connect with each other and
share technical expertise on best
                                                                 Introduction
practices.                                                       The C40 Network

The C40 consists of 63 cities:            The C40 Cities Climate                          The C40 Approach
42 megacities and 21 smaller,                                                             Using a data-driven approach, the C40 team
“innovator” cities. Overall, roughly 40   Leadership Group (C40)                          identifies and promotes the exchange of
of the world’s 50 largest metro areas     Created by cities for cities, the C40 Cities
                                                                                          proven programs and policies developed by
are part of C40.                          Climate Leadership Group (C40) advances
                                                                                          cities. Recognizing that each city is unique in
                                          the climate action agendas of the world’s
                                                                                          its infrastructure and progress in addressing
                                          megacities in order to achieve meaningful
                                                                                          climate change, C40 empowers cities to
                                          reductions of greenhouse gas emissions and
                                                                                          connect with each other and share technical
                                          climate risks. The C40 consists of 63 engaged
                                                                                          expertise on best practices through active
                                          cities that are committed to replicable and
                                                                                          participation in C40 networks – working
                                          sustainable climate-related policies locally,
                                                                                          groups of member cities with commonly
                                          which address climate change globally. The
                                                                                          identified opportunities, interests or priorities.
                                          C40’s international staff works with the
                                                                                          Moreover, C40 provides world-class research,
                                          C40 network under the leadership of city
                                                                                          technical expertise and access to key partners
                                          governments to deliver this mission.
                                                                                          to deliver new programs and policies with

                                                                   4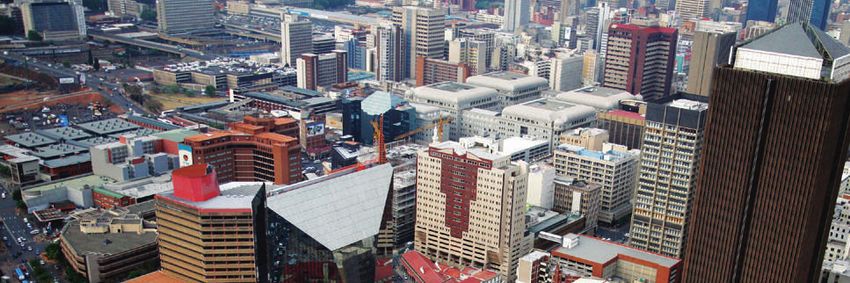
cities; and communicates cities’ individual        and within the global network of C40 cities.      Together we will work for a better future for
achievements and collective leadership.            Actively involved in various C40 networks,        urban populations around the world.
Through these activities, the C40 is making a      including the Sustainable Infrastructure
significant difference in improving the scale,     Finance Network and the Sustainable Urban
speed and impact of cities driving climate         Development Network, Johannesburg was
                                                                                                     Looking Ahead
                                                                                                     Looking ahead, there is considerable
change actions.                                    instrumental in forming both networks’
                                                                                                     opportunity for the city to accelerate
                                                   agendas in 2012. As the first African city to
                                                                                                     emissions reduction and adaptation activities
                                                   host the C40 Mayors Summit, Johannesburg
C40 Leadership & History                           Mayor Parks Tau and his administration are
                                                                                                     in sectors such as transportation, buildings,
Current C40 Chair, Rio de Janeiro Mayor                                                              waste management, urban water management,
                                                   aligning the City’s strategies and plans within
Eduardo Paes guides the work of the C40 with                                                         energy supply, spatial planning and urban
                                                   specific sectors to respond directly to the
the support of the Executive Team, the C40                                                           land use, food and urban agriculture,
                                                   impacts of climate change.
Board and the Steering Committee. Mayor                                                              information and communication technology,
Paes is a strong advocate for the role of cities                                                     finance and economy, and sustainable
in addressing climate change and brings both       Host of the 2014 C40                              communities. The City of Johannesburg
expertise and resources to bear on the work                                                          is looking forward to continuing to work
of the C40 organisation, strengthening the
                                                   Mayors Summit                                     collaboratively with other C40 cities through
                                                   The fifth biennial C40 Mayors Summit will
network of cities in pursuit of its common                                                           the networks to deliver on its shared and
                                                   take place February 4–6 in Johannesburg,
goals. Current C40 Steering Committee                                                                transformative aspirations. n
                                                   South Africa. Hosted by the city of
members are: Berlin, Buenos Aires, Hong
                                                   Johannesburg and delivered in collaboration
Kong, Houston, Jakarta, Johannesburg,
                                                   with C40, this event brings together C40
London, New York City, Rio de Janeiro, Seoul
                                                   Mayors from around the world to advance
and Tokyo.
                                                   urban solutions to global climate change
                                                   through individual efforts as well as
In less than a decade, C40 has positioned
                                                   international engagement and collaboration.
itself as one of the most effective global
organisations working to address climate
                                                   The theme of the 2014 Summit is
change. C40 was established in 2005 and
expanded via a partnership in 2006 with
                                                   ‘Towards Resilient and Liveable Megacities
President William J. Clinton’s Climate                – Demonstrating Action, Impact and
Initiative (CCI). To date, the following C40                     Opportunity’.
City Mayors have served as Chair: London           Plenary sessions will focus on key issues
Mayor Ken Livingstone (2005–2008); Toronto         such as adaptable and resilient cities,
Mayor David Miller (2008–2010); New York           building liveable cities and socio-economic
City Mayor Michael R. Bloomberg (2010–             development of emerging megacities.
2013); and Rio de Janeiro Mayor Eduardo
Paes (2013–present). Mayor Bloomberg               Urban leaders and sustainability and technical
currently serves as President of the C40 Board     experts across multiple sectors will exchange
of Directors.                                      ideas, forge new partnerships and address
                                                   cities’ unique problems and challenges in
Johannesburg in the C40                            confronting the issue of climate change.
The City of Johannesburg is already
undertaking meaningful and innovative              The City of Johannesburg looks forward
climate action and has cemented its role as a      to welcoming C40 Cities, partners and key
sustainability leader on the African continent     participants to the 2014 C40 Mayors Summit.

                                                                          5
CLIMATE CHANGE IN

SOUTH AFRICA
30% of South Africa’s population is highly
vulnerable to sudden & harmful climate shocks
 C
          limate change will affect the City of Johannesburg
          directly and indirectly, as the bulk of its resources
          are imported from neighbouring provinces and
  municipalities. Therefore, it is important to understand the
  impacts of climate change in the broader South African content.
  On a global scale, South Africa’s contribution to greenhouse
  gas emissions is small, accounting for less than 2% of total
  emissions. However, South Africa’s energy-intensive economy
  and reliance on coal-based electricity makes the country the
  13th highest (in absolute terms) carbon dioxide emitter in the
  world. Its per capita emissions are higher than those of many
  European countries and more than 3.5 times higher than the
  average for developing countries (Winkler 2007).

  South Africa is a middle-income developing country, has a
  population of about 50 million people and faces economic
  and social challenges. Built on a wealth of mineral resources,
  historically the primary sector dominated, but the economy is
  now shifting and the tertiary sector represents an ever-greater
  share of the GDP. Since the establishment of a democratic
  government in 1994, South African national policy has strived
  to address the legacy of apartheid, including high levels of
  poverty, social inequity, high unemployment, and associated
  social ills. While some progress has been made, significant
  development challenges remain. The high social inequality
  is revealed by a Gini coefficient of between 0.66 and 0.69,
  supported by several poverty and human development indices.
  A high unemployment rate, rural–urban migration trends
  and environmental risks in informal settlements all have
  negative consequences for human quality-of-life indicators.
  These inequalities are also reflected in health and education
  indices, which are contributing factors to severe skills shortages
  in several sectors (DEA 2011, South Africa’s 2nd National                Socio-economic impacts

                                                                           C
  Communication under the UNFCCC).
                                                                                    limate change impacts are not likely to be experienced
  Climate change is expected to have a major impact on South                        evenly throughout the country. However, as a large
  Africa, with consequences for the economy, people and                             proportion of South Africa’s society is impoverished,
  ecosystems. The country’s climate is generally semi-arid and             it is rendered particularly vulnerable to impacts of climate
  warm, but strong variations in both temperature and rainfall             change. At least 30% of South Africa’s population is highly
  lead to very different regional and local climatic conditions.           vulnerable to both sudden and harmful climatic shocks, with
  Widespread aridity makes South Africa prone to limitations               low levels of endogenous resilience, adaptation, and coping
  in water supply as a key vulnerability (DEA 2011, 2nd                    skills. The characteristics of this population include a unique
  Communication). The impact of climate change is going to be              disease complex burden, high mobility, a subsistence-level
  felt primarily through water resources. South Africa is already          existence, and informal settlement housing. ... Without
  characterized by low rainfall and high evaporation rates, as             adequate adaptation strategies, the impacts would manifest
  well as temporal variability and spatial unevenness, which pose          as worsening food security, exacerbation of existing disease
  major challenges to economic development and livelihoods.                burdens, and increased vector-borne and emergent diseases
  Agriculture and urban-industrial areas in many parts of the              and destructive social consequences. n
  country have suffered from floods and droughts. South Africa’s
  water infrastructure and management capacity may assist the              DEA 2011. South Africa’s Second National Communication
  country in adapting and responding to this variable climate              under the UNFCCC
  but also imposes a social and economic burden on the country
  (DWA 2013, Climate Change Status Quo Analysis Report for
  Water Resources). n

                                                                       6
SAVING ENERGY
TO SAVE ENERGY AT HOME
Switch off:
  Electricity appliances not in use
  Geysers during peak period
  Electricity appliances on standby mode
  Lights, heaters and air-conditioners in unoccupied rooms
Use the following:
   A shower instead of a bath
   Compact Fluorescent lights
   Alternative energy like solar geysers and gas stoves

TO SAVE ENERGY IN THE OFFICE AND FACTORY
Switch off:
  Kettles and urns after boiling water
  Lights that are not of vital importance
  Computers, printers and other appliances when leaving office
  Machinery neither in operation nor production line
  Office electrical appliances when going home
Do the following:
   Reduce lights in your office to a minimum
   Use windows instead of air-conditioners to cool office
   Avoid using heater to warm office unless under extreme cold conditions
   Use alternative energy such as solar and gas where possible

                                             City of Johannesburg
                                             City Power

                                             40 Heronmere Road      PO Box 38766      Tel +2711 490 7000
                                             Reuven                 Booysens         Fax +2711 490 7350
                                             Johannesburg           2016
                                                                                   www.citypower.co.za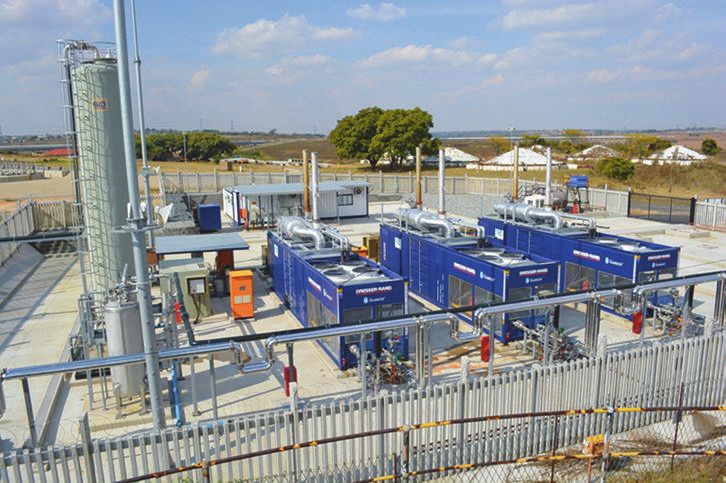
CLIMATE CHANGE IN
JOHANNESBURG
The city will face changes in temperature &
rainfall patterns
Clr. Matshidiso Mfikoe
Member of Mayoral
Committee:
Environment & Infrastructure
Services
My portfolio is directly and
ultimately responsible for
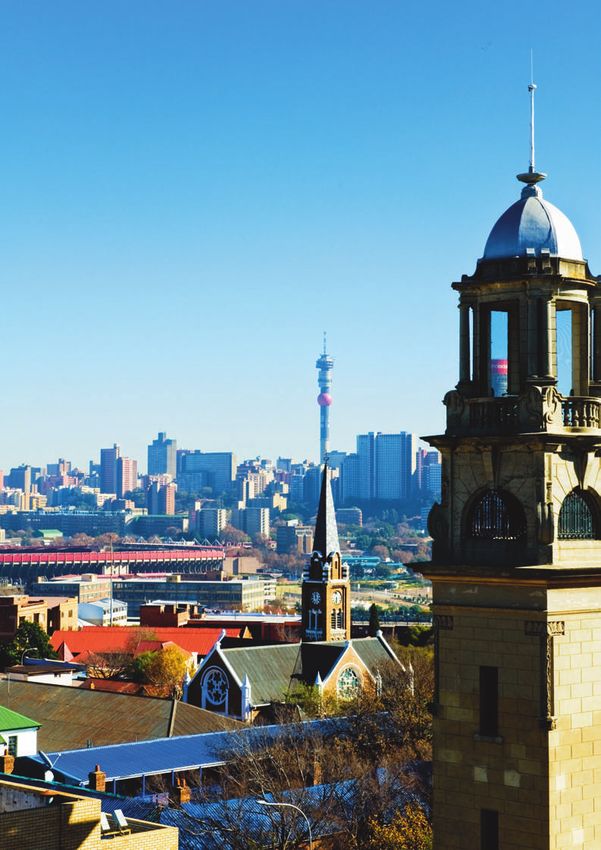
L
ocated in north-central South Africa, the Johannesburg environmental sustainability
is the country’s largest and fastest-growing city, with a and resilience. Besides
population of around 4.4 million spread across 1 006 overseeing City’s three major
930 households. At the southern part of the Gauteng province, utilities responsible for
sprawling suburbs spread out from the central city to cover an electricity distribution, water
area of 1 100 square kilometers. The City began as a mining and sanitation services, and
town in the late nineteenth century, as its nickname eGoli waste management, my real challenge lies with educating
(‘city of gold’) evokes, and is still today the capital of South our communities to understand climate change and the
African mining and commerce, home to the headquarters of
relationship that community behaviour has in contributing
mining companies, major financial institutions and a variety
of multinational corporations, and is a transportation hub of
to adaptation and mitigation measures in order to build
southern Africa. resilience.
The City was historically racially divided, and the legacy of
apartheid is apparent in the racial divide between districts and
suburbs – from the streets of Soweto to the posh mansions of
the northern suburbs. The political changes of the 1990s can be models were statistically downscaled, using historic data
seen most readily in the central city, which is today a bustling from eight weather stations based in and around the City. The
multicultural and multilingual area. projections were developed under the A2 ‘business as usual’
scenario similar to the Intergovernmental Panel on Climate
The City has remained largely exempt from natural disasters, Change in 2007. This study was commissioned to understand
as it is not located on a coastline or in an area heavily affected and to estimate the extent and magnitude of the anticipated
by major weather-related natural disasters, such as hurricanes climate change at city level.
or typhoons. In 2008, an assessment by MasterCard Worldwide
Insight 1 rated the City as the fourth best-placed city out of The climate change science may seem contradictory at
21 major cities in Asia, the Middle East and Africa in terms of times, but extreme fluctuations in weather patterns are, in
exposure to climate change-related risks. However, scientific themselves, an indication of the unpredictability of future
evidence suggests that the country – and the City specifically weather patterns. Nevertheless, certain trends are anticipated,
–will face increasing changes to weather patterns in the based on experience and analysis to date. Unlike coastal
future. Over the last 50 years, rainfall patterns have shifted areas in South Africa, which face increasing coastal storms
significantly, bringing increased risk of flooding to the City. and rising sea-levels, the primary outcome of climate change
expected in the City will be increased temperature and
The Climate Systems Analysis Group at the University of Cape rainfall. n
Town carried out climate model projections, as part of the
formulation of the City’s Climate Change Adaptation Plan
(CCAP). Seven internationally accepted general circulation
8How the city is affected
F
Clr. Sello Lemao
or developing countries such as South Africa, climate change Member of Mayoral Committee:
adaptation will have a considerable effect on the quality of life
Public Safety
over the long term. Many sectors in the City will need to introduce
adaptation measures, as much of the change will occur in the latter half Facilitation of Peace, Protection
of the century, as a result of past and current greenhouse gas emissions. and Prosperity of our citizens
is central to my responsibility
Widespread poverty makes many individuals, households, communities at Public Safety. The EMS
and cities vulnerable to even small shocks and stressors. The tendency functions which are tailored
of poor people to be highly vulnerable to climate change is often used around the City’s ten risks in
as a justification for implementing adaptation measures. However, relation to the protection of lives and property
whether the proposed adaptation measures will actually assist poor (including disaster management) articulates our
groups is seldom assessed. An underlying premise for sustainable
commitment to remaining alert and proactive in
adaptation is that many responses to climate change will create social
and environmental externalities, including trade-offs and negative cases of emergencies within the climate change
consequences. Sustainable adaptation thus considers the wider effects era context. JMPD core functions of traffic
of adaptive responses on other groups, places and socio-ecological management and bylaw enforcement also play a
systems, both in the present and in the future. critical role in ensuring compliance to the safety
and security standards and that of our citizens.
The need to drastically reduce greenhouse gas emissions and facilitate The application and advancement of the functions
a rapid transition to low-emission economies suggests that adaptation and tools of the EMS and JMPD are facilitated,
measures should emphasize low-emission solutions. Responses to overseen and directed from my office and the work
climate change can thus be seen as a means for promoting alternative
that unfolds as a result maintains the confidence
development pathways, such as transitions to low-carbon economies,
urban organic agriculture and horticulture, ecological sanitation, water I have in Public Safety to play its role efficiently
harvesting, water purification using solar energy, alternative modes in ensuring that we are always climate change
of transport, decentralized renewable energy supply, recycling or ready…both from an immediate, medium and long
participatory plant breeding. term safety and security point of view
The City recognizes that changes in temperature and rainfall as a result
of climate change will affect all of the City’s systems. Increased rainfall
events may lead to greater risk of urban flooding, and the poor will be
disproportionately affected. The City has recently developed a flood risk
assessment, highlighting and prioritizing areas of risk, and is developing
disaster management plans for each city region. Increased flooding will
also have an impact on the city roads and storm water infrastructure.
Multi-year budgets may need to be developed, to finance improvements
in storm water capacity and to develop new ‘natural systems’ to minimize
the impact of urban flooding (GDS 2040). n
9Temperature changes in the City
At a local scale, future model projections indicate that temperatures for the City will increase significantly over the next four to five
decades. This warming trend is expected to continue into the next century and will have a significant impact on average seasonal
temperatures. The average of the seven climate model projections indicates an annualized temperature increase of 2.4°C by the ‘near
future’ and 4.5°C further into the future. The largest increases are expected to occur in spring, with an average increase of 5°C for
maximum day-time and 5.2°C for minimum night-time temperatures by 2081–2100 (see Figures 1 and 2).
Based on a downscaled model, temperature increases show a maximum day temperature increase of approximately 0.5°C for the
Gauteng region. A decrease in the temperature is anticipated for the months of April, May, June, and July. No regions are expected to
experience temperatures below 0°C. n
City of Johannesburg: mean maximum temperature City of Johannesburg: mean minimum temperature
(Source: Climate System Analysis Group, 2009) (Source: Climate System Analysis Group, 2009)
25
25
20
20
Temperature (Degrees Celcius)
Temperature (Degrees Celcius)
15
15
10
10
5
5
0
0
Jan Feb Mar Apr May Jun Jul Aug Sep Oct Nov Dec Jan Feb Mar Apr May Jun Jul Aug Sep Oct Nov Dec
Month Month
Figure 1: The lines are the median values, while the shaded area represents the range or envelope Figure 2: The lines are the median values, while the shaded area represents the range or envelope
of the seven CGM projections. Far-future i.e. 2081-2100 (in blue). Near-future i.e. 2046-2065 of the seven CGM projections. Far-future i.e. 2081-2100 (in blue). Near-future i.e. 2046-2065
(in green). Control period i.e. 1961-2000 (in orange). (in green). Control period i.e. 1961-2000 (in orange).
Precipitation changes in the City
R
ainfall is a far more complex variable to model than temperature, Annual mean daily precipitation (mm/day)
with rainfall projections generally having a greater degree of (Source: Climate System Analysis Group, 2009)
uncertainty compared to temperature projections. Despite this
higher uncertainty, the climate models analysed appear to indicate that
rainfall may be expected to increase moderately, but significantly, into
3.5
the future. The effect would be a longer rainy season, starting earlier
in spring and extending into early autumn, and an increase in the
3.0
frequency and intensity of rainfall (see Figure 3).
Precipitation (mm/day)
2.5
The average precipitation projections for the seven climate models show
an 18% increase in annual rainfall by mid-century, with a slightly larger
increase of 27% projected for the period 2081–2100. These percentages
2.0
are not intended to be presented as firm predictions of future rainfall
but provide a useful indication of the possible scale of climate-change
1.5
impacts on rainfall in the City, and indicate the probable trend i.e.
increased rainfall.
1.0
Total annual rainfall is also expected to increase across all areas, ranging
1960 1970 2000 1980 2010 1990 2020 2030 2040 2050 2060 2070 2080 2090 2100
from 301mm to 758mm per annum. The majority of this rainfall is
Year
expected to fall during the summer months (December, January and
Figure 3: Time series of downscaled mean annual daily precipitation (mm). Control Period:
February). An extension of the rainy season is also expected, with the 1961-2000, near future: 2046-2065 and far future: 2081-2100 for Johannesburg. The horizontal
number of rain days per month expected to increase by between 1 036 line represents the long-term median value for the 7 model simulations of the control period
and 2 188 days. This small change in the number of rain days per month, (1961-2000). The dark line represents the median value for the 7 projections of the future
climate. The shaded area denotes the envelope of these projections
together with the increase in rainfall, demonstrates that the intensity
and possibility of severe rain events may increase. At the lower limit of
change, a decrease in the number of rain days for the majority of the
year is also a possibility. n
10Assessment of potential climate change impact
I n many cities, climate change adaptation is often seen as secondary to climate change mitigation. The development of future policy
needs to ensure that the appropriate balance between adaptation and mitigation is achieved. In 2007 the IPCC 4th Assessment
Report highlighted that impacts and risks of climate change are more imminent and severe than previously thought: between 2050
and 2100 climate change could have a disastrous impact on economies, society, security, development and social safety net systems,
particularly in poor countries. Therefore, actions such as building climate change resilience (i.e. adapting) must take place in parallel
with mitigation efforts. The City conducted a detailed climate change vulnerability assessment in order to assess the impacts of climate
change. Table 1 provides an overview of the different climate change phenomenon and their impact on food, water, health and human
settlements. n
Phenomenon and Food production and Human settlements,
Water resources Human health
direction of trend biodiversity society and industry
Hot days and nights Decreased food production, Decreased water availability Decreased activity & Increased energy demand
increased insect outbreaks due to evapo-transpiration economic output for cooling, deterioration of
air quality
Warm spells / heat waves Decreased food yields due to Increased water demand and Increased risk of heat related Decreased quality of life
heat stress, decreased food decreased water quality mortality, especially for the especially for those without
security and increased danger (e.g. algal blooms) elderly, chronically sick and proper housing
of wild fires socially isolated
Heavy rainfall Destruction of biodiversity Potential impacts on the Increased risk of deaths, Disruption of settlements,
quality of surface groundwater injuries and infectious commerce, logistics &
respiratory and skin diseases societies due to flooding.
Damage to infrastructure &
loss of property.
Dry spells / Drought Loss of biodiversity and Decreased water availability Increased risk of malnutrition, Water shortages for human
decreased food production for many essential services increased food and water settlements, industry &
prices society. Potential loss of
investment competitiveness.
Thunderstorms & strong Wind throw / uprooting of Power outages disrupting Increased risk of death & Disruption of economic
winds trees water supply injury, post-traumatuc stress activity, loss of property,
disorders withdrawal of insurance
cover for vulnerable areas.
Migration.
Table 1: Source: CCVA, 2008
11THE CITY OF JOHANNESBURG
POLICY APPROACH
on climate change action
General approach towards climate change
T
he role of local government in South Africa’s climate • To reduce the risk of further load shedding and improve
change agenda is critical because municipalities the security of electricity supply.
coordinate implementation in communities. The
local sphere is better placed to create public awareness and Long-term goals
assist communities in building a better and more sustainable • To improve the cost efficiency of City Power.
environment, which includes natural resources such wetlands, • To enhance energy efficiency and distributed renewable
rivers and parks. generation over the longer term.
• To reduce greenhouse gas emissions by the City.
Climate change adaptation that benefits one sector or group
may undermine the security and wellbeing of others, by (for The EDSM policy contains strategies for shifting load
instance) influencing access to resources and the integrity and reducing demand: end-use energy efficiency, load
of ecosystems that many people depend upon for their management, distributed renewable energy and fuel-switching,
livelihoods. Informed by the City’s CCAP, a climate change as described in Table 2. Through these strategies, the City will
vulnerability assessment was undertaken to understand the be able to reduce costs and environmental impacts (i.e. the
risks and vulnerabilities for citizens over time. Recent floods City’s greenhouse gas emissions) while meeting demand and
in communities such as Soweto have exposed the City’s improving competitiveness.
vulnerability to climate risk and emphasized the importance of
protecting the City from possible future changes to its climate. The City’s EDSM policy is aligned to the national government’s
Current adaptation interventions include mapping flood- energy efficiency and demand-side management rules,
prone areas, developing early warning systems for climatic and which are aimed at implementing energy efficiency, reducing
related disasters, raising awareness in vulnerable communities, electricity demand through financial incentives and installing
and developing a climate change cost-benefit analysis and a one million solar water heaters by the end of 2014. These rules
heat-wave response plan. were developed following the introduction of the government’s
energy efficiency and demand-side management policy. The
In response to energy supply constraints, resource constraints South African National Energy Regulator published measures
(availability of water and land for landfill) and growing to encourage rapid and large-scale implementation of energy
environmental concerns, the City has developed the Energy savings, in line with government policy on energy efficiency.
Demand-Side Management (EDSM) policy to encourage This is one of the short-term measures to address South
residents and businesses to reduce their demand for energy. Africa’s power supply constraints, by reducing electricity
The EDSM policy is aligned to the energy efficiency guidelines demand instead of commissioning new capacity. These rules
for buildings and land use in the City and includes the apply to all South African municipalities, including the City.
following goals:
Short-term goals
• To relieve current constraints on electricity infrastructure
(City Power distribution and transmission networks).
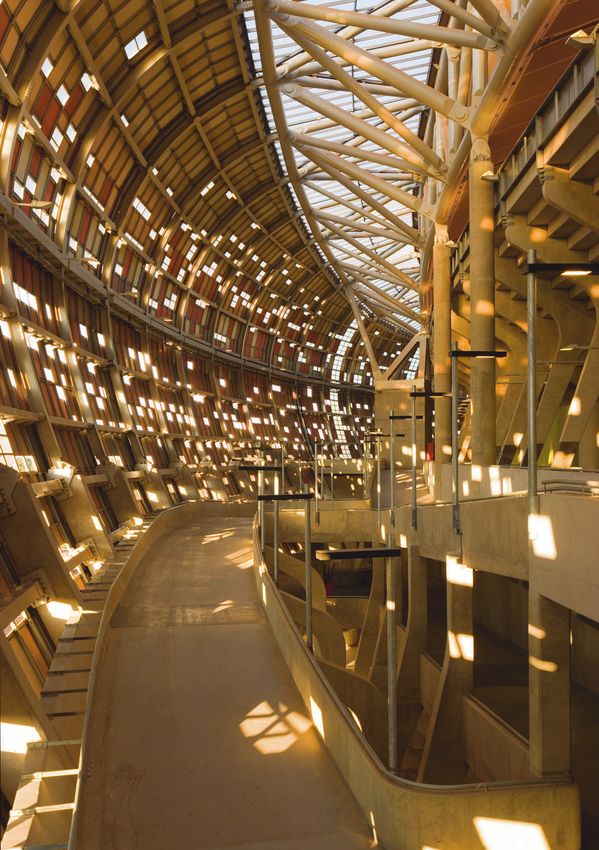
12Climate change mitigation
action in the city
T
o prevent the worst excesses of climate change occurring
from the second half of the 21st century, global
greenhouse gas emissions need to fall below 1990 levels
within a few decades and be reduced to a fraction of that (60%
or more) thereafter. When the stabilisation of greenhouse gases
has been achieved, temperatures will continue to rise for a
century or more, and the sea level is projected to rise for many
centuries. The slow transport of heat into the oceans and the
slow response of ice sheets mean that it may take a millennium
Industry & Commerce or more before a new climate system equilibrium is reached.
7,047,868 tonnes
Regardless of the final outcome, reducing emissions will delay
Transport and reduce the damage caused by climate change (IPCC 2007).
36,1% 31,1% 6,087,678 tonnes
The main sectors that contribute to greenhouse gas emissions
Household in South Africa include industry and commerce, transport,
5,973,963 tonnes local authority and households. South Africa’s energy sector
Local Authority contributes about 15% to the country’s GDP. This is the most
276,600 tonnes important sector when considering mitigation, as 80% of
1,4% greenhouse gas emissions are related to energy production
30,6% Other (Winkler 2006). Thanks to its large coal deposits, South Africa
0,8% 157,863 tonnes is able to offer electrical power that is cheap by international
standards. The low cost of energy has given local industries
a competitive advantage and encouraged energy-intensive
Figure 4: City of Johannesburg carbon footprint in the energy sector industries. The industrial sector consumes almost 50% of
(tCO2e) (Source: SoER 2007) the total energy generated in South Africa. Commercial and
residential energy users are, directly and indirectly, responsible
for about 2% of the national greenhouse gas emissions. These
sectors are growing rapidly due to urbanisation, and their energy
consumption is rising even faster because of rising wealth and a
policy of providing energy services. Therefore, there is potential
for significant mitigation in these sectors.
Impacts on Impacts on
EDSM activity Comment
energy use electricity use The City is one of the largest greenhouse gas emitters in South
Energy efficiency Reduces demand for energy and Africa, but as Figure 4 shows, the contribution of the local
Down Down authority is relatively modest in comparison to the City’s overall
electricity.
carbon footprint, which predominately comprises industry and
Load management Changes timing, typically of
Constant Constant commerce, transport and households.
electricity use.
Distributed Reduces demand for electricity The City is currently developing a comprehensive greenhouse
renewable energy Constant Down but not for energy. Changes
gas emissions inventory to understand better its carbon
composition for energy use.
footprint. The World Resources Institute (WRI), C40 Cities
Fuel switching Changes composition for energy Climate Leadership Group (C40), and Local Governments for
Constant Down
use.
Sustainability (ICLEI) are jointly developing an international
Table 2: Energy Demand Side Management interventions and their impacts on greenhouse gas accounting standard for cities, called the Global
electricity use. Protocol for Community-Scale Greenhouse Gas Emissions
(GPC). The standard provides cutting-edge advice and support
to local governments for a transparent, consistent and common
approach to measuring emissions. The GPC also offers the City
an internationally accepted management tool to help to compete
globally and to make informed decisions about climate change.
Johannesburg is one of the first cities to implement the GPC in
Ms Matshidiso Mfikoe, the Mayoral Committee member order to measure and manage its emissions to improve quality
of life and attract funding. In the long term, the greenhouse gas
responsible for Environment, Infrastructure and Services,
monitoring system will assist in allocating carbon targets to the
recognizes that adapting to the impacts of climate change as different sectors, as articulated in the National White Paper on
well as mitigating greenhouse gas emissions within the City Climate Change. Establishing a greenhouse gas monitoring
are critical to the wellbeing of the City’s inhabitants. She system creates a baseline for the City’s carbon footprint and
instigated the development of the City’s Adaptation Action for future trajectories under business as usual and required by
Plan and is the driving force behind the development of a science scenarios to align with national targets. n
detailed understanding of the City’s carbon footprint, as a
first step towards the City’s mitigation activities. n
13Building resilience to climate
change in the city
I
nvestment in adaptation can be unnecessarily confusing
and result in delayed planning and implementation of
urgent actions. Differentiating between ‘acclimation’
adaptation and ‘resilience’ adaptation can assist in making the
Action Level A: Action Level B:
right investment decisions. Acclimation adaptation addresses
strategies to cope with the gradual changes in the background,
e.g. gradual warming, while resilience adaptation addresses Prioritise Review
the potentially damaging effects of changing climate extremes, for Adaptation. Opportunities / Adapt
e.g. sudden major floods exacerbated by poor drainage systems within
(Midgley et al., 2007).
The Adaptation Action Plan for the City identified risks that
were categorized according to a four-tiered scale (or ‘action
level’), based on the potential impact and likelihood of the risk:
Action Level C: Action Level D:
• Action level A: prioritize for adaptation.
• Action level B: review opportunities/adapt within
constraints. Surveillance No Concern
• Action level C: surveillance monitoring. Monitoring
• Action level D: no concern.
The risks identified as level A are outlined in Table3.
Twelve level B risks were identified and include the risk of
increased shack and veld fires and the risk of disruption to
food security.
High Temperatures Heavy Precipitation
Increased heat related deaths Injury and human deaths, property destruction
Increased energy demand Damage to water supply and sanitation
Increased water demand Increased road accidents
Biodiversity impacts on Disease Vectors
Disruption of Water Security (arising from outside the City of Johannesburg)
Climate Change - driver
Table 3: Level A identified risks
A key issue is that much of the City’s climate change-related the following areas:
vulnerability stems from several systems that are already • Integrating climate-change adaptation into the City’s
severely stressed under existing climatic conditions. Of the strategic planning mechanisms, including reviewing
ten level A-rated risks, four are directly related to the threat the management and organisational structures
of increased urban flooding, yet the City’s storm water for implementing climate-change adaptation (and
infrastructure is already taking strain, which gives cause for mitigation) projects.
concern. A wide range of adaptations have been developed • Developing alternative financing options for the funding
for each of the level A-rated risks, taking into account the of adaptations.
City’s specific needs, constraints and requirements. Of critical • Developing a climate change information management
importance in the short-term is the development of an early- system to support effective decision making within the
warning system that can be used to prevent loss of life and City.
property during extreme flooding events. The City also needs • Improving stakeholder engagement.
to develop a heat-wave response plan. Although no empirical
evidence is available to show a direct relationship between Effective implementation of these (and other) risk-specific
heat-waves and loss of life in the City, this area is important adaptations will require commitment at both the planning
given the projected increase in maximum temperatures. and resource level from a broad range of City departments,
In addition to these risk-specific adaptations, a number of municipal entities and other stakeholders. More importantly, it
strategic-level adaptations have also been identified. will rely on effective communication and coordination among
the different role-players. n
Fundamental to the City’s effort to adapt effectively to the
threat of climate change, these strategic adaptation focus on
14Energy demand side
management
E
nergy efficiency is regarded as a quick-win intervention
area to improve electricity usage by all sectors. It
requires measures that mainly include behavioural
change, especially in South Africa where electricity has
been cheap and abundant for many years. Key initiatives
to fast-track energy efficiency include intensive campaigns
to encourage behavioural change and public investment in
energy-efficient appliances. Another quick win is retrofitting
buildings with energy-efficient lighting, geysers, energy-saving Clr. Mally Mokoena
IT gadgets and central warming systems where possible. Member of Mayoral Committee:
Corporate & Shared Services
The City has been implementing a number of interventions to From my perspective, it is
reduce greenhouse gas emissions, enhance energy efficiency
critical to ensure that a city’s
and reduce demand. These include retrofitting council-owned
buildings to improve consumption (lighting), the Bus Rapid administration not only keeps abreast with global trends
Transit (BRT) system as a carbon reduction and income- aimed at mitigating the negative impact of climate
generating system, the program that promotes the low-smoke change but also acts accordingly, by ensuring that the
alternative fire lighting method (Basa njengo Magogo), business planning processes and the organisational
greening the City, waste minimization, installing solar water design fully support the strategic agenda within the city.
heaters in low-cost housing, and public/street lighting as part
of the climate proofing and sustainable human settlements
programs. n
Did you know?
17% The City accounts for 17% of South
Africa’s Gross domestic Product.
The city’s governance and
institutional model
S
ince 1996, the City has taken a long-term strategic planning
approach. The City’s strategic agenda has evolved over the
years and is marked by certain milestones:
Joburg 2030. This strategy was approved in 2001 and focused
on basic services (in response to service backlogs and most
apparent inequalities at the time, as a result of apartheid) and
recognised only the formal economy sector.
Growth and Development Strategy 2006 (Joburg GDS 2006).
This corporate city-wide strategy consolidated various strategies Resilience • Sustainability • Livability
(i.e. the Human Development Strategy, the Integrated Transport
Plan and the Safety Strategy) and had a strong ‘pro-poor’
emphasis and a shared growth vision.
Joburg 2040 (approved in 2011). This strategy recognizes
communities as critical partners, has a special focus on resource
sustainability and builds on three key concepts: resilience,
sustainability and liveability. Joburg 2040 proposes a new
Economic
paradigm (as illustrated in Figure 5) that has four interrelated Growth
drivers, which contribute to a resilient, sustainable and livable Governance
City: Human & Social
• Human and social development (improve quality of live Development
and development-driven resilience) Environment and
• Inclusive and productive economic growth (ensure an Services
inclusive, job-intensive, resilient and competitive economy
that harnesses the potential of citizens) Figure 5: A new paradigm
• Environment and services, including the related
infrastructure (provide a resilient, livable, sustainable
urban environment, underpinned by infrastructure
15Executive Mayor
Political Portfolios Political Portfolios
Environment &
Economic Development Community
Infrastructure Housing Public Safety Transport Health & Social Development
Development Planning Development
Services (MMC) (MMC) (MMC) (MMC)
(MMC) (MMC) (MMC)
(MMC)
City Manager
Chief Operations
Manager
Executive Dir: Executive Dir: Executive Dir: Executive Dir: Executive Dir: Executive Dir: Executive Dir: Executive Dir: Executive Dir:
Economic Development Environment & Housing Public Safety Community Transport Health Social
Infrastructure Development Development
Development Planning
Services
Boards Boards Boards Boards Chief of Police Boards Boards
Joburg Market Joburg Joburg Water JOSHCO Joburg Theatre Joburg Roads
Joburg Property Development City Power Management Agency
Management Agency Company Metrobus
Pikitup
Company
Figure 6: Organisational structure of the City of Johannesburg
supportive of a low-carbon economy). The Mayoral Committee is responsible for individual portfolios
• Governance (establish a high-performing metropolitan such as community development, housing or finance, and
government that pro-actively contributes to and builds reports directly to the Executive Mayor. The Executive Mayor
a sustainable, socially inclusive, locally integrated and is also Johannesburg’s first citizen and represents the City
globally competitive Gauteng Region). at ceremonial functions. The current Executive Mayor of
Johannesburg is Mpho Parks Tau, who took office in May 2011.
The following Mayoral Priorities also indicate the institutional n
shift towards environmental sustainability and resilience:
1. Green ways and mobility
2. Shift to low-carbon economy
3. Urban water management
4. Integrated waste management
5. Sustainable human settlements
6. Economic growth (sector diversification)
7. Citizen participation and empowerment
8. Human capital development and management
9. Financial sustainability
10. Strategic communication and marketing
11. Safe, secure and resilient City
12. A City where none go hungry
The implementation of this long-term vision and strategy
required that the City re-look at its institutional design. The
concept of ‘clusters of functions/departments’ was introduced
to facilitate integration and coordination (see Figure 6).
The new institutional structure enables the Executive Mayor and
the City Manager to strengthen the implementation of political
decisions. The combined office ensures that policy development,
monitoring and evaluation, programs and initiatives are aligned
with the political agenda of the Executive Mayor and the
Mayoral Committee. The Mayoral Committee functions like a
local cabinet, with individual members having responsibility
for different aspects of municipal government. Each member
of the Mayoral Committee chairs a portfolio committee that
is made up of councillors drawn from all political parties. The
Executive Mayor is at the centre of the system of governance,
and the executive powers are vested in him by the Council to
manage the daily affairs of the City. This means that he has the
overarching strategic and political responsibility.
16Biogas to Electrical Energy Project. Johannesburg Water is caring for the environment by being energy efficient.
CLIMATE CHANGE

RESILIENCE
in the city

  The City’s climate change themes

  T
           he City of Johannesburg’s Executive Mayor and the
           Members of Mayoral Committee (MMCs) recognize                         Sustainable Communities
           that the expression ‘The choices we make today will
  determine our future’ is particularly true for the impacts of                  Green Transport
  climate change over time. To make sure that the City prepares                  Urban Water Management
  itself in a coherent and structured manner, the MMCs
  identified and adopted four climate change themes aligned                      Integrated Waste Management
  with their different aspects of municipal government.
  The four themes are:

  Sustainable Communities

                                                                       W
                       Clr. Chris Vondo                                            ith the future becoming more unpredictable and
                       Member of Mayoral Committee:                                uncertain, the City’s strategies must navigate
                       Community Development                                       a developmental path that can accommodate
                        Joburg has a large percentage of               uncertainty and enable the City to achieve its goals in a way
                        people that are marginalized due to            that takes cognizance of scarce, finite natural resources and
                                                                       climate-change impacts. The City continues to attract local
                        lack of access to social and community
                                                                       and international migrants and refugees seeking economic
                        facilities that are predominantly located      opportunities and a better quality of life. With climate change,
                        in the urban core. Corridors of Freedom        the pace of migration is expected to increase, as people
                        suggests that we accommodate them              face natural resource scarcity and collapse of agricultural
                        closer to public transport routes and          livelihoods due to rising temperatures and extreme weather
                        transportation nodes. This provides            events. The recent national census figures confirmed that
          real motivation to remove informal settlements               Johannesburg has 1.3 million households, which are estimated
          within flood plain areas to these more sustainable            to grow to 1.4 million by 2015.
          locations. This will then be an indirect adaptive
                                                                       The City continues to face massive challenges of urban poverty,
          response to climate change because it will reduce
                                                                       inequality, social exclusion and underdevelopment. It must
          the risk of loss of live and damage to goods for these       simultaneously address the disparities and inequities of the
          vulnerable communities.                                      past and transform the City, overcoming its dysfunctional
                                                                  18
Sustainable human settlements
programme
T
he City must also promote resilient human settlements that can
withstand the anticipated increased temperatures and wetter conditions Clr. Dan Bovu
as a result of climate change. The City recognizes the need to become Member of Mayoral
more resource efficient and smarter in the way it delivers services, to reduce
Committee: Housing
its carbon footprint while still expanding access for all residents, and to build
resilience in the face of climate change impacts and threats. This aspiration is Migration from rural
embodied in the GDS vision and goals for the development of the City towards areas as a result of
2040. The prioritisation of sustainable human settlements is informed both changes in the climatic
by these concepts and the need to promote a more efficient, inclusionary and conditions manifests itself in the City as a social
integrated urban form. and economic problem and addressing these
challenges places tremendous pressure on the
The historic conditions which shaped Johannesburg have resulted in a divided
City to provide affordable and appropriate
city, characterized by urban sprawl and long travel times. Accordingly, the
program’s priority is based on a strong interventionist approach, with a focus housing at the least compromising locations.
on spatial transformation that promotes integration and social inclusion,
maximizes efficiencies, and improves access to opportunities and quality of life
for all residents. A key priority is the assimilation of the poor and ensuring they
are not relegated to the margins of the city.
The other strong principle relates to liveability – where all citizens are able to
access key infrastructure and services such as transportation, water, sanitation,
food, clean air, affordable housing, meaningful employment, and green parks
and open spaces. At a basic level, the City must improve the lives of those who
reside within its area of responsibility, by ensuring access to basic infrastructure
and education, health, housing and social services.
Past interventions in support of sustainable human settlements focused on
promoting a compact urban form, densification and nodal development.
Programs were aimed at upgrading marginalized areas and improving
livelihoods, and concentrated on improving service provision and mobility
options, including energy-efficiency initiatives such as the roll-out of solar water
geysers in some areas. Such programs involved regularising and upgrading
informal settlements and providing and enabling inclusionary housing,
alternative rental stock and resilient dwelling structures through consultative
and participatory approaches. The focus has now shifted towards a transit-
oriented development approach, which is intended to change the entrenched
Did you know?
settlement patterns in the City. It also aims to slow down the process of urban There are over 6.8 million trees in
sprawl and the uncontrolled spread of low-density developments on the over
Johannesburg. 2 million trees are
fringes of the City. This approach seeks to ensure spatial integration through
investment in mass public transportation systems that form the backbone of
6.8 located within the City parks and along
its pavements and 4.8 million trees are
spatial transformation interventions at key points along ‘corridors’, including million located on private properties. The City
the ‘corridors of freedom’ initiative. n is therefore sometimes quoted as the
trees
largest urban forest in the world.
spatial form and building more integrated and liveable
communities, while expanding access for all residents to
economic opportunities, basic services and quality of life. In
addition, increased income levels result in increased levels
of consumption and waste production which puts further
pressure on natural resources.
The challenge for the City is to be able to satisfy local demand
for services and opportunities and to overcome levels
of poverty and lack of access without merely replicating
the consumptive patterns of other cities. A sustainable
development trajectory must be set, by promoting and
advancing more sustainable practices, technologies and
efficiencies for using non-renewable natural resources, and the
generation of waste. n
19You can also read