Mini-Bru Brussels-Capital Region in figures - BISA.brussels
←
→
Page content transcription
If your browser does not render page correctly, please read the page content below
Mini-Bru
Brussels-Capital
Region
in figures

202 2
INTRODUCTION

                                                                     Dear readers,

                                                                     We are pleased to present the 2022 edition of Mini-Bru. This brochure
                                                                     allows you to discover at a glance the most recent key figures on the
                                                                     Brussels-Capital Region. Whether you are interested in the population
                                                                     of Brussels, the economy, household income and expenditure, labour
                                                                     market, spatial planning, mobility or many other topics, the Mini-Bru
                                                                     2022 is your gateway to learning more about the Brussels Region and its
                                                                     main players and having its key figures at your fingertips.

                                                                     This edition reflects the significant impact of the health crisis related to
                                                                     the Covid-19 pandemic in many areas. This impact can be seen, for
                                                                     example, in the increase in the number of deaths, the decline in life
                                                                     expectancy, the drop in international migration, the reduction in certain
                                                                     types of household expenditure (culture, leisure, hospitality), the increase
                                                                     in public spending and the drop in the number of visitors in the transport,
                                                                     tourism and cultural sectors. These figures must therefore be interpreted
                                                                     in the light of this major change.

                                                                     Mini-Bru 2022 also turns the page on Brexit, as the statistics related to
                                                                     the European Union now cover 27 Member States following the UK’s exit.
                                                                     Finally, this year’s brochure includes new data on business migration,
                                                                     long-term temperature trends, air quality trends and a barometer of
                                                                     attendance at museums and attractions. These novelties are a reflection
                                                                     of the work carried out by BISA to constantly enrich its data and fields
                                                                     of study!
PRODUCED BY
                                                                     We hope that the Mini-Bru 2022 will arouse your interest and that you
Brussels Institute for Statistics and Analysis (BISA)
                                                                     find it a rewarding read.
LAYOUT AND PRINTING
Artoos group

COVER PHOTO
© visit.brussels - Jean-Paul Remy

PRELIMINARY REMARKS
Data as of 27 January 2022
Administrative divisions prevailing on 1 January 2021

MORE INFORMATION
Brussels Institute for Statistics and Analysis (BISA)                Astrid Romain                            Antoine de Borman
perspective.brussels                                                 Director of BISA                         Director General
Rue de Namur, 59 – 1000 Brussels                                     perspective.brussels                     perspective.brussels
 T. 02/435.42.30
bisa@perspective.brussels
https://ibsa.brussels
(this publication can be downloaded on this website in pdf format)

PUBLISHER
Astrid Romain

© 2022 Brussels-Capital Region. All rights reserved.
       2                                                                                                                                 3
TABLE OF CONTENTS BRUSSELS IN A FEW DATES
1015-1020 First mention of Bruocsella as portus on the Senne
Brussels in a few dates 5
1229 First urban charter
1357-1379 Construction of an 8 km pentagon-shaped
Brussels in Belgium and the European Union 6
Until 1500
enclosure
XIVth Golden Age for the Brussels luxury drapery industry
Population 8
1402 Start of construction of the City Hall
on the Grand-Place
Labour market 11 1430 Philip the Good chooses Brussels
as his primary residence
Household income and expenditure 14 1506-1555 Reign of Charles V who regularly resides in Brussels
XVIth-XVIIth Golden Age for the Brussels tapestry manufacturers
1500 – 1800
Research and technology 16 1549 Ommegang procession in honour of the
son of Charles V
Economy 18 1561 Opening of the Willebroek Canal linking Brussels
to Antwerp
Public finances 21 XVIIth-XIXth Golden Age for the Brussels lace industry
1831 Brussels becomes the capital of independent
Political institutions 22 Belgium
1832 Opening of the Brussels-Charleroi Canal
1834 Establishment of the Université libre de Bruxelles
1800 – 1900
Education and early childcare 23
(ULB)
Health 24 1835 Opening of the Brussels-Malines railway
1871 Opening of the covered Senne and the City
Land-use planning and real estate 26 Centre boulevards
1898 Start of construction of the Horta home
in the Art nouveau style
Environment and energy 28
1929 Hergé publishes Tintin’s first adventures
1951 First edition of the Queen Elisabeth International
Mobility and transport 30
Music Competition
1952 Opening of the North-South railway junction,
1900 – 2000
Tourism and culture 32
begun in 1911
1957 Treaty of Rome, Brussels becomes the headquarters
Abbreviations 34 of the European Economic Community
1958 Opening of the Atomium for the World’s Fair
Definitions 35 1967 NATO sets up its headquarters in Brussels
1989 Creation of the Brussels-Capital Region
within Federal Belgium
2000 Brussels is the European Capital of Culture
and hosts the opening game of the European
Football Championship
2005 The Brussels population surpasses
the one-million mark
As of 2000
2009 Opening of the Magritte Museum
2013 François Englert (ULB) is awarded the Nobel Prize
for Physics
2014 Transfer of many competencies to the Brussels-
Capital Region following the 6th State reform
2019 The Brussels-Capital Region celebrates its
30th anniversary
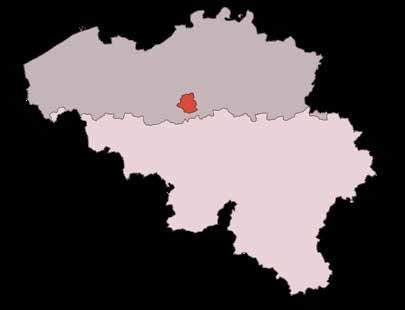
4 5BRUSSELS IN BELGIUM AND THE EUROPEAN UNION
Brussels-Capital Region
Netherlands
Bruxelles
Jette
Flemish Region Ganshoren
Evere
Germany Berchem
Koekelberg Schaerbeek
Ste-Agathe
Molenbeek St-Josse
St-Jean Woluwe
ten-Noode St-Lambert
Etterbeek Woluwe
St-Gilles St-Pierre
Walloon Region
Anderlecht
Ixelles
Auderghem
Forest
France Grand- Watermael-Boitsfort
Uccle
Duchy of
Luxembourg
BISA ©
Brussels UrbIS ®©
Population, health, education Year BCR Belgium EU 27
Population (number of inhabitants on 1 January) 2021 1,219,970 11,521,238 447,007,596
Population density (number of inhabitants per km²) 2021 7,511 375 109
Share of population under age 18 (%) 2021 22.6 20.1 18.2 1
Share of population aged 65 or over (%) 2021 13.0 19.3 20.6 1
Share of non-nationals in the population (%) 2021 35.5 12.6 8.2 1
Life expectancy at birth (number of years) 2020 79.6 80.8 81.3 2
Fertility rate (number of children per woman) 2020 1.59 1.55 1.53 2
Share of persons aged 25-64 with a high level of education 3 (%) 2020 49.3 42.4 32.8
Economy
GDP (million euro) 2019 86,651 476,203 13,963,897
GDP per capita (euros) 2019 71,412 41,546 31,200
Labour market
Employed population aged 15-64 (thousands of people) 2020 464 4,741 192,238
Employment rate (% of the population aged 15-64) 2020 56.5 64.7 67.6
ILO unemployment rate 4 (% of the population aged 15-64) 2020 12.4 5.6 7.2
Land
Total area (km²) 162 30,689 4,225,127
Sources: Eurostat, NAI (Regional accounts), Statbel, BISA calculations
1
2020
2
2019
3
Tertiary education (levels 5 to 8 of the International Standard Classification of Education 2011)
4
Survey data which differs from administrative data on unemployed job seekers
6 7POPULATION POPULATION
POPULATION OBSERVED AND PROJECTED NON - NATIONAL POPULATION 1
Number of inhabitants on 1 January 2021 2030 Number of inhabitants on 1 January 2021
Men 599,074 619,423 Men 215,139
Women 620,896 637,740 Women 217,558
0-2 years 47,889 48,586 Under 18 years 79,668
3-5 years 48,174 44,151
18-64 years 323,935
6-11 years 95,016 83,587
65 years and older 29,094
12-17 years 84,474 87,741
18-29 years 209,118 224,054 Nationality of an EU 27 country (without Belgium) 279,1 1 1
30-44 years 291,241 289,117 Other nationality 153,586
45-64 years 285,032 302,188 Total non-national population 432,697
65-79 years 111,316 126,560
Number of foreign nationalities on 1 January 185
80 years and older 47,710 51,179
Total population 1,219,970 1,257,163 Sources: BISA, Statbel (National Register)
1
People of foreign nationality who do not own the Belgian nationality
Average age (number of years on 1 January) 37.7 38.6
Sources: BISA, FPB, Statbel (National Register and regional prospects, 2021) MAIN FOREIGN NATIONALITIES IN 2021 1
% of the total non-national population on 1 January
EVOLUTION OF THE POPULATION BY AGE GROUP
Number of inhabitants on 1 January 15.5 E
U 27 countries
France
23.6
1,400,000 Romania
Italy
1,200,000 Spain
10.3 Poland
1,000,000 Portugal
Bulgaria
800,000 2.0 Germany
2.1 Greece
600,000
Other EU 27
8.1 countries
400,000
7.9
200,000 Non-EU 27 countries
Morocco
6.8
0 Syria
2011 2012 2013 2014 2015 2016 2017 2018 2019 2020 2021 6.8
Turkey
2.2 4.9
Under 18 years 18-64 years 65 years and older 2.5 3.0 4.4 Rest of World
Sources: BISA, Statbel (National Register) Sources: BISA, Statbel (National Register)
1
People of foreign nationality who do not own the Belgian nationality
POPULATION PYRAMID: NUMBER OF MEN AND WOMEN IN 2021 AND 2070
MOVEMENTS OF POPULATION
95 years and + Men 2070
90-94 years Number 2020
85-89 years Women 2070
80-84 years Men 2021
75-79 years Natural balance 4,863
70-74 years Women 2021
Births 15,847
65-69 years
60-64 years Deaths 10,984
55-59 years
50-54 years Internal net migration -17,319
45-49 years
40-44 years Internal arrivals 23,585
35-39 years
30-34 years Internal departures 40,904
25-29 years
20-24 years International net migration 13,635
15-19 years
10-14 years International immigration1 42,748
5-9 years International emigration 2 29,113
0-4 years
60,000 50,000 40,000 30,000 20,000 10,000 0 10,000 20,000 30,000 40,000 50,000 60,000
Sources: BISA, Statbel (National Register)
Sources: BISA, FPB, Statbel (National Register and regional prospects, 2021) 1
Including register changes (in) and re-registrations after removal from register
2
Including register changes (out) and mandatory removals
8 9POPULATION LABOUR MARKET
PRIVATE HOUSEHOLDS BY SIZE BREAKDOWN OF THE WORKING AGE POPULATION IN 20201
Thousands of people and %
Number on 1 January 2021
One-person households (men) 131,309
One-person households (women) Working age population (15 to 64 years old): 819.7
128,786
M: 409.8
Two-person households 126,977 W: 409.8
Three-person households 68,473
Four-person households 57,027 Active population: 529.3 Inactive
M: 289.1 population: 290.4
Households of five persons and more 46,688 W: 240.2 M: 120.8
Total 559,260 W: 169.6
Working ILO
Average size of the private households population: 463.5 unemployed: 65.8
2.16
(number of persons per household) M: 254.1 M: 34.9
W: 209.4 W: 30.8
Sources: BISA, Statbel (National Register)
PRIVATE HOUSEHOLDS BY T YPE IN 2021 1
% of the private households on 1 January
3.7 Activity rate: 64.6 %
M: 70.5 %
11.6 46.2 W: 58.6 %
Employment rate: 56.5 %
Single adult (living alone) M: 62.0 %
Married without children W: 51.1 %
5.0
ILO unemployment rate: 12.4 %
Married with child(ren)
M: 12.1 %
Civil partner couple W: 12.8 %
5.5 without children
Source: Statbel (LFS)
Civil partner couple 1
Annual averages based on survey data and in accordance with the concepts of the ILO
with child(ren) (M = men, W = women)
Lone parent families
UNEMPLOYED JOB SEEKERS 1
Other types
18.7
2020
Men Women Total
Total number 46,756 42,047 88,803
9.2 Under 25 years 5,009 4,107 9,117
25-49 years 27,767 27,783 55,550
Sources: BISA, Statbel (National Register)
50 years and older 13,979 10,157 24,136
1
Civil partner couples are determined on the basis of an algorithm. More information
at https://ibsa.brussels
Belgian 30,659 27,451 58,110
EU 27 foreigner 6,690 7,560 14,250
WEDDINGS AND DIVORCES Non-EU 27 foreigner 9,407 7,036 16,442
Low level of diploma 2 11,233 7,468 18,701
Number of events 2020 Middle level of diploma 2 10,024 9,231 19,255
Weddings 3,325 High level of diploma 2 7,038 8,687 15,725
Foreign diploma without
Divorces 2,058 18,461 16,661 35,122
equivalence certificate
Source: Statbel (National Register) < 1 year of unemployment 17,990 16,931 34,921
1 to 2 years of unemployment 6,658 5,955 12,613
LEGAL COHABITATION > 2 years of unemployment 22,108 19,162 41,269
Number of events 2020 Source: Actiris
Legal cohabitation 2,790 1
Administrative data, annual average
Termination of legal cohabitation 1,283 2
Highest diploma obtained: low = maximum 2nd cycle of secondary education; middle = upper
secondary education; high = higher education and university
Source: Statbel (National Register)
10 11LABOUR MARKET LABOUR MARKET
EMPLOYMENT BY SECTOR 1 LABOUR MARKET SITUATION IN THE BCR IN 2020 1
Population aged 15 to 64 years (in thousands of people)
Number of workers, 2019
NACE Rev. 2 Employees Self-employed Total
Primary sector Region of Region
197 26 223 residence of work
(agriculture, forestry…)
Secondary sector 41,056 10,005 51,061
Mining and quarrying 92 0 92 Flemish
Region
Manufacturing 18,089 1,360 19,449
Electricity, gas, steam and air
3,724 0 3,724 Flemish
conditioning supply Region 232.1
Water supply; sewerage, waste
management and remediation 5,269 12 5,281
activities
Construction 13,882 8,633 22,515
Tertiary sector 588,795 74,702 663,497 52.5
Wholesale and retail trade; repair of
56,709 4,588 61,297
motor vehicles and motorcycles
Transportation and storage 38,371 1,296 39,667
Domestic employment of the BCR
Accommodation and food service
27,714 1,321 29,035
Brussels’ population
working in the BCR
activities
Brussels’ working
30,565 2,522 33,087 BCR
population
Information and communication
745.5
Financial and insurance activities
463.5
49,279 349 49,628
379.2
BCR
Real estate activities 5,964 599 6,563
Professional, scientific and technical
35,953 49,575 85,528
activities
Administrative and support service
58,865 2,989 61,854
activities
Public administration 119,991 0 119,991
Education 60,031 903 60,934
Human health and social work activities 65,366 7,183 72,549
Other 39,987 3,377 43,364 Walloon 134.3 Walloon
Total 630,048 84,733 714,781 Region
23.5 Region
8.4 Foreign
Source: NAI, BISA calculations countries
1
Statistics based on administrative data and in accordance with the employment concept in the
ESA 2010
Source: Statbel (LFS)
EVOLUTION OF SALARIED EMPLOYMENT BETWEEN 2019 AND 20201 1
Annual averages based on survey data and in accordance with the concepts of the ILO
EMPLOYMENT IN INTERNATIONAL INSTITUTIONS 1
Net
-2,933 2020
evolution Number of employees on 31 December
Men Women Total
European Institutions 16,489 21,7 7 1 38,260
Job -35,855 32,922 International Institutions 1,843 1,281 3,124
dynamics
Embassies and diplomatic staff 4,791 2,818 7,609
-40,000 -30,000 -20,000 -10,000 0 10,000 20,000 30,000 40,000 European Schools 223 383 606
Increase 2
Decrease 3 Total 23,346 26,253 49,599
Source: Dynam-Reg Source: BISA
1
Employment measured in number of jobs on the 30th of June
1
These employees include neither military staff nor local staff under Belgian contract (subject to
NSSO contributions)
2
Sum of new jobs created in BCR and existing job displacement to BCR
3
Sum of job destruction in BCR and existing job displacement to another region
12 13HOUSEHOLD INCOME AND EXPENDITURE HOUSEHOLD INCOME AND EXPENDITURE
HOUSEHOLD INCOME AND SAVING MEDIAN TAXABLE INCOME OF TAX RETURNS BY DISTRICT
IN 2018 1
Average disposable income per inhabitant, 2018 (euros) 19,363
Euros per tax return
Average household saving rate (gross), 2018 (%) 5.6
Average total net taxable income per inhabitant, 2019 (euros)1 14,973
Median total net taxable income of tax returns, 2019 (euros)1 20,427
< 18,000
Sources: NAI, Statbel (Fiscal statistics on income) 18,000 - 19,500
1
2020 financial year, 2019 income 19,500 - 22,000
22,000 - 24,000
AVERAGE EXPENDITURE PER HOUSEHOLD > 24,000
Not available
2020 BCR: 19,723
Euros %
Food, beverages and tobacco 5,803 18.1
Clothing and footwear 1,184 3.7
Housing 11,090 34.6
Rentals (actual and imputed);
8,944 27.9
maintenance and repair of the dwelling
Water, electricity, gas and other fuels;
2,146 6.7
other costs
Furnishings, household equipment and routine
1,606 5.0
household maintenance
Health 1,725 5.4
Transport 2,432 7.6
Communications 1,105 3.4
Culture, recreation and education 2,332 7.3
Restaurants, hotels and cafes 1,508 4.7
Miscellaneous goods and services 3,272 10.2
Total consumption 32,057 100.0
Sources: BISA, Statbel (Fiscal statistics on income)
Monitoring des Quartiers - BISA ©
Brussels UrbIS ®©
Source: Statbel (HBS) 1
2019 financial year, 2018 income
PRECARIT Y AND WELFARE BENEFITS COMPONENTS OF DISPOSABLE INCOME PER CAPITA IN 2021 1
Euros
Share of population below the at-risk-of-poverty threshold,
27.8
2020 income (%)1
Recipients of social integration income (18 to 64 years), Income from work²
40,556
2020 (number)2 Net property
Share of population aged 18-64, 2020 (%)2 5.2 income
Recipients of financial aid equivalent to social integration income Unemployment
3,803 allowances and
(18 to 64 years), 2020 (number)2 similar
Share of population aged 18-64, 2020 (%)2 0.5 Pensions and
similar
Recipients of increased reimbursement for healthcare (entitled
323,719 Family allowances
and dependent persons), January 2021 (number)3
Share of total population, January 2021 (%)3 26.5 Integration income
Recipients of Guaranteed income for elderly persons (GRAPA),
20,120 Other social
January 2021 (number) 4 benefits
Share of population of 65 years and older, January 2021 (%) 4 12.7 Levies and other
Private borrowers in default, December 2021 (number)5 41,284 current transfers²
Share of population of 18 years and older, December 2021 (%)5 4.4 -8,000 -6,000 -4,000 -2,000 0 2,000 4,000 6,000 8,000 10,000 12,000 14,000 16,000 18,000
1
Source: Statbel (EU-SILC); Risk of monetary poverty; confidence interval of 25.1 % to 30.5 % Primary income Social benefits
² Source: PPS Social integration (annual mean - provisional data) Levies and other current transfers
³ Sources: CBSS, National Register, BISA calculations Source: HERMREG, BISA calculations
4
Source: Federal Pensions Service, National Register, BISA calculations. The recipients of the 1
Estimate
guaranteed income from the previous system are included ² Net of employers' social contributions
5
Source: NBB (Central Individual Credit Register)
14 15RESEARCH AND TECHNOLOGY RESEARCH AND TECHNOLOGY
GROSS DOMESTIC EXPENDITURE ON R&D BY SECTOR OF PERFORMANCE EMPLOYMENT IN HIGH - AND MEDIUM - HIGH TECHNOLOGY
2019
SECTORS IN 2019 1
Million % % of total employment
euro of GDP
Business enterprise 1,296.6 1.50
Government 191.2 0.22
Higher education 470.6 0.54 BCR 0.9 4.5
Private non-profit sector 76.7 0.09
Total 2,035.1 2.35
Sources: Belspo, NAI, BISA calculations
Belgium 3.4 2.7
R&D PERSONNEL
2019
0 1 2 3 4 5 6 7
Total R&D personnel (FTE) 16,557
Share of researchers (% of total R&D personnel) 65.7 High and medium-high technology manufacturing sector
High-tech knowledge-intensive services
Source: Belspo, BISA calculations
Source: NAI, BISA calculations
R&D PERSONNEL (FTE) BROKEN DOWN BY SECTOR OF PERFORMANCE IN 2019 1
Based on the Eurostat definition and NACE Rev.2
(%)
EMPLOYEES IN THE ICT SECTOR 1
11.5 2019
Number of jobs on 31 December
48.0 Men Women Total
29.0 ICT manufacturing industries 14 9 23
Business enterprise
ICT trade 1,813 676 2,489
ICT services 16,795 7,277 24,072
Government
Total ICT sector 18,622 7,962 26,584
Higher education
Source: NSSO, BISA calculations
1
Based on the OECD definition (2007) and NACE Rev. 2
Private non-profit
sector HOUSEHOLDS USING A MOBILE BROADBAND CONNECTION AT
11.5
HOME : 2014 - 2020
Source: Belspo, BISA calculations % of total number of households with at least one person aged 16 to 74 years
EVOLUTION OF THE GOVERNMENT BUDGET APPROPRIATIONS OR 60
OUTLAYS FOR R&D OF THE BCR 50.5
Million euro 50
40 38.0
60 35.0
55 30.6
50 30
22.3 23.7
45 20.6
40 20 15.7
11.4
35
10
30
25
0
20 2014 2017 2020
15
10 Brussels-Capital Region Flemish Region
5 Walloon Region
0
2010 2011 2012 2013 2014 2015 2016 2017 2018 2019 2020 1 Source: Statbel (Survey on ICT usage by households and individuals)
Source: Belspo
1
Based on initial budget data
16 17ECONOMY ECONOMY
MACROECONOMIC INDICATORS REGIONS’ SHARE OF BELGIAN POPULATION AND GDP IN 2019
% of total for Belgium
2019
GDP (million euro) 86,651
GDP per capita (euros) 71,412
Population 10.6 57.7 31.8
Compensation of employees (million euro) 43,504
Value added per worker (euros) 108,193
GDP 18.2 58.6 23.1
Source: NAI, BISA calculations
VALUE ADDED PER SECTOR 0 10 20 30 40 50 60 70 80 90 100
2019 Brussels-Capital Region Flemish Region
NACE Rev. 2 Walloon Region
Million Share
euro in % Source: NAI, BISA calculations
Primary sector
22.0 0.0 FOREIGN TRADE IN GOODS AND SERVICES IN 2019 1
(agriculture, forestry…)
Million euro
Secondary sector 5,353.9 6.9
Mining and quarrying 14.7 0.0
Manufacturing industry 2,018.9 2.6
Exports 25,487 29,542
Electricity, gas, steam and air conditioning
918.4 1.2
supply
Water supply; sewerage, waste management
480.0 0.6 Imports 38,407 26,595
and remediation activities
Construction 1,921.9 2.5
0 10,000 20,000 30,000 40,000 50,000 60,000 70,000
Tertiary sector 71,958.4 93.0
Wholesale and retail trade; Goods Services
6,210.3 8.0
repair of motor vehicles and motorcycles Source: NAI
Transportation and storage 4,455.7 5.8 1
Regional distribution of Belgian imports and exports of goods and services according to
Accommodation and food service activities 1,646.2 2.1 the regional accounts
Information and communication 6,007.0 7.8
Financial and insurance activities 15,452.7 20.0 EVOLUTION OF THE PRODUCTIVIT Y PER CAPITA IN VOLUME
Real estate activities 5,602.0 7.2 PER SECTOR AND REGION 1
Professional, scientific and technical
7,881.3 10.2
activities 120,000
Administrative and support service activities 3,833.0 5.0 110,000
Public administration 10,009.9 12.9 100,000 2019
Education 4,504.8 5.8 90,000 2009
Human health and social work activities 3,753.2 4.9 80,000
Other 2,602.3 3.4 70,000
Total 77,334.3 100.0 60,000
50,000
Source: NAI, BISA calculations 40,000
30,000
20,000
10,000
0
BCR
BCR
BCR
Flemish
Region
Walloon
Region
Flemish
Region
Walloon
Region
Flemish
Region
Walloon
Region
Manufacturing Market
Total
industry services
Source: HERMREG
1
Value added per worker in chained euros, reference year 2015
18 19ECONOMY PUBLIC FINANCES
ENTERPRISES 1 BCR RECEIPTS, EXPENDITURE AND OVERALL BALANCE 1
2020 2020
Number Natural Legal
Total Million Share
person person euro in %
Active enterprises (at the end of the year) 37,575 75,619 113,194 Total of the receipts of the BCR 4,940 100
Enterprise births 5,168 6,018 11,186 Fiscal and parafiscal receipts 2,549 52
Enterprise deaths 3,689 4,200 7,889 Direct taxes to households 1,057 21
Enterprise immigrations 848 1,080 1,928 Indirect taxes 1,042 21
Enterprise emigrations 1,318 1,506 2,824 Taxes on capital
449 9
(endowment and inheritance tax)
Source: Statbel Non-fiscal and non-parafiscal receipts 711 14
1
VAT-registered businesses; localisation according to head office Transfers coming from other government 1,681 34
Current transfers of fiscal receipts 1,035 21
BREAKDOWN OF ENTERPRISES BY NUMBER OF WORKERS IN 20201 Non-fiscal current transfers
645 13
% of total number of enterprises and capital transfers
Total of the expenditure of the BCR 6,218 100
2.8 1.0 Current expenditure excluding interest charges 5,161 83
Compensation of employees 1,489 24
15.7 Intermediate consumption and paid taxes 820 13
0 Social benefits and subsidies 968 16
Current transfers 1,884 30
1 to 9 Interest charges 103 2
Capital expenditure 953 15
10 to 49
Overall balance of the BCR 2 -1,278
50 and +
Source: NAI
1
According to the framework of the ESA 2010. In this framework, the BCR is composed of the BRPS
and the autonomous administrative authorities which depend on it.
2
The overall balance equals the difference between the receipts and the expenditure. A positive
80.5
balance indicates net lending while a negative balance shows net borrowing.
BREAKDOWN OF THE TOTAL BCR SPENDING
BY FUNCTION IN 20201 (%)
Source: Statbel
1
VAT-registered businesses. For enterprises established in several regions, all the 4 1 Economic affairs
employment is allocated to the head office 6 20 conomy, trade and
E
BANKRUPTCIES AND RELATED JOB LOSSES employment
7 Transports (road and
6.000
6,000 public transport networks,
road safety, port of
5.000
5,000 Brussels…)
9
O ther economic affairs
4.000
4,000 General public services
(of which support to local
3.000
3,000 authorities)
21 Environmental protection
2.000
2,000
Social protection
1.000
1,000 ousing and community
H
31 1 amenities
0 P ublic order and safety
2011 2012 2013 2014 2015 2016 2017 2018 2019 2020 2021
O
ther
Bankruptcies Job losses
Source: NAI
Source: Statbel 1
According to the framework of the ESA 2010. In this framework, the BCR is composed of the BRPS
and the autonomous administrative authorities which depend on it.
20 21POLITICAL INSTITUTIONS EDUCATION AND EARLY CHILDCARE
COMPETENCIES OF THE BCR CHILDCARE FACILITIES FOR YOUNG CHILDREN
Land-use planning (plans, planning permission, urban renewal, real estate policy, 2020
monuments and sites) On 31 December Number Number
Animal welfare
of facilities of places
Economy, foreign trade and development cooperation
Employment By authorising organisation
Energy ONE 493 14,282
Environment, water and nature conservation policy Kind en Gezin 204 6,705
Taxation, finances and budget By type of care
Civil service, equal opportunities policy
Family 127 804
Sport facilities
Housing Collective 568 20,111
Fire-fighting and emergency medical assistance Total 1 695 20,915
Urban Policy
Local authorities and subsidiary authorities Sources: BISA, Kind en Gezin, ONE
(municipalities, intermunicipality organisations...) 1
The total number of facilities and places differs from the sum by authorising organisation since 2
Environmental maintenance, waste collection and treatment facilities, representing 72 places, are authorised by both ONE and Kind en Gezin
Scientific research
External relations
SCHOOL POPULATION IN THE FRENCH - SPEAKING AND
Safety and prevention
DUTCH - SPEAKING EDUCATION SYSTEMS
Regional statistics
Tourism
2019-2020
Transport and mobility
Number of pupils or students French- Dutch-
Public works
speaking speaking
Sources: BRPS, Parliament of the BCR Kindergarten 43,075 14,290
Primary 80,451 19,866
COMPOSITION OF THE PARLIAMENT OF THE BCR Secondary 85,074 16,321
Number of seats Non-university higher education 33,580 19,525
University (principal registrations)1 37,540 19,217
French-speaking elected representatives 72
Dutch-speaking elected representatives 17
Sources: BISA, Fédération Wallonie-Bruxelles, Flemish Community, Fondation Universitaire
Total 89 1
2015-2016
Source: Parliament of the BCR
HIGHEST DIPLOMA OBTAINED BY GENDER IN 2020
BREAKDOWN OF NUMBER OF SEATS IN THE PARLIAMENT OF THE BCR1 % of the population aged 25 and over
French-speaking
CD&V, 1 PVDA,1 political parties
Agora, 1 Vlaams Belang,1 PS
Open VLD, 3 Independent, 2
Ecolo Femmes
Women
one.brussels-sp.a, 3 31.0 22.8 46.2
MR
N-VA, 3 PS, 16
DéFi
Groen, 4 PTB
cdH
cdH, 5
Independent
Hommes
Men 29.3 24.9 45.8
Dutch-speaking
Ecolo, 15 political parties
PTB, 10 Groen
N-VA 0 10 20 30 40 50 60 70 80 90 100
one.brussels-sp.a
Open VLD Low (maximum lower secondary education)
DéFi, 10 MR, 14
Agora Middle (upper secondary education)
CD&V High (non-university higher education and university)
PVDA
Source: Parliament of the BCR
Source: Statbel (LFS)
1
Situation on 30 September 2021
Vlaams Belang
22 23HEALTH HEALTH
DEMOGRAPHICS ACCOMODATION SERVICES FOR THE ELDERLY
Men Women 2021
Average age On 1 January Number Number
36.5 38.7
(number of years on 1 January 2021) of institutions of beds
Life expectancy at birth Rest homes and nursing homes 146 16,400
76.9 82.2
(number of years in 2020) Public sector 27 3,575
Births (number in 2020) 8,189 7,658 Non-profit private sector 27 2,941
Deaths (number in 2020) 5,278 5,706 Commercial private sector 92 9,884
Sources: BISA, Statbel (National Register)
Source: Infor-Homes Bruxelles
CAUSES OF DEATH IN 2018
% of number of deaths DAILY SMOKERS
Cardiovascular % of the population aged 15 and older
diseases
Tumours
35
30.6 30.1
Respiratory
diseases 30
Unnatural 25 23.7 23.1 22.6
deaths
Digestive 20 18.2
disorders
14.0
15
Other 11.0
10
0 5 10 15 20 25 30 35
5
Women Men
Source: Statbel
0
1997 2004 2013 2018
PRACTITIONERS OF A MEDICAL PROFESSION
2021 Women Men
Based on place of residence Number Density
Source: Sciensano (Health Interview Surveys)
on 1 January (per 10.000
inhabitants)
OVERWEIGHT AND OBESIT Y
Doctors 6,364 52
Pharmacists 1,961 16 % of the population aged 18 and over
Dentists 1,196 10
Nurses 9,926 81
Physiotherapists 3,051 25 33.0
2008
Nursing auxiliaries 6,424 53 47.1
OVERWEIGHT
Midwives 817 7
(BMI ≥ 25)
42.3
Source: FPS Public Health 2018
50.8
HOSPITAL SERVICES
11.9
2008
On 1 January 2021 13.6
OBESITY
Number of hospitals1 23 (BMI ≥ 30)
Private 18 14.5
2018
13.3
Public 5
Total number of beds² 8,355 0 10 20 30 40 50 60
Source: FPS Public Health
Women Men
1
Number of main sites
2
Sum of beds in all sites in the Brussels-Capital Region
Source: Sciensano (Health Interview Surveys)
24 25LAND USE PLANNING AND REAL ESTATE
POPULATION, AREA AND DENSIT Y BY MUNICIPALIT Y LAND OCCUPATION ACCORDING TO THE LAND REGISTER
2021 Area in ha on 1 January 2021
On 1 January Population Area Density Non built-up parcels 5,094
(inhabitants) (km²) (inhab./km²) Built-up parcels 7,779
Anderlecht 121,929 17.9 6,806 Not surveyed 3,369
Auderghem 34,723 9.0 3,873 Total 16,242
Berchem-Sainte-Agathe 25,441 3.0 8,624
Sources: FPS Finance - GAPD, Statbel
Bruxelles 186,916 33.1 5,649
Etterbeek 48,331 3.2 15,226 MEDIAN PROPERT Y PRICES BY T YPE
Evere 43,061 5.1 8,402
Forest 56,281 6.3 8,945 Euros per sale (new build not included) 2020
Ganshoren 25,189 2.4 10,333 Houses (terraced + semi-detached) 435,000
Ixelles 87,488 6.4 13,646 Houses (detached) 960,000
Jette 52,854 5.2 10,185 Apartments 228,000
Koekelberg 21,873 1.2 18,506
Molenbeek-Saint-Jean 98,112 6.0 16,310 Sources: FPS Finance - GAPD (September 2021 version), Statbel
Saint-Gilles 49,196 2.5 19,416
PROPERTIES SOLD BY T YPE IN 2020
Saint-Josse-Ten-Noode 27,124 1.2 23,371
% of the total number of properties sold (new build not included)
Schaerbeek 131,451 7.9 16,637
Uccle 84,774 22.9 3,706
Watermael-Boitsfort 25,221 13.0 1,945
Woluwe-Saint-Lambert 58,010 7.3 7,954 18.6 1.5 80.0
Woluwe-Saint-Pierre 41,996 8.9 4,695
Total BCR 1,219,970 162.4 7,511 0 10 20 30 40 50 60 70 80 90 100
Houses (terraced + semi-detached) Houses (detached) Apartments
Sources: BISA, FPS Finance - GAPD, Statbel (National Register)
Sources: FPS Finance - GAPD (September 2021 version), Statbel
POPULATION DENSITY BY DISTRICT ON 1 JANUARY 2021 BUILDINGS BY T YPE
Number of inhabitants per km²
Cadastral nature (situation on 1 January) 2021
Terraced 105,265
< 4,000 Semi-detached 15,578
4,000 - 8,000 Detached 5,821
8,000 - 13,000 Apartment buildings 38,312
13,000 - 18,000 Merchant houses 15,346
> 18,000
Other buildings 14,548
Not available
Total number of buildings (land register) 194,870
Total number of housing units (land register) 592,942
Number of social housing (31/12/2020) 40,089
Sources : SLRB, SPF Finances - AGDP, Statbel
OFFICE VACANCY RATE 1 (%)
12
10
8
6
4
2
0
2010 2011 2012 2013 2014 2015 2016 2018 2020
Centre BCR (Pentagone): 190,395 m² vacant in 2020
Rest of the BCR: 788,029 m² vacant in 2020
Sources: BISA, FPS Finance - GAPD, Statbel (National Register) Total BCR: 978,424 m² vacant in 2020
Sources: citydev.brussels, perspective.brussels (Office Property Observatory)
Monitoring des Quartiers - BISA ©
Brussels UrbIS ®©
1
Missing years 2017 and 2019
26 27ENVIRONMENT AND ENERGY ENVIRONMENT AND ENERGY
FINAL ENERGY CONSUMPTION WASTE COLLECTED BY BRUXELLES - PROPRETÉ
2019 Metric tons 2020
GWh Share in %
Unsorted domestic and commercial waste 295,616
By sector
Selective collections 156,454
Industry 635 3
Tertiary 6,951 37 Paper/cardboard 48,072
Housing 6,872 36 PMC packaging 15,096
Transport 4,143 22 Glass 27,224
Non-energy purposes 291 2 Biodegradable waste1 22,301
By vector Other 2 43,761
Natural gas 8,304 44 Total 452,070
Electricity 5,221 28
Oil products 4,864 26 Source: Bruxelles-Propreté
Other1 503 3 1
Green waste, food waste and mixed green/food waste
Total energy consumption 18,891 100 2
Mainly bulky waste, wood, metal, chemical and electronic products, etc.
Source: Brussels Environment (Energy audit of the BCR) ANNUAL MEAN TEMPERATURE IN UCCLE
1
Including biofuels
Deviation from the climate normals 1991-2020 (°C)
CONSUMPTION OF TAP WATER 1
1.5
1,5
70 70 1.0
1,0
Consumption per inhabitant (m³/inhabitant)
60 60 0.5
Total consumption (millions of m³)
0,5
50 50 0.0
0,0
40 40 -0.5
-0,5
30 30 -1.0
-1,0
20 20 -1.5
-1,5
10 10 -2.0
-2,0
0 2010 2011 2012 2013 2014 2015 2016 2017 2018 2019 2020 0 -2.5
-2,5
1981 1984 1987 1990 1993 1996 1999 2002 2005 2008 2011 2014 2017 2020
Total consumption Consumption per inhabitant
Source: Royal Meteorological Institute
Sources: Statbel, Vivaqua, BISA calculations
1
Consumption billed to muncipalities, excluding special contracts and itinerant worksites
AIR QUALIT Y: CONCENTRATIONS IN FINE PARTICULATE
GREEN SPACES 1 MATTER (PM2,5)
Evolution of annual means in Uccle and Molenbeek (µg/m³)
2021
Type of zone Area Portion of total
(ha) area of the BCR 30
(%) EU authorised limit value
25
Forest zones 1,680 10.3
20
Park zones (including Royal Domain) 1,100 6.8
Outdoor sports or recreational zones 336 2.1 15
Green zones 304 1.9 10
Agricultural zones 228 1.4 WHO recommended limit value
Green zones of high biological value 179 1.1 5
Cemetery zones 152 0.9 0
Total 3,979 24.5 2010 2011 2012 2013 2014 2015 2016 2017 2018 2019 2020
Source: perspective.brussels Station of Molenbeek Station of Uccle
1
According to the Regional Zoning Plan
Source: Brussels Environnement
28 29MOBILITY AND TRANSPORT MOBILITY AND TRANSPORT
VEHICLE FLEET EVOLUTION OF THE AVERAGE NUMBER OF CYCLISTS PER CROSSROAD1
Number on 1 August 2021 400
Cars 493,994 350
Trucks, vans, tankers 83,115 300
Motorcycles 35,424 250
Buses and coaches 2,109 200
Other (tractors, special vehicles…) 24,428 150
Total 639,070 100
50
Source: Statbel 0
2010 2011 2012 2013 2014 2015 2016 2017 2018 2019 2020
SHARE OF HOUSEHOLDS WITHOUT A CAR Source: Brussels Mobility (Bicycle Observatory of the BCR - Pro Velo asbl)
1
26 counting points, on a Tuesday or Thursday during the peak hour (8-9 am) in January, May,
% 2019 September and November
Brussels-Capital Region 53 NEW CARS ADMITTED TO TRAFFIC BY FUEL TYPE
Flemish Region 23
Walloon Region 25 2012 2020
Number % Number %
Belgium 27
Diesel 63,536 76.1 18,338 31.3
Source: Statbel Gasoline 19,057 22.8 26,461 45.1
Electric 147 0.2 2,076 3.5
EVOLUTION OF THE NUMBER OF JOURNEYS ON THE STIB Hybrid 1 681 0.8 11,311 19.3
PUBLIC TRANSPORT NETWORK Natural gas 8 0.0 446 0.8
Millions Other 10 0.0 40 0.1
Total 83,439 100.0 58,672 100.0
450 Source : Statbel
400 1
Hybrid = gasoline-electric of diesel-electric
350
300 DISTRIBUTION OF KILOMETERS TRAVELLED BY TRUCKS (> 3,5 TONS) ON
250 THE ENTIRE BRUSSELS ROAD NETWORK BY EURO NORM
200 Milions of km
150
100 2.4
50
0
2010 2011 2012 2013 2014 2015 2016 2017 2018 20191 2020 2017 6.9 6.5 24.7 19.7
Metro Tram Bus
Source: STIB 0.8 1.5 2.4
1
Break in time series
BREAKDOWN OF TRAVEL MODES OF PEOPLE COMMUTING TO WORK1 2021 12.2 43.0
% of number of commuting journeys
2.6
1.2 3.9 0 10 20 30 40 50 60 70
2005 45.1 32.2 15.0 Euro 0 to 2 Euro 3 Euro 4 Euro 5 Euro 6
3.5 Source: Viapass
4.4 2.8
2017 36.2 34.0 19.1 ROAD ACCIDENTS INVOLVING DEATH AND INJURY
Number 2020
0 10 20 30 40 50 60 70 80 90 100
With deaths (within 30 days) 14
Car Train MTB Cycling Walking Other 2 With serious injuries 152
Source: FPS Mobility and Transport (Diagnosis home to work travel) With minor injuries 3,051
1
Main mode of travel (the one used over the longest distance) for employees working in a company
Total 3,217
located in the BCR with more than 100 employees
2
Other = carpooling, motorcycle or collective transport organised by the employer
Source: Statbel
30
30 31TOURISM AND CULTURE TOURISM AND CULTURE
TOURIST ACCOMMODATIONS TOP 15 MUSEUMS AND ATTRACTIONS IN 2020
2020 250,000-275,000 visitors
Number Number Number Royal Museums of Fine Arts1
of of of 150,000-200,000 visitors
establishments rooms bed-places
Natural Sciences Museum
Hotels and similar BOZAR
191 18,082 38,217
establishments Atomium
Youth accommodation 9 453 1,520 50,000-100,000 visitors
Bed and Breakfast 129 217 450
Train World
Source: Statbel Comics Art Museum
Mini-Europe
NUMBER OF OVERNIGHT STAYS IN HOTELS AND SIMILAR Parlamentarium
ESTABLISHMENTS Autoworld
25,000-50,000 visitors
By trip purpose 2020
Choco Story Brussels
Overnight stays for leisure 846,663 Cinquantenaire Museum
Conferences - Conventions - Seminars 557,241 House of European History
Other professional reasons 283,17 1 European Parliament hemicycle
Total 1,687,075 Musical Instruments Museum
MIMA
Source: Statbel
Source: visit.brussels (Brussels Tourism Observatory)
TOP 5 OVERNIGHT STAYS IN HOTELS AND SIMILAR 1
Includes the museums Magritte, Fin-de-Siècle, Old Masters, Modern, Meunier and Wiertz
ESTABLISHMENTS
BAROMETER OF MUSEUMS AND ATTRACTIONS 1
By country of residence of the visitors 2020 Number of visitors
Belgium 468,122
France 271,383 600,000
Germany 115,684
United Kingdom 95,941 500,000
Spain 87,385
400,000
Source: Statbel
EVOLUTION OF THE NUMBER OF PASSENGERS AT AIRPORTS 300,000
Millions
200,000
35
30 100,000
25 0
Jan Feb Mar Apr May Jun Jul Aug Sep Oct Nov Dec
20
2019 2020 2021
15 Source: visit.brussels (Brussels Tourism Observatory)
1
Based on constant scope
10
5
0
2010 2011 2012 2013 2014 2015 2016 2017 2018 2019 2020
Brussels South (Charleroi) Brussels Airport (Zaventem)
Sources: Brussels Airport, Brussels South Charleroi Airport
32 33ABBREVIATIONS DEFINITIONS
Activity rate: Proportion of the active population (working
BCR Brussels-Capital Region population and unemployed population) in the working age
population (15 to 64 years).
Belspo Belgian Federal Science Policy
Chained euros: Way to measure the change in volume after
BISA Brussels Institute for Statistics and Analysis removing the effects of the price changes for the calculation of
BMI Body Mass Index various economic aggregates (source: NBB).
BRPS Brussels Regional Public Service Employment rate: Resident working population as a percentage
of working age population (15 to 64 years).
CBSS Crossroads Bank for Social Security
Enterprise births: Number of enterprises that are VAT registered
ESA European system of national and regional accounts on 31 December, whereas the year before, on the same date, they
EU European Union were not.
FPB Federal Planning Bureau Enterprise deaths: Number of enterprises that are no longer VAT
registered on 31 December, whereas the year before, on the same
FPS Federal Public Service date, they were.
FTE Full-time equivalent Enterprise emigrations: change of location of VAT-registered
GAPD General Administration of Patrimonial Documentation enterprises from the BCR to other Belgian Regions (on 31
December of two successive years).
GDP Gross Domestic Product
Enterprise immigrations: change of location of VAT-registered
GWh Gigawatt-hours enterprises from other Belgian Regions to the BCR (on 31
HBS Household Budget Survey December of two successive years).
Fertility rate: Number of children that would be born to a woman
HSO Brussels-Capital Health and Social Observatory
over her lifetime if she was to experience the age-specific fertility
ICT Information and communications technologies rates recorded for the year under consideration (total fertility
ILO International Labour Office rate).
HERMREG: Multi-sectoral macroeconometric model offering
LFS Labour Force Survey
medium term projections of the different aggregates at Belgian
MTB Metro, tram or bus regional level.
Latest version of the Statistical Classification ILO unemployed: Economically active persons who are without
NACE Rev. 2
of Economic Activities in the European Community work, available for work and actively seeking employment.
NAI National Accounts Institute ILO unemployment rate: Proportion of ILO unemployed persons
NBB National Bank of Belgium in the economically-active population (working population and
unemployed persons) aged 15 to 64 years.
NSSO National Social Security Office
Internal net migration: Difference between the total number of
Organisation for Economic Co-operation and
OECD internal arrivals (from other Belgian Regions to the BCR) and the
Development
number of total internal departures (from the BCR to other Belgian
ONE Office de la Naissance et de l’Enfance Regions).
PM Particulate Matter International net migration: Difference between the total number
PMC Plastic, Metal and beverage Cartons of international immigrations and the total number of
international emigrations.
PPS Public Planning Service
Natural balance: Difference between the number of births and
R&D Research and Development number of deaths recorded over a given period.
SILC Survey on Income and Living Conditions Office vacancy rate: Surface of built offices that are for rent or
SLRB Société du logement de la Région bruxelloise sale on the office market, in relation to the total surface area of
the existing office park.
STIB Société des Transports Intercommunaux de Bruxelles
Private household: Group of people habitually living together
VAT Value Added Tax in the same dwelling, who has no collective character (monastic
WHO World Health Organization communities, retirement and nursing homes, prisons…).
Unemployed job seeker: Person without paid employment
μg/m³ Micrograms per Cubic Metre
registered as a job seeker with a public employment service.
34 35Within perspective.brussels, the Brussels Institute for
Statistics and Analysis (BISA) centralises and disseminates
statistics on the Brussels-Capital Region. The BISA also
carries out socioeconomic studies and public policies
evaluations on Brussels-related issues.
Would you like
to know more?
Do you have questions
about the data?
• Go to the BISA website
https://ibsa.brussels
• Subscribe to the newsletter
• Visit the Monitoring des Quartiers website
https://monitoringdesquartiers.brussels
Rue de Namur 59 / B-1000 Bruxelles
T. 02/435.42.30 / bisa@perspective.brussels
36You can also read