Mining in AfricA towards 2020 - kpmgafrica.com - Foresight For Development
←
→
Page content transcription
If your browser does not render page correctly, please read the page content below
Mining in
   Africa
towards
    2020
   kpmgafrica.com
CONTENTS
BACKGROUND & INTRODUCTION					                   2

AFRICAN MINING TODAY						 3

Regions & Key Commodities						                  3

Chinese Demand & Investment					                 4

Rising Resource Nationalism						 4

AFRICAN MINING TOMORROW – OUTLOOK TOWARDS 2020   7

Future Demand from Key Trading Partners				      7

Geographical Bright Spots						 8

CONCLUSIONS							12

SOURCES OF INFORMATION					14

CONTACT DETAILS							14
FULL SECTOR REPORT | 1
2 | FULL SECTOR REPORT

BACKGROUND AND INTRODUCTION                                        As rewarding as the continent’s mining riches have been
                                                                   over the past centuries, the future could be even brighter.
The African continent is richly endowed with mineral
                                                                   “The true extent of Africa’s vast wealth of resources is hard
resources – this cannot be disputed. The US Geological
                                                                   to guess. Geologists have picked over most of the rest of
Survey (USGS) ranks Africa as the largest or second-largest
                                                                   the globe in search of minerals, yet huge swathes of Africa
reserve worldwide for bauxite (the main source of aluminium),
                                                                   remain largely unprobed. But the immense ore deposits so
cobalt (used to make alloys and batteries), industrial diamonds
                                                                   far discovered and soaring commodity prices on the back
(needed to cut hard materials), manganese (the anticorrosive
                                                                   of rip-roaring Chinese demand have convinced the world’s
element in steel), phosphate rock (a key ingredient in
                                                                   miners that the continent is the next big frontier,” wrote The
fertilisers), platinum group metals (a primary component
                                                                   Economist in February 2012. There are only a few countries
in automotive catalytic convertors), soda ash (an element
                                                                   on the continent that do not have some form of mineral
in glass production), vermiculite (a component in fireproof
                                                                   resources that could be exploited. Out of the 54 African
materials) and zirconium (used to manufacture heat-resistant
                                                                   sovereign states (including islands) recorded by the United
ceramic materials). All of these products except for fertilizers
                                                                   Nations (UN), the Central Intelligence Agency (CIA) lists 46
are found in everyday life within the automobiles we use to
                                                                   as having mineral resources of “commercial importance” –
travel from point A to point B. And in an eco-conscious world
                                                                   see the last two pages of this document for a list of African
where renewable materials are becoming more important,
                                                                   countries’ mineral resources. The organisation adds that
many new automobiles have an increasing volume of plant-
                                                                   mineral products in its list are recorded “only if they make a
based materials in them, so phosphate rock is as important
                                                                   significant contribution to the economy, or are likely to do so
to the cars being manufactured today as the other minerals
                                                                   in the future”.
found on the continent. This is an illustration of how world
citizens are directly and indirectly linked to the fortunes of
the African mining sector. But the application of its metal and
mineral produce goes much further than just automobiles;
other examples include smartphones, modern sports
equipment and beverage cans.
However, looking back to before these rather modern
products became reliant on African minerals; the continent
has a history of acting as a feedstock for the world’s
mineral hunger. British, Belgian and Portuguese colonies
produced precious metals and gems since the early 1800s
while the majority of private foreign capital invested on the
continent between 1870 and the Second World War was
channelled to mining. “A wide range of African metallic
and non-metallic ores played a vital – and in some cases an
indispensable – role in the Allied victory in 1945,” wrote
Raymond Dumett in a 1985 edition of the Journal of African
History. Admittedly, even though the post-colonial period led
to an increase in interest from non-colonial powers to mine
Africa’s resources, by the early 1990s the continent was still
only receiving some 5% of global exploration and mining
development expenditure. A concerted effort by the World
Bank to understand the shortcomings of African territories                    Precious metals
in the eyes of both junior and major miners revealed a need
for infrastructure, stable legal systems, a predictable fiscal                Diamonds
regime, profit repatriation guarantees, and access to foreign
exchange. The remarkable changes that took Africa from                        Copper
“the hopeless continent” in 2000 to the one where the “sun
shines bright” in 2011 (both headlines from The Economist)             Sources: US Geological Survey, NKC Research
resulted in the continent receiving 15% of global exploration
expenditure and mining investment during 2012.
FULL SECTOR REPORT | 3

AFRICAN MINING TODAY                                                  has also identified a lack of resource benefits transferred
                                                                      to Africans due to corruption, weak regulation and judicial
Regions & Key Commodities
                                                                      frameworks, and unaccountable bureaucracies. But the
                  Top 10 African Mineral Exporters (2011)             fact remains that mining along with hydrocarbons are the
              SA = 20.75                                              backbone of Southern Africa’s economies. And given the
       6.00
                                                                      economic trajectory envisioned for these countries over the
                                   Sources: Trade Map, NKC Research
       5.00                                                           next decade, this feature will not change any time soon.
       4.00                                                           East Africa is less dependent on mineral exports than most
       3.00                                                           other regions on the continent and more reliant on tourism
S'bn

                                                                      and agricultural output – tea, coffee and horticulture in
       2.00
                                                                      particular – for economic activity and employment. Still, the
       1.00                                                           East African Community (EAC) has several mineral belts
       0.00                                                           that produce (amongst other commodities) tanzanite and
                                                                      gold. The latter is the region’s biggest mining resource with
                                                                      Tanzania being the largest regional miner of the yellow metal
                                                                      at present, while exploration has also been conducted in the
                                                                      country for nickel and uranium. Gold reserves in the country
The mining and quarrying of some 60 mineral products                  are estimated to be over 30 million ounces, with only a small
currently represents around 20% of Africa’s economic                  part of it currently being mined. These reserves equate
activity, while minerals are the continent’s second-largest           to nearly 850 tonnes of gold, which at current production
export category – worth 10% of the continent’s total exports          levels imply a lifespan of over 20 years left for gold mining
– only exceeded by hydrocarbons. More than 80% by value               bar any significant new discoveries. Burundi also has some
of these mineral commodities originate in just five countries:        gold reserves along with copper, cobalt, nickel and uranium
platinum leader South Africa; diamond-rich Botswana; as well          deposits, though commercial extraction is also focussed on
as gold producers Ghana, Burkina Faso and Tanzania. The               gold. Exploration activity in western Kenya has increased
African continent contributed 6.5% of the world’s mineral             significantly over the past few years, with The East African
exports during 2011 from mining 20% of the world’s land               writing in November 2011 that a “gold rush” is expected in
area. From a regional perspective, members of the Southern            the country within the next decade. Furthermore, Kenya’s
African Development Community (SADC) produce two-                     first ever large-scale mine – the Kwale mineral sands project –
thirds of Africa’s mineral exports by value. The biggest player       will commence production later this year.
in the region is South Africa (the continent’s largest economy        Central and West Africa is increasingly being seen as boom
at present) who has almost all the commodities essential              areas for iron ore exploration and mining. Historians will point
for international competition except crude oil and bauxite.           to the fact that current and short-term future activity is on
Together with its northern neighbour Zimbabwe, these two              such a scale that it reminds of colonial-era scurrying to exploit
economies hold the majority of the world’s platinum group             the region’s minerals. Back then, as now, the area is seeing
metals (PGMs) reserves. To the west of Zimbabwe is the                a significant increase in railway construction in order to ferry
diamond-rich Botswana – who is the world’s largest producer           ore from the hinterland to ports – some of which will also be
by value of these precious stones – and to its north Angola.          built from scratch. This revival in rail transport options has
Other key mineral producers in the region are Namibia                 led to the opening of mines in Guinea, Liberia, Sierra Leone
(uranium), Zambia (copper) and the Democratic Republic of             and elsewhere. JPMorgan Chase & Co estimates that some
the Congo (copper and cobalt).                                        4,900 km in new railways are being constructed while up to a
The Bench Marks Foundation argues that mining is a curse on           dozen ports will be built in West Africa over the next decade.
SADC due to a lack of management capacity at community,               Ironically, the boom seen in the mineral sector comes off
corporate and government levels to deal with the adverse              a relatively low base and is associated with a small mining
effects of mineral extraction on the environment. More                sector. The Economic Community of West African States
worryingly, there is a strong view that the region did not            (ECOWAS) exported around $150bn worth of goods during
benefit to its potential from the commodity boom seen                 2011 of which three-quarters were petroleum and crude oil,
during most of the 2000s. An investigation by the Financial           with only 5% of export receipts generated by minerals (gold
Times revealed several negative factors which held back               and diamonds in particular). The biggest challenges faced by
the countries’ mining sectors including increasing resource           the burgeoning mining sector is country-specific political risk
nationalism (discussed below), transport infrastructure               (e.g. in Gabon and Guinea) and the opinion of some iron ore
shortcomings, the deepening of established mines (some                majors that mines in Australia and South Africa – who carry
decades old), labour challenges, and political risk. At a             less political risk – can satisfy the world’s appetite for iron.
grassroots level, Southern African Resource Watch (SARW)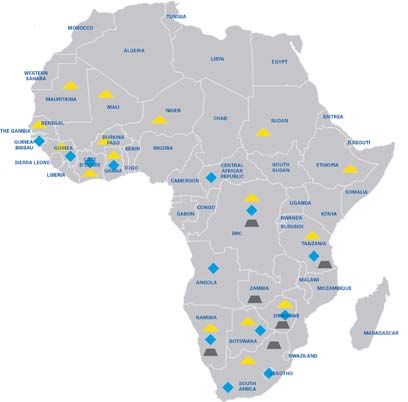
4 | FULL SECTOR REPORT

                  Phosphate Rock ($/tonne)                         is safe to say that most are centred on the SADC region.
500.00                                                             The frank questions being asked today is whether China is
                                             Source: World Bank
450.00                                                             recolonising Africa; whether it is extracting natural resources
400.00
                                                                   for personal gain without contributing to the betterment of
                                                                   African communities? There is concern that some African
350.00
                                                                   governments give a free pass to Chinese companies and
300.00
                                                                   SOEs to mine minerals, export them without beneficiation,
250.00                                                             and then pack up and leave when the mines are exhausted.
200.00                                                             They also bring their own skilled and semi-skilled workers
150.00                                                             that are sometimes left behind when mines are shut. This
100.00                                                             picture is certainly not pretty, so why do African governments
 50.00                                                             welcome Chinese mining with open arms?
  0.00                                                             The answer is not simple but often revolves around some
     Jan-06 Jan-07 Jan-08 Jan-09 Jan-10 Jan-11 Jan-12
                                                                   of the benefits for Africa outside of the mining sector: Many
Around 85% of global phosphate reserves are located in             Chinese mining companies have intricate relationships with
North Africa with Morocco the most important location of           engineering and construction counterparts back home – not
high-quality phosphate rock on the continent. The majority         least of all semi-state and public companies. This enables
of the area’s mined phosphates – which currently contribute        miners to build roads, construct schools and hospitals and
around a quarter of world output – are used in the production      provide other supportive infrastructure for both their own and
of fertiliser. The political unrest seen in the region since the   African workers where mines are located. Their executives
start of 2010 translated into a rise in rock prices as tracked     and home government are also not too concerned with local
in Casablanca and recorded by the World Bank. Prices have          politics compared with Western investors. In fact, some of
been elevated since then as unrest swept across the region         Africa’s most unsavoury political regimes have good ties
and have yet to die down. The pricing outlook for phosphates       with Beijing due to a lesser amount of talk about politics and
is positive given the continued unrest in the Middle East &        a greater focus on commodities. Another point to consider
North Africa (MENA) region, miners and fertiliser producers        is the influx of Chinese retailers into thousands of African
in North America facing environmental challenges, as well as       towns and cities that have been steadily growing over the
China more tightly controlling its exports. And, as noted by       past decade. While African might not always welcome these
Frost & Sullivan’s Chemicals, Materials & Food division, there     enterprises due to the price competition posed by Chinese
is no effective substitute for this raw material when used         imports, consumers are happy with the bargain prices
for making fertiliser. Investors worldwide have been looking       offered on semi-durable and durable goods like clothing and
towards agriculture as a long-term rewarding investment due        appliances. International law firm Norton Rose commented
to the simple fact that the world population is growing and        late in 2012 that African governments are increasingly
needs to be fed. Some astute investors have also realised the      demanding more from Chinese investors by e.g. requiring that
importance of North African phosphates in this view.               minerals be processed locally before being shipped to China.

Chinese Demand & Investment                                        Rising Resource Nationalism
China accounted for almost 17% of the world’s mineral              So-called resource nationalism was a prominent news
imports by value last year. What might come as a surprising        topic during 2012; becoming almost “contagious” as
statistic is that only 16% of Africa’s exported commodities        argued by Oxford Analytica. The term is defined as the
by value were shipped to commodity-hungry China. The               drive by governments and communities to proclaim control
continent’s largest export buyers in 2011 were China               over natural resources (and the benefits thereof) located
(16.4% of all exports by value), the US (15.9%), India (6.7%),     within their sovereign borders. In Africa’s context resource
Italy (6.5%), France (6.2%) and Spain (5.4%), followed by          nationalism is a drive to increase the benefit obtained by
Germany, the United Kingdom and the Netherlands. China             Africans from minerals mined and exported often by foreign
is the world’s second-largest economy and has the largest          companies. The resurgence of this phenomenon is a result
import bill of all countries. It purchased $100bn worth of         of several factors, including the achievement of a state-
minerals during 2012 from 100 countries, including 23 African      controlled Chinese economy; the success of state-owned
countries. The economic giant’s purchases from Africa were         companies like Brazil’s Petrobras; expectations of a continued
dominated by base and precious metals as well as precious          rise in commodity prices; and the shortcomings of capitalist
and semi-precious stones. But China is not just a buyer of         / free-market philosophies seen in some countries guided
Africa’s resources; it is also a miner on the continent. Data      by the Bretton Woods Institutions – the World Bank and
limitations precludes a reliable estimate of how many African      International Monetary Fund (IMF). Resource nationalism is
mines are operated by Chinese entities, according to the           the primary risk for mining companies worldwide followed by
Open Society Initiative of South Africa (OSISA), though it         skills shortages and infrastructure access. Recent incidences
FULL SECTOR REPORT | 5
of this phenomenon have included the payment of increased support this proposal comes at the end of ANC President
royalties and/or mining taxes, mandated beneficiation and/ Jacob Zuma’s first term as the party’s leader in which he
or export levies, as well as state ownership of resources. has been criticised from almost every corner for being an
However, putting aside the financial costs of these trends, ineffective leader in the government’s drive to create jobs and
resource investors argue that there are positives involved in reduce poverty. After several years of mining nationalisation
resource nationalism as well. For one, the risk that they pose talk by the ANC’s youth wing, the more moderate “resource
to the supply chain in some extractive industries provide more rent” idea is likely to gain traction during 2013. It will be the
of a price floor similar to the upward pressure on the oil price latest move to shore up tax revenues in the country whose
seen from geopolitical conflict in the Middle East. counter-cyclical fiscal policy is being pressured by increasing
demands from voters for more social expenditure.
Egypt’s Sukari gold mine is 50% owned by Australian
company Centamin and 50% owned by the Egyptian Zimbabwe’s economy was open to foreign investment
government, and exports from this mine have become an during the 1980s and 1990s though took a turn for the worst
important foreign exchange earner for the country. In October with the government’s land expropriation drive during the
2012 an Egyptian administrative court ruled that Centamin’s early 2000s. The mining sector experienced a decline in
contract to exploit the mine was invalid after a number of activity and investment leading up to the economic and
deals – made under deposed President Hosni Mubarak – had political turnaround of 2008-09 followed by (limited) renewed
been reviewed, with the government seizing assets that interest from foreign capital. However, during September
they found to have been awarded illegally or under a cloud 2010 the Ministry of Youth, Empowerment and Indigenisation
of corruption. The court did however leave the door open resurrected the Indigenisation and Economic Empowerment
for Centamin to appeal – which the company did, and it has Act of 2007 which required foreign-owned companies to
been able to continue operations in the interim. It is unclear eventually have a majority local ownership. The state’s first
as yet whether Centamin is in the wrong; either way, it will target was the big mining sector with its large offshore
make potential investors wary of investing in Egypt until there shareholding. The indigenisation process was much smoother
is certainty about the future direction of economic policy and almost absent of the violence seen on farms some years
and its stance towards Mubarak-era investments. Although earlier, and by the end of 2012 the vast majority of foreign-
the seizing of assets linked to the Mubarak regime is not owned miners had reached deals with the government about
a structural policy switch toward nationalisation, it is still selling / turning over 51% of equity to locals.
unnerving to investors and reflects the challenging business
“The single most important thing that companies and senior
environment that Egypt still has.
executives need to do in order to manage their resource
Kenya legislated during October 2012 stipulations that nationalism game is to act with respect. If they drop in on
foreign-owned mining companies applying for operating flying visits, and act like they have all the answers, and
licenses in the country will in the future be required to have act like they don’t think that they need to bother to show
a minimum 35% local shareholding. The government stated an understanding of local historical, cultural and political
that its intention was to leave behind a history of foreign dynamics, they will fail, and end up as targets for endless
companies obtaining 100% control of mineral resources value extraction until they eventually run away,” commented
without local companies and communities benefitting from Africa Business Communities’ Isaac Twumasi-Quantus on
mining. Also, by increasing investment and revenue value the Business Fights Poverty website during January 2012.
amongst companies domiciled in Kenya, the state is hoping Dealing with resource nationalism requires a multi-faceted
to increase its tax revenues. The draft Geology, Minerals and approach, including partnering with state-owned enterprises
Mining Bill of 2012 is also seeking to differentiate the royalties (SOEs) and local communities to ensure that the benefit of
paid on different minerals which could translate into higher mining is transferred to citizens. Also required is convincing
government receipts from gold and diamond operations. governments about the value of mining to the entire economy
There is also a drive to see more mining companies list on the as well as encouraging direct public sector participation in
Nairobi Stock Exchange (NSE). The fact that large coal, oil and mining projects.
titanium discoveries were recent made in the country cannot
be overlooked as the government looks to cash in on the
mining sector.
South Africa’s ruling African National Congress (ANC)
resolved at its quinquennial national conference during
December 2012 to support the introduction of a so-called
“resource rent” tax on mining companies. The levy will be
charged on companies making a significant return on their
assets after a certain period of operation, thereby excluding
smaller miners from this increase in taxes. The move to6 | FULL SECTOR REPORT
FULL SECTOR REPORT | 7

AFRICAN MINING TOMORROW – OUTLOOK                                                Current Regulations Supporting Mineral
                                                                                  Exploration (Score out of 1; 1 = best)
TOWARDS 2020                                                           Botswana
Future Demand from Key Trading Partners                               Greenland
                                                                            Chile
Africa’s export-oriented mining and quarrying is driven             Burkina Faso
primarily by the commodity hunger of the world’s largest                   Ghana
                                                                         Sweden
economies. The world economy expanded by 4% p.a. during                   Finland
2004-11 and is projected by the IMF to grow by almost 3.5%                Mexico
                                                                        Tanzania
p.a. during 2012-13. A rosier outlook is pencilled in for 2014-               Mali
20 with an average growth rate of 4.6% p.a. projected based                 Brazil
on the multilateral organisation’s latest World Economic                Colombia
                                                                          Turkey
Outlook. Of particular interest to African mining activities is          Morocco
the positive growth outlook for its key trading partners.                 Ireland
                                                                      Santa Cruz
                                                                        San Juan
           Real Economic Growth Outlook for Africa’s                      Zambia
                  Top Mineral Export Buyers                            Mauritania
                                                                          Poland
                1994 - 2003   2004-11    2012-13F      2014-20F             Salta
                   avg.         avg.       avg.          avg.            Namibia
                                                                        Mongolia
 World                3.40        4.00        3.45         4.60          Guyana
                                                                             Peru
 China                9.40      10.84         8.00         8.50
                                                                            Jujuy
 India                6.00        8.23        5.45         6.90             Niger
                                                                     Madagascar
 United               3.50        1.19        0.35         2.70              DRC
 Kingdom                                                              Catamarca
                                                                          Guinea
 Japan                0.90        0.60        1.70         1.10             Spain
                                                                     South Africa
 US                   3.30        1.50        2.15         3.30             Egypt
 Germany              1.50        1.45        0.90         1.30           Norway
                                                                     Kazakhstan
 Belgium              2.30        1.64        0.15         1.50          Vietnam
                                                                          Russia
 Turkey               2.70        5.38        3.25         4.40              Laos
                                                                      Kyrgyzstan
 Switzerland          1.30        2.24        1.10         1.90             China
 Canada               3.50        1.83        1.95         2.30         Romania
                                                                       Rio Negro
 Italy                1.70        0.25       -1.50         1.40          Ecuador
                                                                             India
The preceding table indicates that the growth outlook                   Suriname
                                                                      Guatemala
towards 2020 is better than the current expansion in real
                                                                        Mendoza
GDP for all the continent’s largest trading partners except               Chubut
Japan. (The key reason behind the world’s third-largest                  Bulgaria
                                                                         Panama
economy having a better reading for 2012-13 is due to the                  Bolivia
reconstruction activity still on-going following the March 2011        Zimbabwe                             Source: Fraser Institute
earthquake and tsunami.)                                               Honduras
                                                                  Dominican Rep.
There is broad agreement that the future of Africa’s                  Venezuela

commodity boom will in part be dependent on China –                              0.00      0.20      0.40          0.60           0.80
who last year was the continent’s largest buyer of mineral        In turn, a microeconometric study published in the European
exports and also the fastest-growing amongst Africa’s             Journal of Development Research during 2008 indicated that
largest trading partners. At present, one in every six shipping   major contributors to the increase in Chinese exports were
containers exported from Africa’s harbours is destined for        “collaboration with foreign investors and fierce domestic
ocean ports servicing Chinese imports. A 2010 study by the        competition”. Considering these two elements:
Reserve Bank of Australia (RBA) found that Chinese exports
(largely manufactured goods) are a “sizeable and significant      • It is expected that collaboration with foreign investors
determinant” of the country’s demand for resource                   into China will, at worst, remain unchanged, and may very
commodities such as those produced by African miners. This          well improve at a faster rate than before. Following their
suggests that the future of Africa’s commodity exports to the       Central Economic Work Conference held in December,
East is tied to the outlook for Chinese exports going forward.      the Communist Party’s top leaders issued a press release
8 | FULL SECTOR REPORT in which they pledged to “deepen reforms” and to “open Geographical Bright Spots [China] up more”. It is true that there is a conservative Having argued that the outlook for demand of African minerals faction in the Chinese government that opposes reform, looks positive towards 2020 it is crucial to understand which but it seems that – as The Economist says – the election of African states are capable of capitalising on this scenario. Two the reform-minded Li Keqiang and the president-in-waiting key factors to consider are the general operating environment Xi Jinping, as well as the attention given to their remarks within the country as well as political risk factors. In the about reform, “could be aimed at signalling a new resolve” table on the next page is a selection of indicators that would to keep opening up the economy. pertain to an investment decision into an African country’s • A 2011 research survey found that Chinese manufacturing mining sector. These are sourced from annual publications competitiveness is determined by 1) the cost and supply by the World Bank, Transparency International and the World of labour; 2) state support for research and development, Economic Forum. The list includes 34 countries (the selection quality of infrastructure, as well as local business dynamics. is limited by data constraints), all of which have commercially The labour market issue is the only factor that could viable minerals listed by the CIA. pose a challenge to factory sector competitiveness, with their demographic trends suggesting labour quality and availability in the labour-intensive consumer goods manufacturing industry being better than that of heavy industry towards 2020 while not as favourable as those of more technologically intensive sectors.
FULL SECTOR REPORT | 9
African Countries’ Operating Environments
Country World Transparency World Economic Forum (WEF) Global Competitiveness Index (GCI) 2012-13 (out of 144) Score Rank
Bank Doing International
Business Corruption
Survey 2013 Perceptions
(out of 185) Index 2012 Government
Infrastructure Investment & Trade Labour Relations
(out of 176) Interaction
survey rankings (out of 1)
Business impact of rules
Business impact on HIV/
Business regulations for
Favouritism in decisions
Operating environment
of government officials
Burden of government
local firms (out of 185)
attractiveness ranking
Cooperation in labour-
employmentrelations
Prevalence of trade
Burden of customs
Perceived levels of
Weighted score of
Quality of railroad
Quality of roads
Hiring and firing
of government
infrastructure*
Quality of port
Transparency
infrastructure
policymaking
procedures
corruption
regulation
practices
barriers
on FDI
AIDS
Algeria 152 105 134 140 144 88 90 131 141 138 141 69 143 112 0.83 32
Benin 175 94 65 106 108 104 107 95 138 125 128 118 106 64 0.73 28
Botswana 59 30 29 43 43 55 55 97 42 49 54 136 113 123 0.45 4
Burkina Faso 153 83 90 49 60 125 92 103 90 48 83 109 95 32 0.58 11
Burundi 159 165 126 121 134 121 144 136 137 133 140 141 131 87 0.90 34
Cameroon 161 144 108 73 73 112 75 99 54 53 63 115 94 18 0.59 13
Cape Verde 122 39 49 38 58 65 144 85 121 83 116 88 110 99 0.58 12
Chad 184 165 124 95 138 103 144 130 135 129 139 138 132 23 0.85 33
Egypt 109 118 74 113 113 109 52 79 124 110 90 86 128 116 0.68 24
Ethiopia 127 113 71 63 129 64 112 110 143 114 125 126 100 81 0.71 25
Gabon 170 102 69 19 39 138 67 138 139 43 99 127 82 119 0.64 20
Ghana 64 64 78 66 90 85 104 76 83 74 115 120 76 30 0.54 9
Guinea 178 154 57 30 126 140 108 107 126 122 119 129 74 27 0.71 27
Ivory Coast 177 130 95 55 106 107 87 53 131 58 76 117 32 28 0.60 14
Kenya 121 139 120 74 105 72 72 91 105 90 109 130 77 11 0.63 17
Lesotho 136 64 118 100 135 111 110 114 129 93 110 140 121 96 0.76 31
Liberia 149 75 30 15 50 76 59 72 49 106 43 75 85 66 0.45 5
Madagascar 142 118 85 117 141 130 98 123 133 121 123 82 83 45 0.74 29
Malawi 157 88 101 79 103 89 84 94 87 107 121 143 91 58 0.67 22
Mali 151 105 93 56 117 82 61 74 117 103 70 121 78 77 0.62 16
Mauritania 167 123 140 24 131 119 91 98 43 112 75 97 138 29 0.66 21
Morocco 97 88 42 64 53 70 36 49 57 33 42 81 120 74 0.43 3
Mozambique 146 123 83 70 70 135 89 116 118 73 101 137 126 102 0.71 26
Namibia 87 58 88 68 85 35 39 27 77 84 82 142 116 130 0.54 8
Nigeria 131 139 122 36 63 114 95 106 108 86 94 114 115 17 0.64 19
Rwanda 52 50 5 2 7 40 144 109 60 18 6 122 40 59 0.34 1
Senegal 166 94 98 91 84 97 105 58 112 68 34 95 71 76 0.60 15
South Africa 39 69 110 123 35 42 46 52 39 61 56 135 144 143 0.53 7
Swaziland 123 88 111 99 132 47 48 68 97 98 135 144 102 117 0.68 23
Tanzania 134 102 56 58 93 94 82 117 122 50 113 131 101 70 0.63 18
The Gambia 147 105 17 12 44 51 144 47 44 28 25 96 24 40 0.39 2
Uganda 120 130 113 40 59 110 111 90 93 31 64 132 86 7 0.57 10
Zambia 94 88 68 21 46 96 80 70 67 37 62 139 88 31 0.47 6
Zimbabwe 172 163 117 107 72 95 76 61 45 143 111 133 122 140 0.74 30
Weighting 8% 8% 7% 7% 7% 7% 7% 7% 7% 7% 7% 7% 7% 7%
Sources: World Bank, Transparency International, WEF, CIA, NKC Research
* Countries with railroad infrastructure of less than 50 km are not evaluated by the WEF GCI. We have assigned a default 144th position ranking for these economies
within this category.10 | FULL SECTOR REPORT
The indicators selected for this table are relevant to large- is the most favourable; the countries are ranked according
scale investments in labour-intensive extractive industries to this quantitative assessment with the top 10 performers
where government regulation is most often quite rigorous. highlighted. This assessment provides a list of countries that
They include considerations about government interaction, could have a favourable operating environment for mining
infrastructure quality, investment and trade regulations, firms. In the following graph, the above table’s findings are
as well as labour relations. The countries’ rankings in the combined with NKC Independent Economists’ political risk
different publications are weighed to determine a score scores for African states. Both the operating environment and
for the quality of a particular jurisdiction’s operational political risk evaluation produces quantitative assessments
environment from a mining investor’s perspective. A score between zero and one, with a lower reading being better.
between zero and one is possible where the lowest reading
Potential African Mining Destinations
Political Risk Assessment (out of 1; worst = 1)
0.80
Cameroon Swaziland
0.75
Egypt Ethiopia Algeria
0.70 Ivory Coast
Morocco Zimbabwe
Burkina Faso Gabon
0.65 Lesotho
Uganda Kenya Malawi
South Africa Nigeria
0.60
Senegal Tanzania
Rwanda Namibia Mozambique
0.55
Botswana Zambia Ghana Benin
0.50
0.30 0.35 0.40 0.45 0.50 0.55 0.60 0.65 0.70 0.75 0.80 0.85 0.90
Operating Environment Ranking (out of 1; worst = 1)
Botswana – Debswana (a joint venture between De Beers Moody’s Investor’s Service assigned Ghana a sovereign
and the Botswana government) along with Russia’s state- risk rating of “B1” with one of the main drivers of the
owned ALROSA produce around three-quarters of world assessment being robust economic growth prospects on
diamond production. Botswana is the largest diamond miner the back of foreign investment in gold mining, petroleum and
by value in the world and sources 70% of its export receipts gas sectors. Companies including Perseus Mining Ltd. and
and 40% of state revenues from this resource. Aside from Endeavour Mining Corporation invested $2bn in Ghanaian
the country’s well-known diamond reserves, coal production gold mines during 2011-12, according to the Ghana Minerals
is likely to become of increasing value to Botswana following Commission.
the lifting of a moratorium on new prospecting licences for
Mozambique – The mining sector’s contribution to overall
coal, coal-bed methane and related minerals in 2011.The
economic activity is expected to increase significantly over
Coal Road Map unveiled in 2011 is a strategic plan to plot
the medium- to long-term on the back of a sharp projected
development of the coal sector through 2018 and beyond.
increase in coal production. The Mozambican government is
The country is estimated to have more than 200 billion tonnes
hoping for an increase in the sector’s contribution to 12% of
of coal reserves - much of which are untapped. Recognising
GDP by 2015 compared to just 2% during 2012. According
this potential, and that the coal sector could be the most
to the IMF, megaprojects (including coal and gas production)
propitious new export sector and a potential substitute for
have the potential to make a contribution of 18% of total
Botswana’s diamond revenue in time, development of the
value added in the economy by 2016, and to boost economic
coal sector has become a key priority.
growth by two to three percentage points each year. (During
Ghana – Gold is by far the most important mineral in the small 2003-10, megaprojects contributed some four percentage
mining sector. Foreign-owned firms dominate the country’s points to the growth in total value added in the economy.)
mining landscape with many of the largest companies having Coal production in Mozambique could reach beyond 100
links to South Africa, the United Kingdom and China. Ghana million tonnes p.a. within the next five years from less than
is the second-largest gold producer on the continent after 40,000 tonnes p.a. over the past decade.
South Africa, and the outlook for production growth over the
Namibia – Mineral exports constitute almost half of the
long-term is very favourable (as opposed to a more lacklustre
country’s total export earnings, with the country producing
future for Africa’s largest economy). During December 2012
diamonds, uranium, copper, magnesium, zinc, silver, gold,FULL SECTOR REPORT | 11
lead, semi-precious stones and industrial minerals. Namibia attractive for iron ore mining. The Angolan government is
is the fourth-largest exporter of non-fuel minerals in Africa, hoping to generate enough local and foreign investment to
with this category contributing around half of all exports set up smelters for the production of steel and iron alloy.
over the past decade. Research and Markets believes that
• Cameroon – Diamond production is currently dominated
Namibia’s mining sector will post a real expansion of 12.5%
by artisanal miners though the government hopes that
p.a. towards 2017 despite a decline in uranium prices during
industrial diamond output will soon increase significantly,
2011-12 leading to the delay in launching several uranium
as Botswana Diamonds and C&K Mining start to unearth
projects in the country. The organisation believes that the
diamonds in the country. Bauxite reserves (the main source
Namibian mining sector’s strong performance over the past
of aluminium) is estimated at one billion tonnes.
two decades is definitely sustainable thanks to the positive
outlook for diamond mining. They expect carat production to • DRC – Mining has been the main pillar of the economy
rise by 9.1% p.a. over the next five years. since colonial times, and still accounts for around 80%
of export earnings. In recent years the mining sector has
Tanzania – The mining industry remains relatively small
become an integral and increasingly important part of the
but it is exceedingly important as a significant source of the
economy despite the country’s relatively high levels of
country’s export revenues. The mining sector contributed
political risk. The local mining industry is seen as amongst
approximately 3.2% to GDP in 2012 while the government
the most attractive in Africa due to the vast volume
wishes to expand this to 10% by 2025. In the government’s
of mineral resources in spite of the difficult operating
estimates, about 90% of Tanzania’s minerals – including
environment. The DRC is the third largest diamond
gold, diamonds and gemstones – are yet to be exploited. The
producer in the world by volume and most diamonds are
country has for a long time now been a significant producer of
produced by small-scale artisanal miners. Elsewhere,
gold and diamonds, but exploration has also been conducted
Randgold and AngloGold Ashanti’s Kibali gold project –
in nickel, uranium and oil and natural gas. Construction of a
which is thought to be one of the largest goldfields in Africa
nickel mine is set to start in 2014 while production should
with 10.2 million ounces – is scheduled to start production
commence some two years later. Furthermore, large-scale
in 2013. The project is one of several that are due to either
commercial uranium mining is likely to commence over the
commence or expand over the next three years as the
coming years as well. In addition, Tanzania’s industrial growth
country’s copper and gold sectors expand rapidly. It is
could be boosted significantly by coal mining over the long-
possible for the mining sector to grow by 12% p.a. during
term as the country increases its reliance on coal-fired power
2013-16, largely driven by the very positive outlook for
stations.
precious and base metal production.
Zambia – The landlocked country has a wide spectrum of
• Kenya – Australia’s Base Resources could start producing
mineral resources which spans a range of metals including
and exporting rutile, zircon and ilmenite when Kenya’s
copper, cobalt, zinc, gold, manganese, nickel and gemstones.
first ever large-scale mine commences production in Q3
There is also a variety of industrial metals. Despite this
of 2013. The mine is expected to produce 80,000 tonnes
wealth however, the economy remains dependent on the
of rutile per year – representing 14% of the world’s
extraction and processing of copper and, to a lesser extent,
annual supply – in addition to 330,000 tonnes of ilmenite
cobalt for export, which remain the country’s largest industry.
and 40,000 tonnes of zircon, when it is fully operational.
Combined copper and cobalt account for approximately 10%
Kenya’s output from the Kwale mineral sands mine at the
of GDP and around 80% of export receipts. The country
coast is expected to triple the country’s mining export
witnessed a decline in copper production during the 1990s
revenues and is projected to overtake export earnings from
followed by a recovery over the past decade, with the positive
coffee, which brings in about $200m p.a.
performance expected to continue over the long-term. The
sector is anticipated to expand by 2% - 4% p.a. over the next • Liberia – Gold deposits lie in one of the last unexplored
five years and reach above one million tonnes p.a. by 2015. sections of the Birimian craton, which is the world’s second
A positive factor for investors and mining companies is the largest gold producing region and stretches across Ghana,
government’s recent decision not to reintroduce a windfall tax Ivory Coast, Guinea, Mali and Burkina Faso.
on mining companies’ profits.
• Mali – Some estimates point at Africa’s fourth-largest gold
The above assessment of investment destinations is producer exhausting its gold ore within the next decade.
however not the alpha and omega of Africa’s mining Operations have recently been impacted by the political
future. Other countries not included but which may provide crisis that has seen Islamist rebels take control of the north
investment opportunities include: of the country. Although gold reserves are concentrated in
the southwest, there have been doubts over government
• Angola – The production of copper and iron ore was
stability since the April 2012 coup.
interrupted during the civil war, and is yet to resume. The
provinces of Kwanza Norte and Huila appear to be the most12 | FULL SECTOR REPORT • Rwanda – Investment in the mining sector increased from $24m in 2011 to $69.9m in 2012. The investments came in the form of 14 mining projects with the largest including gold exploration and wolfram concessions. With 57.1% of mining projects registered last year being owned by foreign investors and a further 21.4% being joint ventures between foreign and local investors, Rwanda has recently seen a significant increase in foreign direct investment into the mining sector. This progression can be attributed to Rwanda’s adherence to all the international regulations required for mineral exports, which has increased investor confidence in the area. The various concessions also indicate a desire to diversify the export market. • Sierra Leone – The IMF estimated in 2011 that the country could export around 35 million tonnes of iron ore in the medium-term, which is believed to be a conservative estimate. Output could in fact be as much as between 45 million tonnes and 75 million tonnes annually over the next decade, if potential reserves are fully exploited. CONCLUSIONS Africa mining industry is centuries old, and its outlook continues to be bright. The continent’s regional distribution of key minerals focusses precious metals in Southern, West and East Africa, iron ore in Central and West Africa, as well as phosphates in North Africa. Chinese demand for African commodities and investments from the world’s second-largest economy continues to grow largely due to the Chinese attitude of limited political interference as well as value-added investments (e.g. the building of hospitals) associated with mining projects. Resource nationalism – a drive to obtain more benefit from resources for local communities and governments – has also become more critical issue and is seen as a primary concern for potential mining investors. However, the fact remains that the largest buyers of Africa’s exported minerals have a positive economic growth outlook towards 2020, with China being a particularly bright prospect. The operational environment and political risk assessments included in this report identify Botswana, Ghana, Mozambique, Namibia, Tanzania and Zambia as very attractive destinations for mining investment. Other countries that also warrant consideration include Angola, Cameroon, the DRC, Kenya, Liberia, Mali, Rwanda and Sierra Leone.
FULL SECTOR REPORT | 13

                                   African Countries’ Commercially Viable Mineral Resources
COUNTRY                    MINERALS
Algeria                    iron ore, phosphates, uranium, lead, zinc
Angola                     diamonds, iron ore, phosphates, copper, feldspar, gold, bauxite, uranium
Benin                      limestone, marble
Botswana                   diamonds, copper, nickel, salt, soda ash, potash, coal, iron ore, silver
Burkina Faso               manganese, limestone, marble; small deposits of gold, phosphates, pumice, salt
Burundi                    nickel, uranium, rare earth oxides, peat, cobalt, copper, platinum, vanadium, niobium, tantalum, gold, tin, tungsten,
                           kaolin, limestone
Cameroon                   bauxite, iron ore
Cape Verde                 basalt rock, limestone, kaolin, clay, gypsum
Central African Republic   diamonds, uranium, gold
Chad                       uranium, natron, kaolin, gold, limestone, sand and gravel
Congo Brazzaville          timber, potash, lead, zinc, uranium, copper, phosphates, gold, magnesium
Djibouti                   gold, clay, granite, limestone, marble, salt, diatomite, gypsum, pumice
DRC                        cobalt, copper, niobium, tantalum, industrial and gem diamonds, gold, silver, zinc, manganese, tin, uranium, coal
Egypt                      iron ore, phosphates, manganese, limestone, gypsum, talc, asbestos, lead, rare earth elements, zinc
Equatorial Guinea          gold, bauxite, diamonds, tantalum, sand and gravel, clay
Eritrea                    gold, potash, zinc, copper, salt, possibly oil and natural gas, fish
Ethiopia                   small reserves of gold, platinum, copper, potash
Gabon                      diamond, niobium, manganese, uranium, gold
Ghana                      gold, industrial diamonds, bauxite, manganese, silver, limestone
Guinea                     bauxite, iron ore, diamonds, gold, uranium
Ivory Coast                diamonds, manganese, iron ore, cobalt, bauxite, copper, gold, nickel, tantalum
Kenya                      limestone, soda ash, gemstones, fluorspar, zinc, diatomite, gypsum
Lesotho                    diamonds, sand, clay, building stone
Liberia                    iron ore, diamonds, gold
Libya                      gypsum
Madagascar                 graphite, chromite, coal, bauxite, rare earth elements, quartz, tar sands, semiprecious stones, mica
Malawi                     limestone, unexploited deposits of uranium, coal, and bauxite
Mali                       gold, phosphates, kaolin, limestone, uranium, gypsum, granite
Mauritania                 iron ore, gypsum, copper, phosphate, diamonds, gold
Morocco                    phosphates, iron ore, manganese, lead, zinc
Mozambique                 coal, titanium, tantalum, graphite
Namibia                    diamonds, copper, uranium, gold, silver, lead, tin, lithium, cadmium, tungsten, zinc
Niger                      uranium, coal, iron ore, tin, phosphates, gold, molybdenum, gypsum
Nigeria                    tin, iron ore, coal, limestone, niobium, lead, zinc
Rwanda                     gold, cassiterite (tin ore), wolframite (tungsten ore)
Senegal                    phosphates, iron ore
South Africa               gold, chromium, antimony, coal, iron ore, manganese, nickel, phosphates, tin, rare earth elements, uranium, gem
                           diamonds, platinum, copper, vanadium
South Sudan                gold, diamonds, limestone, iron ore, copper, chromium ore, zinc, tungsten, mica, silver
Sudan                      small reserves of iron ore, copper, chromium ore, zinc, tungsten, mica, silver, gold
Swaziland                  asbestos, coal, clay, cassiterite, small gold and diamond deposits, quarry stone, and talc
Tanzania                   tin, phosphates, iron ore, coal, diamonds, gemstones, gold nickel
The Gambia                 clay, silica sand, titanium (rutile and ilmenite), tin, zircon
Tunisia                    phosphates, iron ore, lead, zinc, salt
Uganda                     copper, cobalt, limestone, gold
Zambia                     copper, cobalt, zinc, lead, coal, emeralds, gold, silver, uranium
Zimbabwe                   coal, chromium ore, asbestos, gold, nickel, copper, iron ore, vanadium, lithium, tin, platinum group metals
Source: CIA World Factbook
14 | FULL SECTOR REPORT
SOURCES OF INFORMATION CONTACT DETAILS
Central Intelligence Agency (CIA) ANTHONY THUNSTROM
Chief Operating Officer Africa
European Journal of Development Research
M: +27 83 700 8862
Financial Times E: anthony.thunstrom@kpmg.co.za
Fraser Institute KATHERINE MILES
Senior Manager
How We Made It In Africa
Africa High Growth Markets
International Monetary Fund (IMF) M: +27 82 710 7408
E: katherine.miles@kpmg.co.za
Mining Weekly
SHELLEY ALBERTS
Research & Markets
Manager
Reserve Bank of Australia (RBA) Africa High Growth Markets
M: +27 82 710 9807
Resource Investor
E: shelley.alberts@kpmg.co.za
South African Institute of International Affairs (SAIIA)
WAYNE JANSEN
Southern African Institute of Mining and Metallurgy Africa Head of Mining
T: +27 (0) 83 357 2131
Sustainable Energy Society of Southern Africa (SESSA)
E: wayne.jansen@kpmg.co.za
The Economist
DIMEJI SALUDEEN
Trade Map Head of Mining
West Africa
Transparency International
T: +23 412 718 955
US Geological Survey E: dimeji.salaudeen@ng.kpmg.com
Wikipedia JACQUES ERASMUS
Head of Mining
World Bank
Southern Africa
World Economic Forum (WEF) T: +27 (0) 82 719 0305
E: jacques.erasmus@kpmg.co.za
NKC
ALEXIS MAJNONI
Head of Mining
Francophone Africa
T: +33 622 545 452
E: amajnoni@kpmg.fr
JOSE SILVA
Head of Mining
Angola
T: +35 121 011 0160
E: jlsilva@kpmg.com
BENSON NDUNGU
Head of Mining
East Africa
T: +25 641 434 0315
E: bndungu@kpmg.com
© 2012 KPMG Africa Limited, a Cayman Islands company and a member firm of the KPMG network of independent member firms affiliated with KPMG International Cooperative (“KPMG
International”), a Swiss entity. All rights reserved. The KPMG name, logo and “cutting through complexity” are registered trademarks or trademarks of KPMG International. MC9835You can also read