MODELLING SCENARIOS FOR THE SARS-COV-2 OMICRON VOC (B.1.1.529) IN NORWAY, GRADUAL REOPENING IN FEBRUARY-MARCH 2022
←
→
Page content transcription
If your browser does not render page correctly, please read the page content below
Modelling scenarios for the SARS-CoV-2 Omicron VOC
(B.1.1.529) in Norway, gradual reopening in February-
March 2022
The FHI COVID-19 modelling group1, Folkehelseinstituttet (FHI, Norwegian Institute of Public Health)

January 26th, 2022

Sammendrag
I denne rapporten gir vi en oppdatering av modelleringsresultatene som ble publisert 12. januar om
spredningen av omikron-varianten i Norge. Modellen simulerer hvor mange som blir smitta, og også
innleggelser på sykehus og respiratorbehandling av pasienter med hovedårsak covid-19. Vi har
oppdatert estimater for smitterate og alvorlighet for omikron ved bruk av data som er samla inn i Norge
og internasjonalt så langt. Vi har justert parametere for liggetid i sykehus og sannsynlighet for å trenge
respirator. Modellen tar nå også hensyn til at personer tidligere smittet med delta kan smittes på nytt
med omikron. I denne rapporten har vi bare fokusert på scenarioer for lettelser av tiltakene som har
vært i kraft siden desember 2021. Vi utforsker scenarioer for smitte og innleggelser ved å legge inn ulike
tiltakslettelser i modellen.

Formålet med modellering er å understøtte beslutningstakere ved å gi en best mulig beskrivelse av nå-
situasjonen, og å undersøke “hva hvis”-scenarioer for å illustrere hvordan usikkerhet i parametere, og
ulike framtidige tiltak eller lettelser, kan påvirke utviklinga av epidemien.

Hvor stor effekt tiltakene som ble innført primo/medio desember har hatt, er fremdeles en betydelig
kilde til usikkerhet i modellen. I denne rapporten estimerer vi at tiltakene bidro til å redusere
kontaktraten i samfunnet med 45-55 prosent. Det er noe lavere enn det vi antok i forrige rapport (30-50
prosent), og skyldes at vi nå har mer data å sammenligne med. Det er rimelig å tro at kontaktraten har
gått noe opp i løpet av januar, ettersom tiltak har blitt letta på. Vi viser så et sett av scenarioer som
simulerer ulike grader og tidspunkter for gjenåpning. Videre, så har vi oppdatert antakelsen om
alvorligheten av omikron, slik at det nå antas en 70 prosent redusert innleggelsesrisiko, en 33 prosent
redusert midlere liggetid og en 58 prosent redusert risiko for å trenge respiratorbehandling for en
innlagt pasient, sammenligna med delta.

Modellen finner at omikronvarianten vil kunne smitte en stor del av befolkningen i Norge, de ulike
scenarioene estimerer mellom 3-3,5 millioner smittede fram til sommeren. En full gjenåpning av
samfunnet 1.februar kan føre til en betydelig bølge av innleggelser som topper seg med 250-350 daglige
innleggelser i andre halvdel av februar og begynnelsen av mars. Dette svarer til omtrent 1000 samtidig
innlagte på topp, med den reduserte liggetida hensyntatt.

En mer gradvis lettelse av tiltakene vil bidra til å redusere størrelsen på bølgen. I et scenario med
moderat gjenåpning (til 60% av kontaktrate før 3. desember) 1. februar, etterfulgt av en full gjenåpning
på et seinere tidspunkt, reduserer maksimalt antall samtidige innleggelser betydelig. Jo seinere full
gjenåpning kommer, desto lavere blir toppen. I tilfellet der full gjenåpning skjer to uker seinere, 15.
februar, finner modellen en topp i daglige innleggelser på mellom 100 og 300. Hvis gjenåpning i stedet
skjer 1. mars finner modellen en topp på 50-250 daglige innleggelser, mens 15. mars gir en topp på 25-
150 daglige innleggelser. I disse scenarioene er det tilsvarende maksimale antallet samtidige innlagte på
700-900, 300-600 og 300-400 for gjenåpning henholdsvis 15. februar, 1. mars og 15. mars.

I scenarioet med en større grad av gjenåpning 1. februar (til 80 prosent av normal kontaktrate), spiller
tidspunktet for den etterfølgende fullstendige gjenåpninga mindre rolle. En full gjenåpning 15. februar
kan føre til 150-300 daglige innleggelser på topp. Modellen finner ingen store forskjeller mellom full
gjenåpning 1. eller 15. mars: I begge scenarioer ligger toppen i daglige innleggelser på mellom 150 og
250. Det tilsvarende maksimale antallet samtidige innlagte er 700-900 og 600-700 for gjenåpning
henholdsvis 15. februar og 1. eller 15. mars.

Modellen estimerer at omtrent 10 000 personer vil trenge sykehusbehandling i løpet av omikron-bølgen
i scenarioene med gradvis gjenåpning En full gjenåpning av samfunnet den 1. februar vil føre til
nærmere 12 500 innleggelser. Vi ser at tempoet i gjenåpningen har størst effekt på toppen av
epidemien, men også en effekt på den totale sykdomsbyrden.
Summary
In this report, we present an update of the modeling results published on January 12 about the spread
of the Omicron variant in Norway. We update estimates of the transmission rate and severity of the new
variant using data gathered so far in Norway and internationally and refine the model by including a
better simulation of quarantine dynamics and the possibility of reinfection with the Omicron variant for
Delta cases. We explore future COVID epidemic trajectories in different scenarios varying the level of the
future reopening of society.

The simulations aim to support policy-decision makers based on current knowledge and answer 'what-if'
questions to illustrate how uncertainties in the parameters and different interventions might affect the
development of the epidemic.

The simulations explore the effect of releasing the infection-control measures imposed in Norway since
December 2021. The effect of interventions implemented in mid-December is still an important source
of uncertainty. In this report, we choose a range of reductions in the transmission rates that reasonably
fit the current observed trend in hospital incidence. We thus present a set of scenarios showing
different times and levels of reopening. In this report, we have updated the assumptions of the severity
of Omicron such that we now assume that there is a 70% decrease in risk of hospitalization compared to
Delta, a 33% decrease in length of stay and a 58% decrease in risk of needing ventilator treatment given
admission to hospital.

The model indicates that a large fraction of the Norwegian population will be infected over the next few
months with 3-3.5 million infections in the different scenarios. An early full reopening of the society on
the 1st of February could result in a significant number of daily hospitalizations due to covid-19 infection
peaking at 250-350 admissions in the second half of February and the beginning of March. This
corresponds to a hospital prevalence of around 1000 patients hospitalized due to covid-19 infection with
the shortened lengths of stay.

A more gradual release of the control measures would help mitigate the wave of infections. In the
scenario with a moderate reopening (to 60% of the contact rate pre 3 December) on the 1st of February,
followed by a full reopening at a later date, the peak number of hospitalizations would decrease
significantly. The later the full reopening occurs, the lower the peak will be. In the case where the full
reopening would happen two weeks later, on the 15th of February, the model finds a peak of hospital
admissions ranging between 100 and 300 daily entries. The incidence of hospitalizations would be
further reduced if the reopening is further postponed to later periods, i.e., 50-250 admissions per day, if
reopening on the 1st of March, and 25-150 admissions per day, if reopening on the 15th of March. In
these scenarios, the peak of hospital prevalence would be around 700-900, 300-600, 300-400,
respectively, for full reopening on the 15th of February, 1st of March and 15th of March.

In the scenario with a higher reopening on the 1st of February (to 80% of normal contact rates), the
timing of full reopening has a smaller effect on the size of the wave in hospital. A full reopening on the
15th of February might result in 150-300 hospital admissions. We found no significant differences when
reopening on the 1st or the 15th of March: in both scenarios the number of daily hospitalizations at the
peak ranges between 150 and 250. In these scenarios, the peak of hospital prevalence is would be
around 700-900, 600-700 respectively for full reopening on the 15th of February and 1st of March and
15th of March, respectively.
The model estimates a total of approximately 10000 hospitalizations in the scenarios simulating a
gradual reopening of the society in March. In case of an early full reopening on the 1st of February, the
total number of hospitalizations would be higher, about 12500 hospital admissions. We therefore see
that a speed of the reopening has a largest effect on the top of the epidemic, but also has an effect on
the total burden of disease.
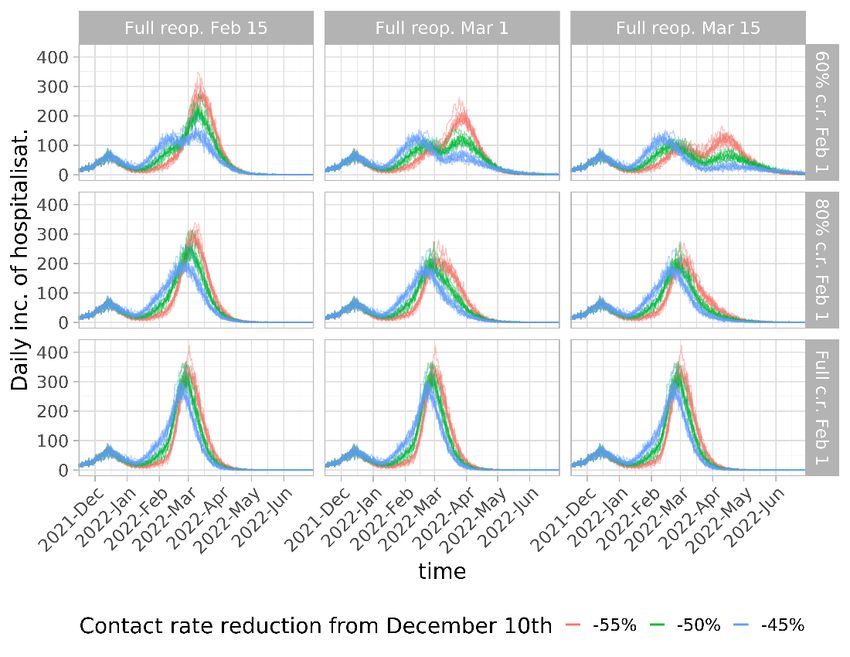
Table of Contents

Sammendrag ................................................................................................................................................ 1
Summary ...................................................................................................................................................... 3
Table of Contents ......................................................................................................................................... 5
Main changes compared to the previous report ......................................................................................... 6
   Changes in scenario assumptions ............................................................................................................ 6
Model scenarios........................................................................................................................................... 7
   Future changes in interventions for reopening ....................................................................................... 9
Uncertainties, limitations and assumptions .............................................................................................. 16
Calibration of the transmission parameters .............................................................................................. 17
   Using total incidence of hospitalizations ............................................................................................... 17
   Using age-specific cumulative hospitalization ....................................................................................... 19
   Using fraction of Omicron cases ............................................................................................................ 19
Parameters of severity and hospitalization ............................................................................................... 20
Who contributed to this report ................................................................................................................. 24
Main changes compared to the previous report
Compared to the previous report i, we updated the model by adding extra layers of interventions
(household contacts quarantine), implementing reinfection with partial cross-immunity and updating
model parameters to capture the lower severity of Omicron. The following points show the updates in
this report:

   •   We updated parameters for risk and length of stay (LOS) in hospital and ventilator treatments
       and obtained data-driven values for Omicron (see the Section: Parameters of severity and
       hospitalization).
   •   We adjusted the susceptibility of older populations to match the age profile of hospitalized
       people (see Section: Calibration using the hospitalization data).
   •   We implemented a more realistic modelling of household contacts quarantine for symptomatic
       individuals.
   •   We implemented the possibility of reinfection. An individual that has previously recovered from
       a Delta infection now has a 55% protection (i.e. a 45% risk) for reinfection by Omicron. The
       reinfected individuals enjoy protection against severe disease and death, which is equivalent to
       having gotten one extra dose of vaccine. The “waning clock” for this protection wanes from the
       time of last infection or last vaccination.

Changes in scenario assumptions
   •   According to the latest Norwegian data, we now assume a single value of 70% reduced infection
       hospitalization risk (IHR) for Omicron compared to Delta (see the Section: Parameters of severity
       of Omicron infection).
   •   We discarded the scenario of 50% reduction that we had in the previous report.
   •   We choose only one value of the vaccine efficacy (VE) escape against infection for Omicron, -35
       percentage points, as no major changes have been observed in the model dynamics when
       considering alternative assumptions, i.e. -20 percentage points.
   •   We calibrate the current transmission rate on the daily hospitalization incidence observed in
       Norway selecting three different values for the contact rate reduction in December due to
       interventions (see the Sections: Model scenarios and Calibration using the hospitalization data).
       We assume that the change in contact rate in early December took effect somewhat earlier than
       in the previous report, beginning December 3rd instead of December 8th, to better fit the
       changing trend of the hospital incidence.
   •   We simulate different reopening scenarios (see the Section: Model scenarios).
   •   We let the model offer 2nd dose to 12-15 and 1st dose to 5-11, in accordance with updated
       policyii. We assume that 50% of those 12-15 will take the second dose and 30% of those 5-11 will
       take the 1st dose based on an updated survey data. Moreover, we updated the survey data on
       how many will accept the booster dose by age group, to a more recent survey where the
       numbers are generally higher.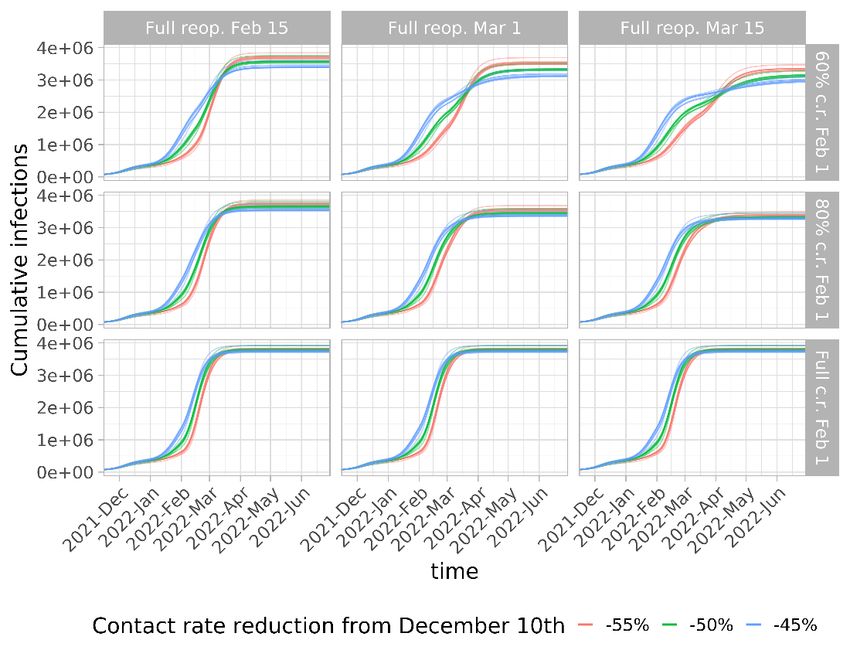
Model scenarios

The aim of the scenarios is to provide a good description of the current trend and then show multiple
possible future scenarios based on gradual reopening of society. The current trend is uncertain, which
gives 3 different scenarios for how quickly the epidemic is growing now.

We define our scenarios with the following assumptions about Omicron’s properties: 1) the vaccine
effectiveness (VE) against infection and onward transmission is reduced by 35 percentage points (e.g.,
from 80% (Delta) to 45% (Omicron)); 2) we estimate the relative transmissibility of the Omicron variant
compared to Delta by fitting the fraction of reported Omicron cases over time; 3) we define a range of
effects of interventions calibrating the reduction in the transmission rate on hospitalisation data.

The scenarios consist of 30% reduction from 3rd Dec 2021 and 3 different reduction levels in the
transmission rate due to interventions on 10th Dec 2021.

    •    45% reduction (55% of the situation before 3rd Dec 2021)
    •    50% reduction (50% of the situation before 3rd Dec 2021)
    •    55% reduction (45% of the situation before 3rd Dec 2021)

Having defined the baseline with previous interventions, we then explore alternative scenarios where
we relax the imposed infection-control measures at different levels and dates as following:

    •    3 different levels of reopening on 1st Feb 2022
              o Smaller scale reopening (60% of the situation before 3rd Dec 2021)
              o Larger scale reopening (80% of the situation before 3rd Dec 2021)
              o Full reopening (i.e., same as the situation before 3rd Dec 2021)
    •    Full reopening on 3 different dates
              o 15th February 2022
              o 1st March 2022
              o 15th March 2022

In total there are 9 combinations of potentials reopening 1.

In addition, we make the following assumptions:

    a. Vaccine protection against severe disease (i.e., hospitalisation and death) given infection is the
       same as for delta.
    b. Severity: There is large uncertainty about the severity of an omicron infection. We assume that
       the infection hospitalisation rate for omicron is reduced by 70% and the corresponding length of
       stay is reduced 38% compared to delta. We also assume the risk of needing ventilator treatment
       is reduced by 50% compared to delta.
    c. Vaccine uptake: No further uptake of 1st and 2nd doses of vaccines than SYSVAK as of January
       18th, except that 5-15-year-olds are offered one or two doses (we assume 50% uptake of 2nd
       doses for 12-15 years old and 30% uptake of 1st doses for 5-11 years old). Booster doses are

1
 Three of the defined scenarios are identical since the full reopening on the 1st of February makes ineffective the
three full reopening on later periods.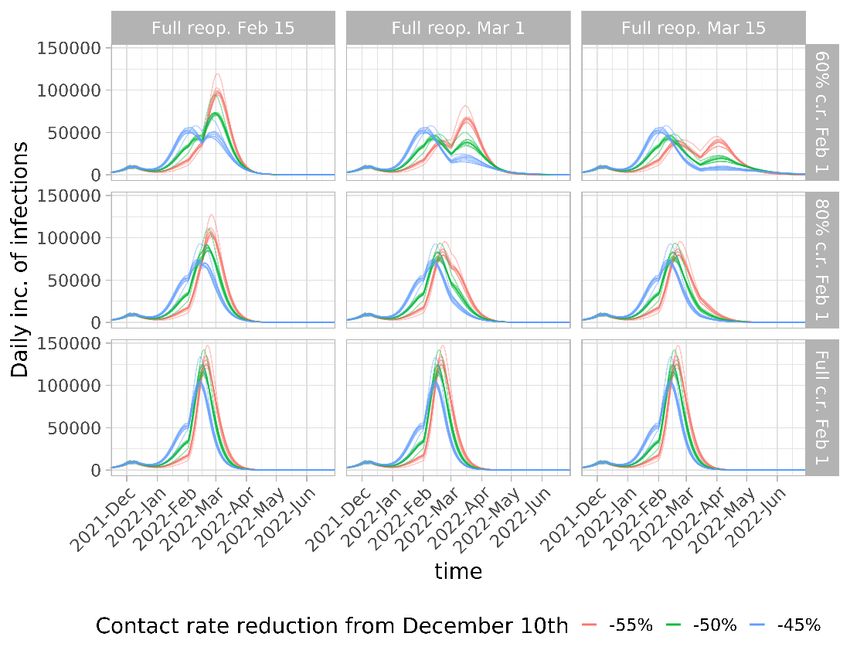
offered to everyone aged 18 and above, with age-dependent uptake according to survey data
   from week 2, 2022, as reported in the following table.
                     Age         Age          Age         Age         Age         Age
                     0-17       18-29        30-39       40-49       50-59        60+
       Dose 3     Not offered    87%          88%         89%         94%         98%
d. Time delay between 2nd and 3rd (booster) dose is set to minimum 4.5 months.
e. Home isolation and household quarantine adherence rate is set to 70% for index cases infected
   and symptomatically ill with COVID-19. A 6-day daily test/quarantine of entire household starts
   from the next day of developing symptoms. Note that quarantine is NOT lifted in this report, but
   we assume that the mandate for daily testing will retain a lot of the same effect on stopping
   transmission out of households.
f. Vaccine effectiveness and waning are based on data from the UK and Norway, and assume a
   linear waning for 33 weeks (see the Methods section of the previous report ii for details)
g. The seasonal variation of the transmission rate is 35% between the warmest and coldest days of
   the year.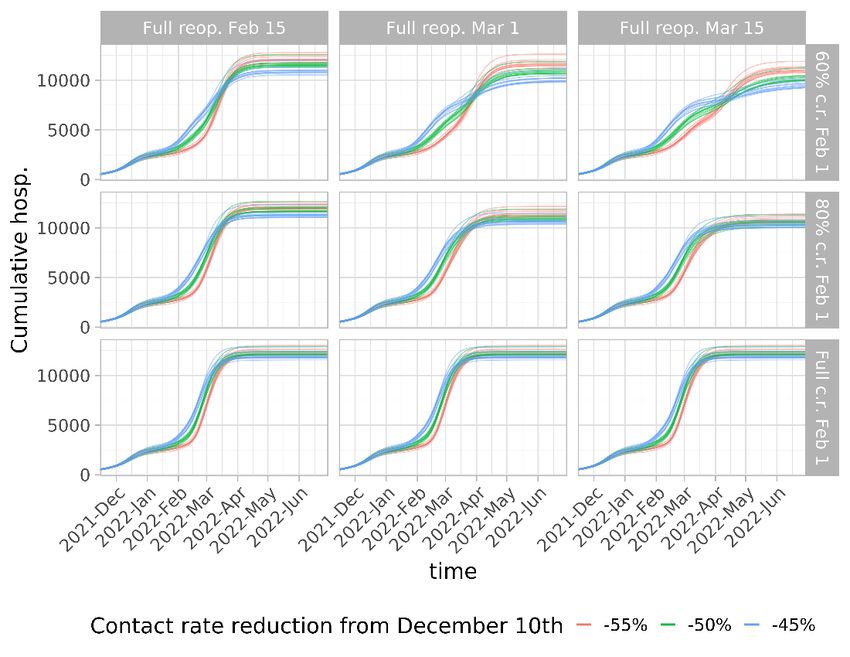
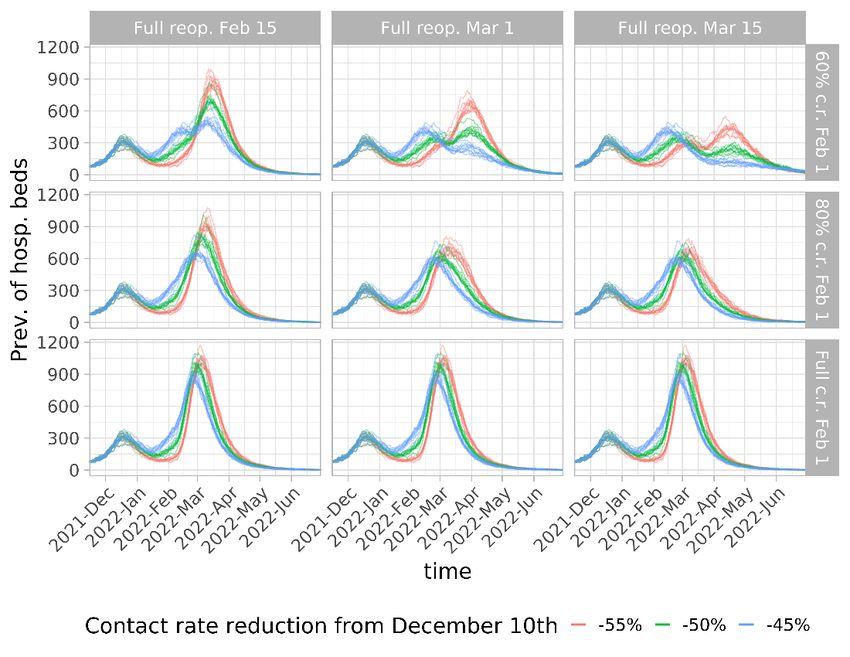
Results
We present results of the spread of the Omicron and Delta variants for each scenario consisting of 100
stochastic simulations over the period between December 27, 2021, and July 1, 2022.
Future changes in interventions for reopening

Figure 1A: Daily incidence of hospitalizations until 1st of July 2022, for different reopening scenarios.
The colours define the three levels of interventions implemented in December 2021, namely 55%, 50%
and 45% reduction in the transmission rate.
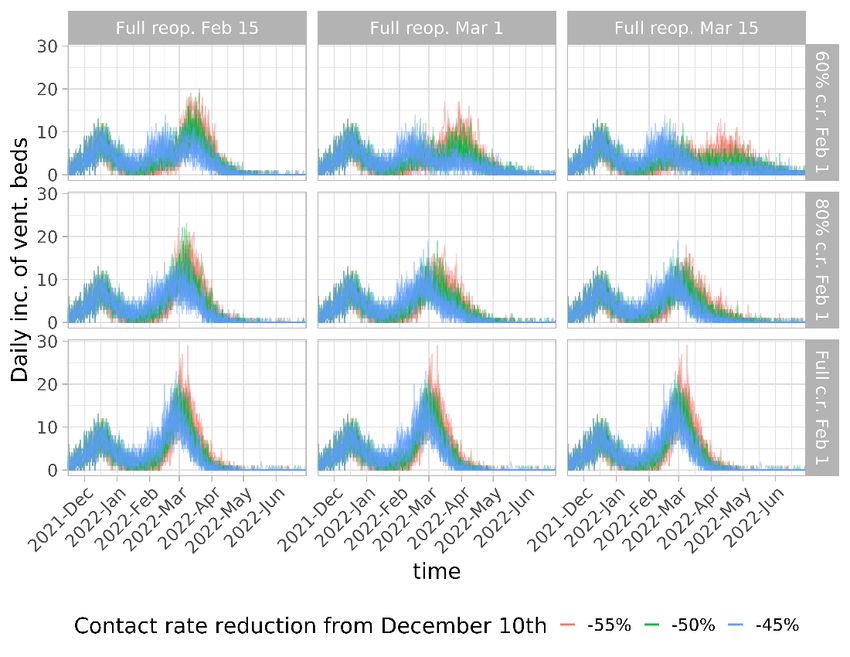
Figure 1B: Daily prevalence of hospitalized people until 1st of July 2022, for different reopening
scenarios. The colours define the three levels of interventions implemented in December 2021,
namely 55%, 50% and 45% reduction in the transmission rate.
Figure 1C: Cumulative number of hospitalized people until 1st of July 2022, for different reopening
scenarios. The colours define the three levels of interventions implemented in December 2021,
namely 55%, 50% and 45% reduction in the transmission rate.

Figure 2A: Daily incidence of infections until 1st of July 2022, for different reopening scenarios. The
colours define the three levels of interventions implemented in December 2021, namely 55%, 50%
and 45% reduction in the transmission rate.
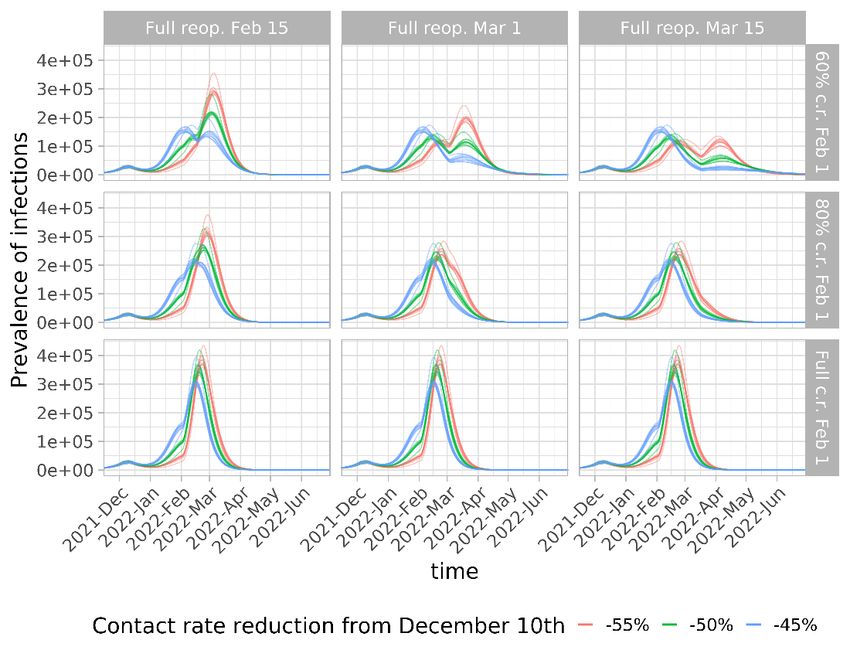
Figure 2B: Daily prevalence of infections until 1st of July 2022, for different reopening scenarios. The
colours define the three levels of interventions implemented in December 2021, namely 55%, 50%
and 45% reduction in the transmission rate.
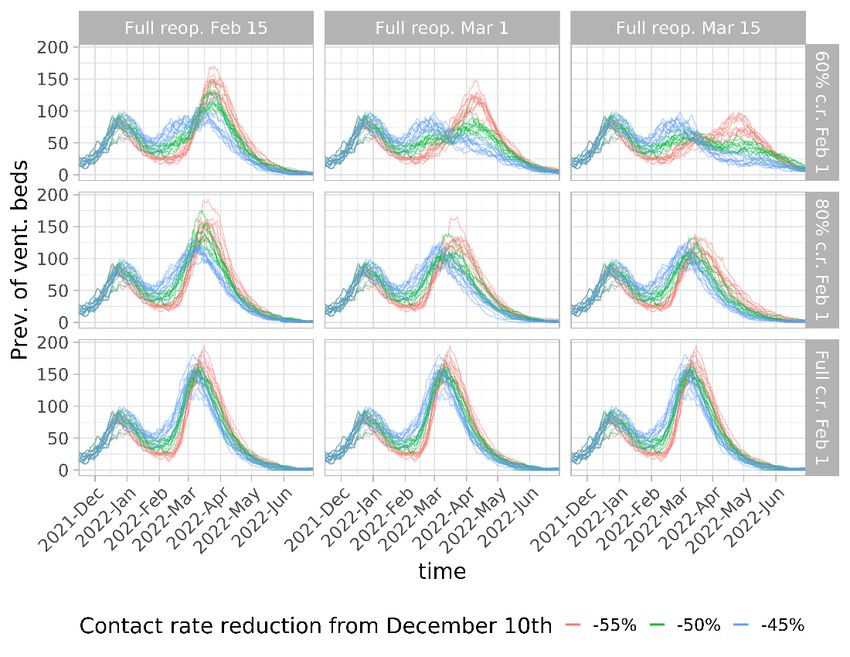
Figure 2C: Cumulative number of infections until 1st of July 2022, for different reopening scenarios.
The colours define the three levels of interventions implemented in December 2021, namely 55%, 50%
and 45% reduction in the transmission rate.

Figure 3A: Daily incidence of ventilator beds until 1st of July 2022, for different reopening scenarios.
The colours define the three levels of interventions implemented in December 2021, namely 55%, 50%
and 45% reduction in the transmission rate.
Figure 3B: Daily prevalence of ventilator beds until 1st of July 2022, for different reopening scenarios.
The colours define the three levels of interventions implemented in December 2021, namely 55%, 50%
and 45% reduction in the transmission rate.
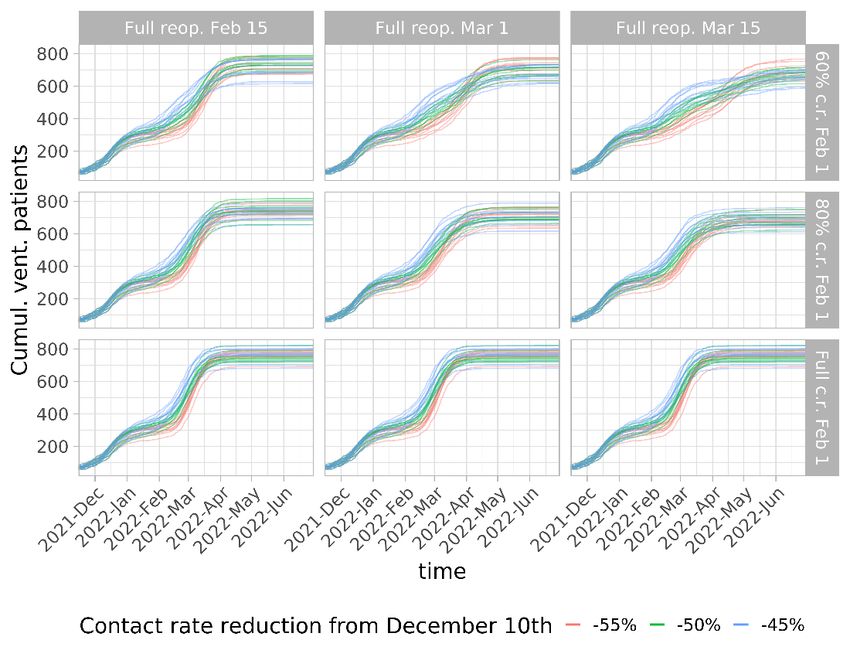
Figure 3C: Cumulative number of patients on ventilator treatment until 1st of July 2022, for different
reopening scenarios. The colours define the three levels of interventions implemented in December
2021, namely 55%, 50% and 45% reduction in the transmission rate.
Uncertainties, limitations and assumptions
  1. One of the main uncertainties in the simulations is represented by the epidemiological profile of
     the omicron variant. In particular, the intrinsic transmissibility, severity and the capacity to
     escape vaccine protection are currently uncertain and different assumptions have a decisive
     impact on the future omicron epidemic.
  2. Due to the uncertainty about intervention-induced and spontaneous, self-regulating behavioural
     changes in the population as well as properties of the virus and effect of vaccines, the results are
     very uncertain.
  3. There are clear indications that omicron is significantly less severe than delta. In this report, we
     assume that omicron has a 70% reduced infection hospitalisation risk compared to delta.
     However, it is as yet unclear how vaccination protection against severe disease plays into this.
     We currently assume that the vaccines give the same protection against severe disease,
     conditional on infection, for Omicron as Delta. It could be that the intrinsic IHR of omicron is
     even less compared to Delta, but that the vaccines lose some of their protective effect against
     severe disease compared to Delta. If so, the consequence could be that we are somewhat
     overestimating the increased protection gained from additional vaccination with first, second or
     third doses. We will revise the assumptions when the data allows.
  4. The model simulates the spread of two strains, Omicron and Delta variant. We assume that
     individuals infected with Omicron gain lifelong protection against COVID-19 reinfection by any
     strain, and that this immunity does not wane over time. Delta cases can be reinfected with the
     Omicron variant. The level of susceptibility to Omicron of previously infected Delta cases is very
     uncertain.
  5. The estimated prevalence of patients in hospital and on ventilator treatment depend on the
     assumed length of stay (LOS). The length of stay of omicron cases is still uncertain, but we have
     now assumed a shorter length of stay.
  6. The model takes into account differences in the vaccine distribution at the municipality and age
     level based on current Norwegian data. However, we do not consider the effect of clustering of
     unvaccinated individuals within households or in social mixing in the public setting. Small groups
     in the community with low vaccine coverage, might lead to the emergence of local outbreaks.
  7. Assumptions about vaccine effects and vaccine deliveries are uncertain. The policy of
     vaccinating the population has been changing these days. The available number of 1st, 2nd and
     3rd doses are 100 000, 100 000 and 400 000 per week, i.e., 14 286, 14 286 and 57 143 per day in
     this report.
  8. There is a lack of data about the current level of adherence to control measures, such as home
     isolation and household quarantine. We run the baseline scenarios in the model assuming a 70%
     proportion of home isolation among symptomatic cases with the consequent quarantine of
     family members. Adherence to home isolation is kept constant throughout each run. In reality,
     this parameter as other intervention-related parameters might change in time, depending on
     the evolution of the pandemic and future changes in the infection-control policies. Note that we
     do not include lifting quarantine (i.e., in principle 0%) according to the latest updated policy
     announced on 24th Jan 2022. It is reasonable to believe that the mandate for daily tests that
     replaces quarantine, will retain approximately the same effect as a quarantine.
9. Specific measures that are not explicitly modelled, such as school closures, changes in home
office policies, use of face masks are now reflected by the overall intervention effect as one
parameter reducing the transmission rate.
10. The relative importance of transmission by asymptomatic and pre-symptomatic individuals is
not well known, and these factors significantly impact the transmission dynamics in the model.
11. We assume that Omicron has the same generation time as Delta.
Calibration of the transmission parameters
We use data on the total incidence of hospitalization and age-specific number of cumulative
hospitalizations, and on the fraction of Omicron cases over time to calibrate the transmission rates of
the Delta and Omicron variant.
Using total incidence of hospitalizations
Hospital incidence is first used to calibrate the transmission rate (β) before the interventions in
December. This provides the contact rate for the early phase of the simulations and the contact rate for
full reopening. We then use the hospital incidence after mid-December to estimate the effect of the
interventions. We find that 3 different values for the effect of the interventions (55%, 50%, and 45%
reduction on 10th Dec 2021) capture the hospital incidence from 15th Dec 2021 to 15th Jan 2022.
Figure 4A. Fit of hospital incidence with a 45% reduction in contact rate. No reopening, i.e. increase of
the contact rate in 2022, is assumed here.Figure 4B: Fit of hospital incidence with a 50% reduction in contact rate. No reopening, i.e. increase of
the contact rate in 2022, is assumed here.
Figure 4C. Fit of hospital incidence with a 55% reduction in contact rate. No reopening, i.e. increase of
the contact rate in 2022, is assumed here.Using age-specific cumulative hospitalization We adjusted the susceptibility of the older populations to match the age-profile of hospitalized people. These adjusted susceptibilities capture changes in behavioral dynamics such as reductions of the contact rates in the community and higher levels of precaution among elderly occurring during a rapid increase of infections, as recently observed in Norway. Figure 5: the age distribution of cumulative hospitalization of both data and model output. Using fraction of Omicron cases Finally, we calibrated the transmissibility advantage of Omicron over Delta by fitting the take-over curve of Omicron cases over Delta cases, as shown in the figure below.
Figure 6: Fraction of Omicron cases among reported cases.

Parameters of severity and hospitalization
There are different factors defining the burden on the hospital settings in terms of hospitalizations and
length of stay in hospital. Here we list the main parameters and sources that we used in this report for
the Delta and Omicron variant.

First, we use 6 distributions of non-vaccinated people due to Delta infection parametrized using
Norwegian data from the 2nd half of 2021. Tables 1-6 show the parameters of the following distributions:

    •   Time from symptom onset to hospitalization
    •   Length of stay (LOS) in hospital, without ventilator treatment
    •   Time from hospitalization to ventilator treatment
    •   Length of stay (LOS) in ventilator treatment
    •   Time in hospitalization after ventilator treatment
    •   Proportion of ventilator treatment (i.e. probability of ventilator treatment)

Second, we take into account the VE against hospitalization, ventilator treatment and the corresponding
LOS for Delta cases (we assume the VE against Omicron is the same as Delta). The probability or LOS is
lowered by the following factors:

    •   VE against hospitalization is time-dependent with linear increase and decrease (see figures in
        the previous report published on 12th Jan 2022).
    •   VE against ventilator treatment = 50% iii
• VE against LOS in hospital = 38% iii
• VE against LOS in ventilator treatment = 0 (I.e., vaccination does not reduce the LOS in ventilator
treatment)
Third, we assume a reduced severity and the corresponding LOS of Omicron infection on both
vaccinated and non-vaccinated individuals. The probability of hospital admission and LOS are lowered by
the following factors:
• The risk of hospitalization is reduced by 70% iv
• The risk of ventilator treatment is reduced by 58%, based on Norwegian data.
• The LOS in hospital is reduced by 33%, based on Norwegian data.
• The LOS in ventilator is the same as Delta cases.
Table 1: Time from symptom onset to hospitalization. The time spent for each patient is drawn from
age-dependent negative binomial distributions. The values of the parameters reported in the table
(mean and size) have been estimated from Norwegian data.
Time from symptom onset to
Age group
hospitalization
Mean (days) Size
0-29 5.9 2.4
30-39 8.0 7920
40-49 8.3 550
50-59 8.7 886674
60-69 8.7 36
70-79 6.7 2.3
80+ 5.6 2.3
Table 2: Length of stay (LOS) in hospital. The time spent for each patient is drawn from age-dependent
negative binomial distributions. The values of the parameters reported in the table (mean and size)
have been estimated from Norwegian data.
Age group Length of stay (LOS) in hospital
Mean (days) Size
0-29 3.1 1.9
30-39 4.1 2.9
40-49 4.9 3.3
50-59 5.7 2.5
60-69 6.8 3.1
70-79 7.4 2.4
80+ 6.7 2.7
Table 3: Time from hospitalization to ventilator treatment. The time spent for each patient is drawn
from age-dependent negative binomial distributions. The values of the parameters reported in the
table (mean and size) have been estimated from Norwegian data.Time from hospitalization to
Age group
ventilator treatment
Mean (days) Size
0-39 1.9 1.2
40-49 2.2 0.9
50-59 2.1 1.1
60+ 2.8 1.1
Table 4: Length of stay (LOS) in ventilator treatment. The time spent for each patient is drawn from
age-dependent negative binomial distributions. The values of the parameters reported in the table
(mean and size) have been estimated from Norwegian data.
Length of stay (LOS) in ventilator
Age group
treatment
Mean (days) Size
0-39 8.6 1.5
40-49 12.6 0.9
50-59 17.7 0.8
60+ 16.9 1.0
Table 5: Time in hospitalization after ventilator treatment. The time spent for each patient is drawn
from age-dependent negative binomial distributions. The values of the parameters reported in the
table (mean and size) have been estimated from Norwegian data.
Time in hospitalization after
Age group
ventilator treatment
Mean (days) Size
0-39 6.7 4.4
40-49 8.9 2.2
50-59 8.8 2.7
60+ 8.5 1.3
Table 6: Probability of ventilator treatment. The values of the parameters reported in the table have
been estimated from Norwegian data.
Probability of
Age group ventilator
treatment
0-29 0.07
30-39 0.16
40-49 0.18
50-59 0.26
60-69 0.33
70-79 0.29
80+ 0.09Who contributed to this report
1. Francesco di Ruscio*1
2. Louis Yat Hin Chan*1
3. Jørgen Eriksson Midtbø*1
4. Gunnar Øyvind Isaksson Rø*2
5. Birgitte Freiesleben de Blasio*§
6. Karin Marie Nygård*
7. Preben Aavitsland*
8. Sara Watle*
9. Lene Kristine Juvet*
10. Karan Golestani*
11. Solveig Engebretsen^
12. Arnoldo Frigessi§$
13. Alfonso Diz-Lois Palomares*
14. Anja Bråthen Kristoffersen*
15. Kenth Engø-Monsen%
16. Jonas Christoffer Lindstrøm*
*Folkehelseinstittuttet, Norwegian Institute of Public Health
^Norsk Regnesentral, Norwegian Computing Centre
§Oslo Centre for Biostatistics and Epidemiology, University of Oslo
$Oslo Universitetssykehus, Oslo University Hospital
%Telenor Research
1These authors contributed equally to the modelling and writing of the report
2This author contributed methodology, analysis of data and writing of the report
i
Modelling scenarios for the SARS-CoV-2 Omicron VOC (B.1.1.529) in Norway, January-February 2022.
https://www.fhi.no/contentassets/e6b5660fc35740c8bb2a32bfe0cc45d1/vedlegg/nasjonale-og-regionale-
rapporter/modelling-scenarios-for-the-sars-cov-2-omicron-voc-b.1.1.529-in-norway-january-february-2022.pdf
ii
Svar på Oppdrag 58 – Om dose to til 12-15 åringer.
https://www.fhi.no/contentassets/3596efb4a1064c9f9c7c9e3f68ec481f/2022-01-07-svar-pa-oppdrag-58-om-
dose-to-til-12-15-aringer.pdf
iii
Whittaker, Robert, Anja Bråthen Kristofferson, Beatriz Valcarcel Salamanca, Elina Seppälä, Karan Golestani,
Reidar Kvåle, Sara Viksmoen Watle, and Eirik Alnes Buanes. "Length of hospital stay and risk of intensive care
admission and in-hospital death among COVID-19 patients in Norway: a register-based cohort study comparing
patients fully vaccinated with an mRNA vaccine to unvaccinated patients." medRxiv (2021): 2021-11.; doi:
https://doi.org/10.1101/2021.11.05.21265958
iv
Ny studie fra FHI: redusert risiko for sykehusinnleggelse med omikronvarianten.
https://www.fhi.no/nyheter/2022/ny-studie-fra-fhi-redusert-risiko-for-sykehusinnleggelse-med-omikronvariant/You can also read