Monthly Investment Compass - Charting The Course Of The Markets January 17th, 2020 - Asbury Research
←
→
Page content transcription
If your browser does not render page correctly, please read the page content below
Monthly Investment Compass
 Charting The Course Of The Markets

          January 17th, 2020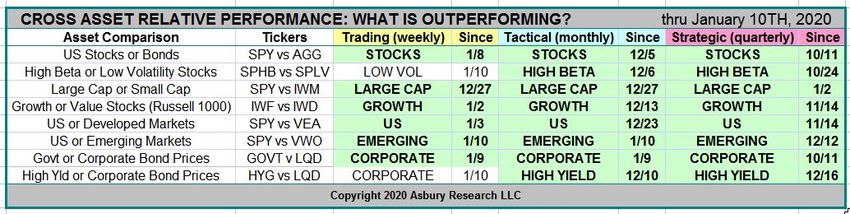
Monthly Investment Compass
                      1) Executive Summary: January 17th, 2020

•   U.S. Stock Market: The stock market begins 2020 in the midst of minor and major uptrends
    amid low interest rates, an increased appetite for risk by investors, strengthening overseas
    markets, and unmet near term targets another 4%‐5% above the market. However, the US
    market is also technically overextended according to a number of metrics and seasonality
    turns negative between now and the end of February. As long as our tactical models
    (Correction Protection Model, Asbury 6), retain their mid‐October Risk On status, investors
    can continue to “ride the wave” higher. Should our models reverse, however, we would view
    it as the potential beginning of an overdue – and potentially significant ‐‐ corrective decline.

•   Size: Large Cap (S&P 500) has very recently began outperforming Small Cap (S&P 600) on
    both a tactical (monthly) and strategic (quarterly) basis.

•   Style: As of Dec 20th the S&P 500 Growth ETF (SPYG) shifted back to a trend of quarterly
    relative outperformance versus the SPDR S&P 500 ETF (SPY). Growth stocks often outperform
    in healthy market environments as investors seek strong earnings growth.

•   Cross Asset: High Beta stocks, Emerging Markets, and High Yield Bonds are currently
    outperforming, suggesting an increased appetite for risk.
                                                                                                   1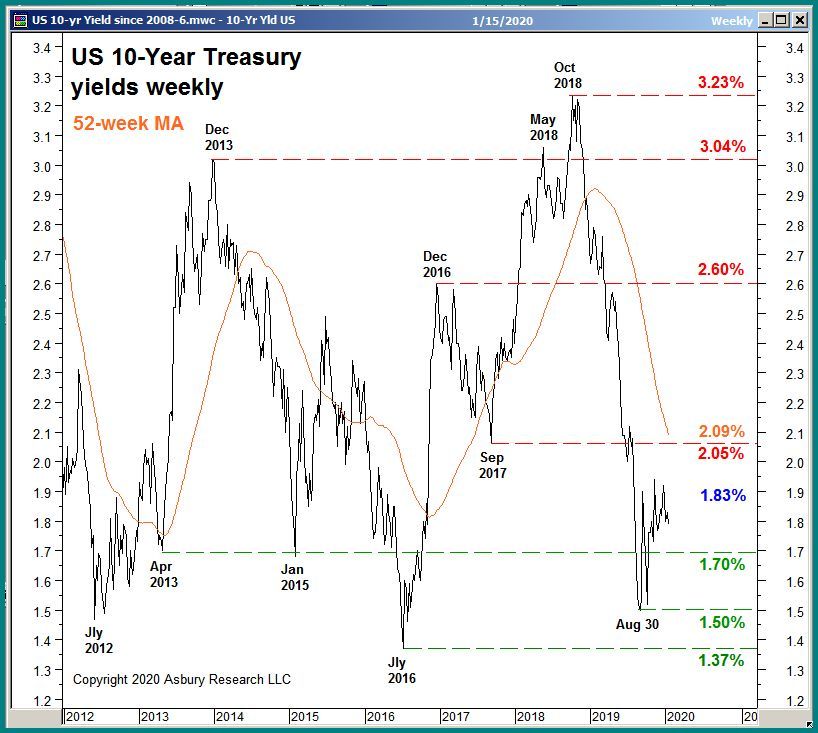
Monthly Investment Compass
                      2) Executive Summary: January 17th, 2020

•   Global Relative Performance: China, Russia, and Emerging Markets are currently
    outperforming the US.

•   US Market Sectors: The latest data in multiple time frames show a trend of inflows into
    Industrials and Technology, and a trend of outflows from Consumer Staples.

•   US Industry Groups: We currently have unmet upside targets in Biotech, Metals & Mining,
    Steel, and Insurance.

•   Individual Stocks & ETFs: We have existing long ideas in BFAM, JNK, and EWW, and a short
    idea in UNG.

•   US Interest Rates: The benchmark 10‐Year Treasury Note has been hovering at the 1.70%
    area since late August, but the latest asset flow data, seasonality, and a slightly steepening
    yield curve suggest modestly rising rates may be coming in early 2020.

                                                                                                     2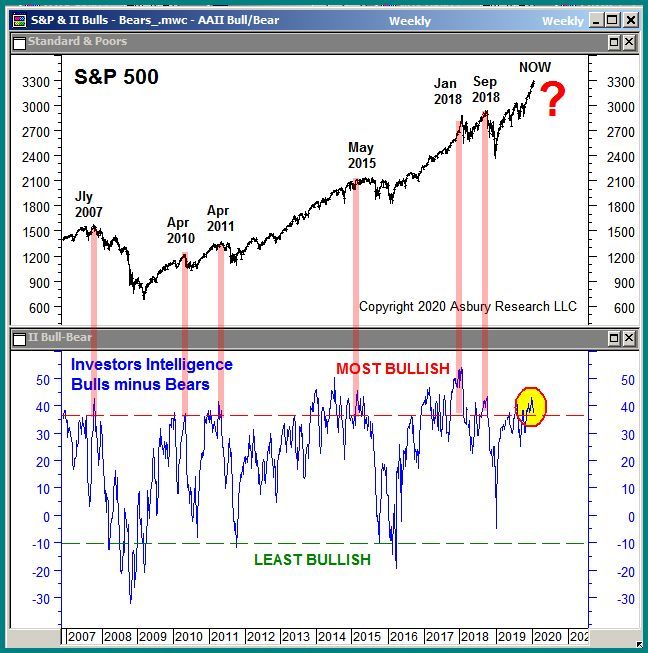
US Stock Market
   Price & Trend (1): Dow Industrials Meet Upside Target, Utilities Target 4% Rise

The bellwether Dow Industrials has just met Also this week, the Dow Jones Utility Avg
 our 29,200 upside target based on its Nov     has broken out higher from almost 4
   1st breakout from months of sideways     months of investor indecision. A sustained
            investor indecision.             rise above 882 targets a 4% rise to 930.
                                                                                     3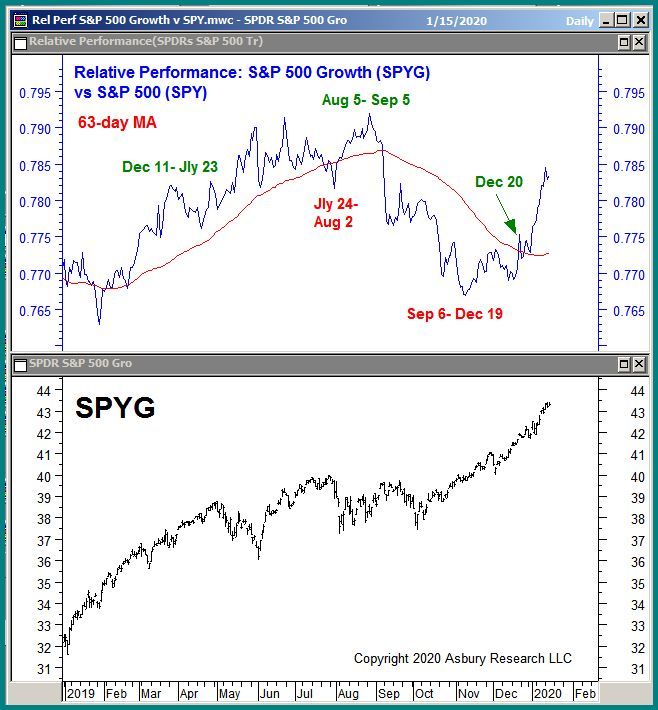
US Stock Market
 Price & Trend (2): Dow Transports Target 4% Rise, Watch Minor Support In SPX

The Dow Transports are also breaking out   The minor uptrend in the benchmark S&P
from 9 months of sideways indecision. A    500 is valid above 3168‐3154, which is 4%
 sustained move above 11,148 targets a     below the market. Major support is 10%
  4% rise to retest the Sep 2018 highs.            below the market at 2990.
                                                                                  4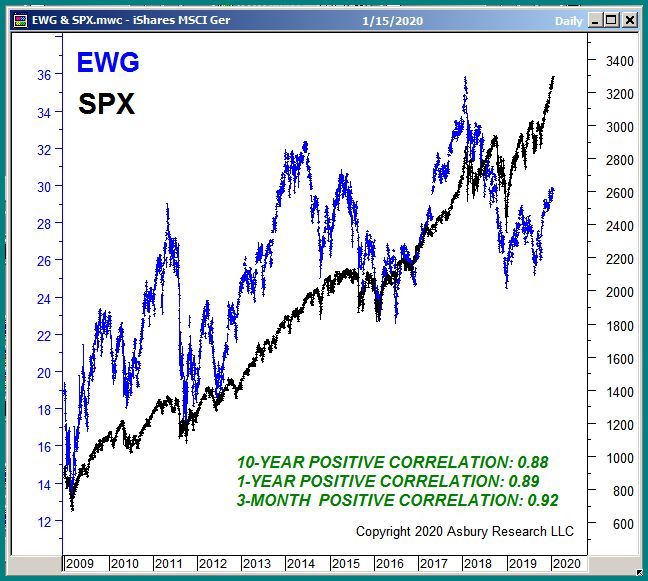
US Stock Market
   Influential Stocks: US Market Bellwethers WMT, FB Target 13%, 33% Rise

 Market bellwether Walmart rose by 11%        Tech bellwether Facebook’s December
 since resuming its 2015 advance in June        breakout from 1 ½ years of investor
2019, and targets another 7% rise to $130.     indecision targets a 33% rise to $295.
   Positively correlated to the S&P 500.     Also positively correlated to the S&P 500.
                                                                                      5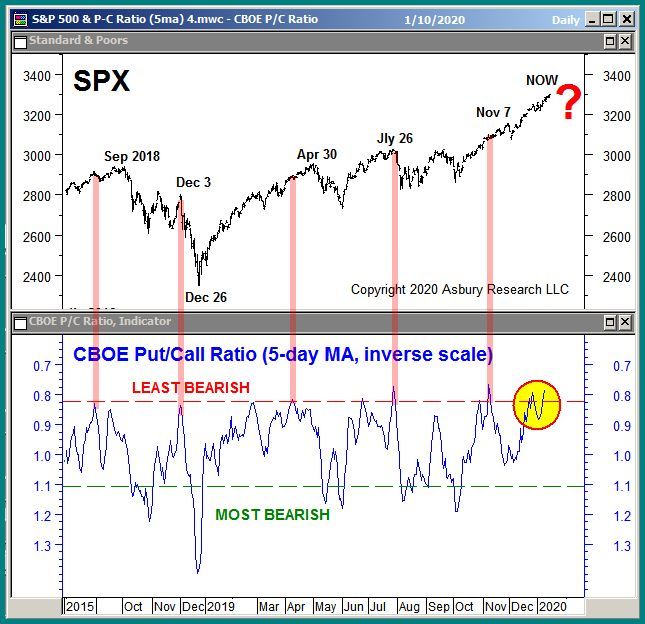
US Stock Market
   Intermarket Analysis (1): Germany ETF Targets Additional 5% Advance

  The iShares MSCI Germany ETF has         The tight and stable long term positive
   already risen by 7% since its mid       correlation between EWG and the S&P
October breakout higher, and targets an   500 suggests that as goes Germany, so is
      additional 5% rise to 31.25.            likely to go the US broad market.
                                                                                     6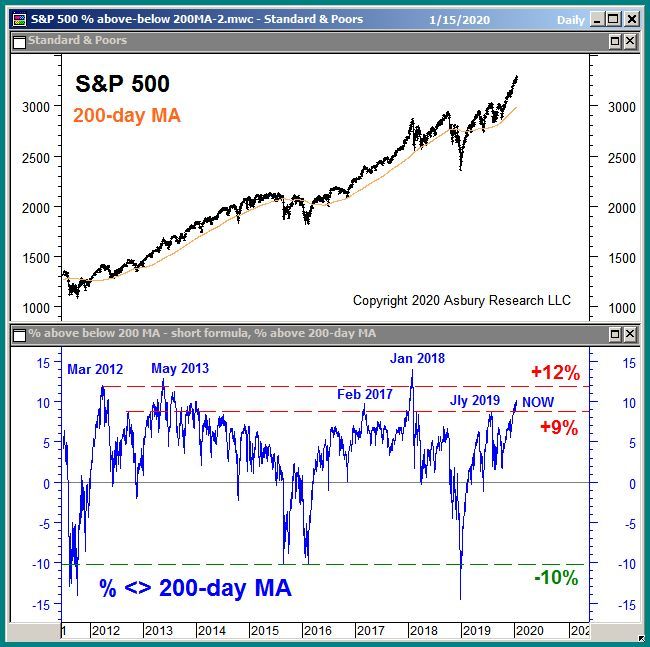
US Stock Market
     Intermarket Analysis (2): United Kingdom ETF Targets 8% Advance

The SPDR iShares MSCI United Kingdom        The tight and stable long term positive
ETF has already risen by 6% since its mid   correlation between EWU and the S&P
October breakout higher, and targets an     500 suggests that as goes The UK, so is
      additional 8% rise to 36.50.             likely to go the US broad market.
                                                                                      7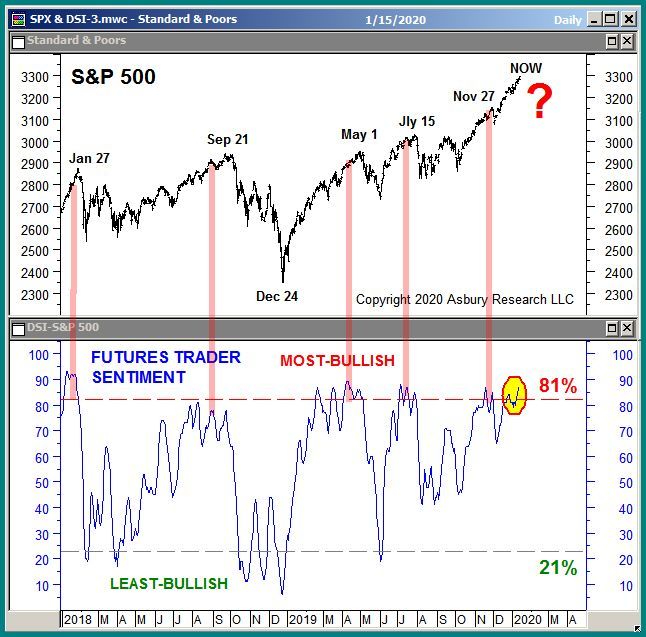
US Stock Market
    Intermarket Analysis (3): Australia ETF Targets Additional 4% Advance

    The iShares MSCI Australia ETF has        The tight and stable long term positive
already risen by 3% since the late October    correlation between EWA and the S&P
   resumption of its 2019 advance, and       500 suggests that as goes Australia, so is
  targets an additional 4% rise to 24.25.        likely to go the US broad market.
                                                                                          8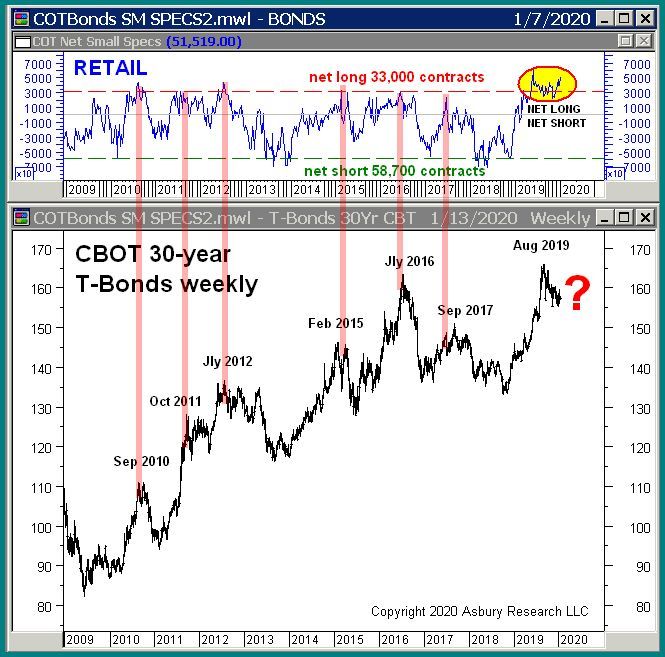
US Stock Market
   Trade Ideas (1): BFAM Targets Another 4% Rise, UNG Targets 15% Decline

Bright Horizons’ mid November resumption    The United States Natural Gas Fund’s
   of its 2019 advance has triggered a 9%  (UNG) Nov 27th breakdown triggered an
  advance and targets another 4% rise to   11% downturn and targets another 15%
         $168.28. Asbury Value idea.      decline to 14.25. Asbury Momentum idea.
                                                                                9
US Stock Market
Trade Ideas (2): JNK Targets 1% Advance, Mexico Index Targets 17% Rise
The SPDR Bloomberg Barclays High Yield The iShares MSCI Mexico Capped ETF’s
Bond ETF’s Dec 12th resumption of its 2019 Dec 16th breakout higher targets an
advance targets another 1% rise to 111.50. additional 17% rise to $54.50.
Positively correlated to the S&P 500. Asbury Momentum idea.
10Asbury’s Correction Protection Model (CPM)
When To Be Invested
Purpose & Key Features
• Protects investors against significant market
declines
• without sacrificing long term performance
under a variety of market conditions,
• while greatly reducing market risk as
measured by actual time invested and by
volatility of returns (low beta).
Performance Highlights Since 2011
• CPM has averaged 5 signals per year.
• CPM has only been in the market 65% of the
time, significantly reducing risk.
• The table at left shows that CPM has
outperformed the S&P 500 in 4 of the past 9
years.
11Asbury’s Correction Protection Model (CPM)
”Risk On” As Of October 17th 2019
About CPM CPM Since 2019
• The Correction Protection Model (CPM) is our
own proprietary defensive model for the S&P
500. It is quantitative, objective, and data driven.
• CPM is binary: it is either Risk On or Risk Off.
• CPM is not a returns‐driven model, but rather a
wealth preservation tool. It was designed to
protect investor assets during potentially
dangerous market conditions while also taking
advantage of the market’s historical upward bias.
• We use CPM as a key indication of when to
increase market exposure (Risk On) and when to
be risk‐averse (Risk Off).
12The Asbury 6 Key Market Internals
When To Be Invested
The Asbury 6: “A6” Signals Since Late 2018
• the monthly rate of change in the
S&P 500
• the relative performance of
equity prices versus high yield
bond prices,
• investor asset flows
• corporate bond spreads
• trading volume
• market breadth
13The Asbury 6 Key Market Internals
Positive Since October 15th 2019
When all Asbury 6 are positive, market
internals are the most conducive to adding risk
to portfolios.
Each negative reading adds an additional
element of risk to participating in existing or
new investment ideas.
14The Asbury 6 Key Market Internals
Momentum: Near Term Positive
SPX’s 1‐month rate of change, a near term momentum gauge, has been positive
(bullish) since October 21st and will remain so above 3221 to 3191.
15The Asbury 6 Key Market Internals
Relative Performance: Near Term Positive
The rightmost green highlights show the S&P 500 (SPY) turned back to a trend of
monthly relative outperformance versus junk bond prices (JNK) on October 11th.
This has historically coincided with near term strength in the S&P 500.
16The Asbury 6 Key Market Internals
ETF Asset Flows: Near Term Positive
The total net assets invested in the SPDR S&P 500 ETF moved back to a trend of
monthly expansion on October 14th, characteristic of market advances.
17The Asbury 6 Key Market Internals
Corporate Bond Spreads: Near Term Positive
High yield corporate bond spreads shifted back to a trend of monthly narrowing on
December 4th. Narrowing indicates the bond market is becoming more complacent
about the economy and has historically been coincident with stock market advances.
18The Asbury 6 Key Market Internals
Volume: Near Term Positive
On Balance Volume (OBV) has been above its 21‐day moving average since
October 17th, indicating a trend of monthly expansion that has historically been
characteristic of near term stock market advances.
19The Asbury 6 Key Market Internals
Market Breadth: Near Term Positive
The NYSE Composite’s A/D line has been above its 21‐day MA since October 11th,
indicating a monthly trend of strengthening market breadth that has
historically coincided with near term broad market advances.
20US Stock Market
Volatility: Near Term Positive
The CBOE Volatility Index (VIX) has recently edged back below its 21‐day MA,
indicating a monthly decline in volatility that has historically coincided with stock
market advances. However, the VIX is also hovering just above an historic low of
11.22, which warns of an upcoming US stock market peak. 21US Stock Market
Options Volume: Near Term Negative
The CBOE Put/Call Ratio is currently hovering at least bearish extremes, indicating an
historically low ratio of put volume versus call volume. Similar extremes have
coincided with or closely led most of the near term peaks in the S&P 500 since 2015.
22US Stock Market
Strategic Momentum: Intermediate Term Negative
SPX is currently 10% above its 200‐day MA, which puts it at an over‐extended extreme
that it has previously been reached only a half‐dozen or so times since 2012. This is a
strategic indication that the 2019 advance is historically over‐extended.
23US Stock Market
Investor Sentiment: Intermediate Term Negative
A survey of retail futures traders has A survey of stock market newsletter
reached previous most bullish extremes that writers is also hovering at similar most
have historically coincided with or led bullish extremes that have often led
intermediate term market peaks. intermediate to long term market peaks.
24US Stock Market
Overbought/Oversold: Near Term, Intermediate Term Negative
SPX is hovering at monthly overbought Meanwhile, SPX is also hovering at
extremes that have historically coincided quarterly overbought extremes that have
with or led near term broad market historically coincided with or led
declines. intermediate term broad market declines.
25US Stock Market
Seasonality: Near Term Negative, Intermediate Term Positive
This annual chart shows that January and This quarterly chart shows SPX seasonally
February represent a 2‐month seasonal peaks for the 1st Quarter during the first
decline in the S&P 500, based on data week of January before weakening into
since 1957, that leads into March‐April late February.
strength.US Stock Market
Style: Recent Outperformance By Growth As Risk Appetite Increases
On Dec 20th the S&P 500 Value ETF (SPYV) shifted back to a trend of quarterly relative
outperformance versus the SPDR S&P 500 ETF (SPY). Growth stocks often outperform
in healthy market environments as investors seek strong earnings growth.
27Relative Performance
Cross Asset Investing: Increasing Appetite For Risk
The table above highlights which segments of the US financial market are outperforming in both equities
and fixed income. The green highlights identify changes in trend, and the date they occurred, in 3 different
time frames:
•TRADING (weekly, yellow column), which is the most sensitive to changes in relative market direction,
•TACTICAL (monthly, blue column), which we use to enter or exit an investment strategy, and
•STRATEGIC (quarterly, red column), which we use to identify intermediate term opportunity.
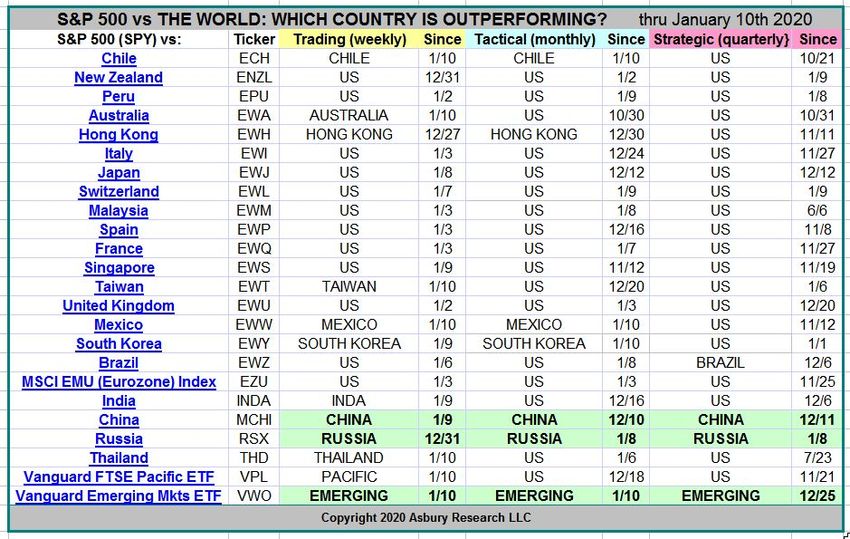
28Global Stock Markets
Global Relative Performance: The US vs. The World
Just 3 of the 24 global equities markets we track
are currently outperforming the S&P 500.
29US Market Sectors: Tactical Asset Flows
Investor Assets Moving Into Industrials & Technology,
Out Of Consumer Staples
Trends in investor asset flows across multiple time periods typically coincide with, and
often lead, directional moves in outright and relative sector performance.
The latest data in multiple time frames show a trend of inflows into Industrials and
Technology, and a trend of outflows from Consumer Staples.
30US Market Sectors: Long Term Asset Flows
Energy, Materials Under‐Invested. Cons Discretionary, Health Care Over‐Invested.
This chart shows the historic daily average This chart shows the current distribution of
distribution of assets invested in the original 9 these assets through November 14th.
Sector SPDR ETFs since the series began in The most under‐invested sectors are 1) Energy,
June 2006. 2) Materials, and 3) Utilities.
The most over‐invested sectors are
1) Consumer Discretionary, 2) Health Care, and
3) Technology.
31US Market Sectors & Industry Groups
Asbury Research’s Current Price Targets
The green highlights indicate ETFs with positive (bullish) price targets.
The red highlights indicate ETFs with negative (bearish) price targets.
32US Market Sectors & Industry Groups
Materials, Biotech Target 5%, 23% Advances
The SPDR Materials Sector ETF’s Nov 4th The SPDR S&P Biotech ETF’s Nov 22nd
resumption of its 2019 advance targets breakout from investor indecision has
an additional 5% rise to 63.70. already resulted in a 10% advance, and
Positively correlated to the S&P 500. targets an additional 23% rise to 118.50.
33US Interest Rates
10‐Year Treasury Yields Testing Pivotal 1.70%, 2s/10s Curve Steepening?
Since July 2019 the benchmark US 10‐Year The 2s/10s yield curve has avoided inversion
Note has been situated between 2.06% and as of Nov 8th has moved back above its
and 1.50%. The next significant move in 52‐week moving average. Emerging major
these yields is likely to begin here. steepening trend?
34US Interest Rates
Trader Positioning, Seasonality Support An Upcoming Rise In Yields
January through April represents a
period of gradually increasing seasonal
Retail futures traders are hovering at a strength in the yield of the 10‐Year Note
10‐year most bullish extreme on 30‐year that, based on data since 1957, includes
T‐Bonds that has historically coincided 3 of the 4 strongest months of the year.
with important peaks in price.
35Contact Us:
Phone: 1‐888‐960‐0005
Email: info@asburyresearch.com
On The Web: https://asburyresearch.com/You can also read