Motivational system modulates brain responses during exploratory decision making
←
→
Page content transcription
If your browser does not render page correctly, please read the page content below
www.nature.com/scientificreports
OPEN Motivational system modulates
brain responses during exploratory
decision‑making
Chia‑Wei Li1, Carol Yeh‑Yun Lin2*, Ting‑Ting Chang3,4, Nai‑Shing Yen3,4 & Danchi Tan5
Managers face risk in explorative decision-making and those who are better at such decisions can
achieve future viability. To understand what makes a manager effective at explorative decision-
making requires an analysis of the manager’s motivational characteristics. The behavioral activation/
inhibition system (BAS/BIS), fitting the motivational orientation of “approach” or “avoidance,” can
affect individual decision-making. However, very little is known about the neural correlates of BAS/BIS
orientation and their interrelationship with the mental activity during explorative decision-making.
We conducted an fMRI study on 111 potential managers to investigate how the brain responses of
explorative decision-making interact with BAS/BIS. Participants were separated into high- and low-
performance groups based on the median exploration-score. The low-performance group showed
significantly higher BAS than that of the high-performance group, and its BAS had significant negative
association with neural networks related to reward-seeking during explorative decision-making.
Moreover, the BIS of the low-performance group was negatively correlated with the activation of
cerebral regions responding to risk-choice during explorative decision-making. Our finding showed
that BAS/BIS was associated with the brain activation during explorative decision-making only in the
low-performance group. This study contributed to the understanding of the micro-foundations of
strategically relevant decision-making and has an implication for management development.
Organizations need both exploitation and exploration in order to survive and prosper in changing
environments1–3. Exploitation involves maintaining or improving existing processes4. Exploration involves a
pursuit of new knowledge that often leads to radical innovation. It thus prevents organizations from becoming
trapped in suboptimal stable equilibria5. However, compared to exploitation, exploration yields return that are
often lower6, systematically less certain, and more remote in time. Given that exploration is needed for organi-
zations to achieve “future viability”7, it is important to understand why some individuals are good at making
explorative decisions while others are not.
Researchers suggest that an individual’s cognitive and motivational characteristics may influence how they
make explorative d ecisions4,8. For example, it has been found that a person with an entrepreneurial mind-set
values uncertainty in the marketplace and continuously explores opportunities with the potential to lead to
important innovations9. That is, entrepreneurs embrace uncertainty and their exploration begins with the moti-
vation to discover new opportunities10.
In this paper, we investigate why some individuals showed low or high performance at making explorative
decision and how the performances are related to their motivational systems. We draw on the motivational scale
of the behavioral activation system (BAS) and the behavioral inhibition system (BIS) developed by Carvers and
White in 1994. BAS/BIS has been widely used in education, psychology and organizational behavior research,
though less so in entrepreneurship studies11. It is a commonly used instrument in assessing an individual’s
approach or avoidance behavior, as BAS examines appetitive motives to move toward something desired, and
BIS examines aversive motives to move away from something unpleasant11. Prior research shows that BAS is
correlated with both enterprising interest and confidence, whereas BIS is negatively correlated with indifferent
responses, realistic interests, and approach under u ncertainty12. Accordingly, an individual’s motivation orienta-
tion of approach or avoidance may influence their exploration and exploitation decision-making and consequen-
tial performance. Specifically, people characterized by approach (BAS) motivation may be keen on exploring
1
Department of Radiology, Wan Fang Hospital, Taipei Medical University, Taipei, Taiwan, ROC. 2Department of
Business Administration, National Chengchi University, Taipei, Taiwan, ROC. 3Research Center for Mind, Brain &
Learning, National Chengchi University, Taipei, Taiwan, ROC. 4Department of Psychology, National Chengchi
University, Taipei, Taiwan, ROC. 5Department of International Business, National Chengchi University, Taipei,
Taiwan, ROC. *email: yehyunln@nccu.edu.tw
Scientific Reports | (2021) 11:15810 | https://doi.org/10.1038/s41598-021-95311-0 1
Vol.:(0123456789)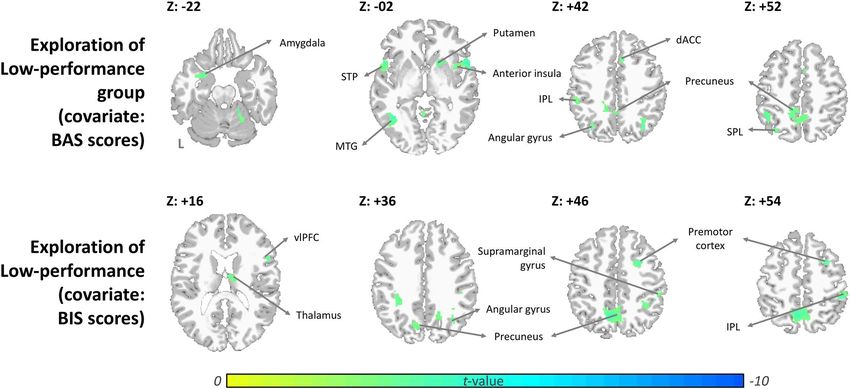
www.nature.com/scientificreports/
new information (exploration), while those characterized by avoidance (BIS) motivation may be satisfied with
current rewards and avoid trying new ways of doing things (exploitation). Therefore, the motivational orientation
of “approach” (BAS) or “avoidance” (BIS) may be used to predict what type of person is a better fit for a particu-
lar type of task or decision context. That is, investigating the relationship between BAS or BIS orientation and
exploration performance may serve as a good point of reference for strategic talent deployment in organizations.
Functional MRI (fMRI) enables researchers to investigate the profile of brain responses by depicting the
hemodynamic response associated with brain activity invasively. This technique has been used to investigate
mental motivational decision-making and management4,6,13,14. Daw et al.13 suggest that exploitation requires
the engagement of the neural circuits associated with the self-reward system whereas exploration involves a
higher-level of the cognitive control brain network13. Krug et al. used fMRI to investigate mental activity during
decision-making under uncertainty14. They report a network comprised of the supplementary motor cortex,
anterior cingulate cortex, right prefrontal cortex, insula, and precuneus. The above circuits are correlated to the
uncertainty acceptance condition while right middle frontal cortex is correlated to the uncertainty avoidance
condition. Laureiro-Martinez et al.4. are the pioneers in applying fMRI technique in management research and
in investigating the relationship of attention control and decision-making performance from the perspective of
the exploitation-exploration dilemma6. In their 2014 paper, they used fMRI and the “four-armed bandit” task to
investigate the efficiency of strategy between managers and entrepreneurs4. Compared with managers, entrepre-
neurs exhibited higher decision-making efficiency with stronger activity in regions of the frontopolar cortex asso-
ciated with explorative choice. Activity across seven brain networks previously linked to exploit/explore tradeoffs
explained individual differences in choice efficiency. In their follow-up study6, they used fMRI to examine 63
expert decision makers with respect to their cognitive processes and found that exploitation activates regions
associated with reward seeking which track and evaluate the value of current choices, while exploration relies
on brain regions associated with attentional control which track the value of alternative choices. These previous
efforts have identified the activity of fronto-insular- parietal networks during exploration. However, whether and
how these networks are associated with approach and avoidance personality characteristics are still unknown.
In this study, we aimed to investigate why some individuals showed high performance at making explorative
decisions and to find out the relationship between BAS/BIS and the individual’s mental activity stimulated during
explorative decision-making in high- and low-performance groups. For this purpose, we used fMRI to assess
111 students (potential managers) from a renowned university in a “four-armed bandit” task and to examine
the correlation between individual’s mental activity and BAS/BIS during exploitative and explorative decision-
making. To achieve higher scores in this task, participants were instructed to choose between foreseeable stable
rewards (exploitation) or to bet on a long-term larger gain under uncertainty (exploration). We first investigate
the mental activation during exploitation and exploration decisions-making, predicting that exploitation will
be associated with the self-reward system whereas exploration will involve the cognitive control brain network,
according to Daw et al.13 study. We then investigate how cerebral circuits interact with BAS/BIS, expecting that
low BAS would associate with exploitation, whereas low BIS would show association with explorative decision
making, based on previous study that BAS personality tends to explore new information and BIS tend to be sat-
isfied with current rewards and taking exploitation approach. We further investigate how the mental activation
correlated with the BAS/BIS scores during explorative decision making.
Results
Overall brain responses. Our first step is to investigate overall brain responses of exploitation and explo-
ration decision-making. During each trial, the individual analysis was applied based on the events of explora-
tive decision making (choose a new option in the hope of a higher payoff) and exploitative decision making
(choose an uncertain but familiar option), according to the interpretation of Daw et al.13. At the group level, both
exploitation and explorative decision-making were associated with the activation of the middle frontal gyrus
(MFG), dorsolateral prefrontal cortex (dlPFC), ventrolateral prefrontal cortex (vlPFC), supplementary motor
area (SMA), ventromedial prefrontal cortex (vmPFC), inferior parietal lobule (IPL), superior parietal lobule
(SPL), vision-related areas, hippocampus, striatum, middle temporal gyrus (MTG), supramarginal gyrus, ante-
rior insula, anterior cingulate cortex (ACC), and sensorimotor areas (Fig. 1 and Table 1). Compared with exploi-
tation, explorative decision-making was associated with higher brain activity of the PCC, premotor cortex, SMA,
IPL/SPL, dlPFC, striatum, thalamus, frontopolar cortex (FPC), and angular gyrus. In contrast, exploitation was
associated with greater activations within vmPFC, vlPFC, and precentral gyrus relative to exploration. The acti-
vation maps during exploitative/explorative decision-making were used as masks for further data analysis.
High and low performance groups. As mentioned previously, we are interested in understanding why
people make good or poor explorative decisions. To address this question, we classified all participants into two
groups based on their median average score of performance of explorative decision-making, which is 48.86.
The high-performance group consists of 54 participants whose average explorative scores are higher than 48.86,
while the low-performance group consists of 57 participants whose explorative scores are lower or equal to 48.86.
Noted that the BAS score in the low-performance group was significantly higher than that of the high-perfor-
mance group (40.7 ± 3.8 of low-performance group and 39.0 ± 4.6 of high-performance group; p < 0.05) (Fig. 2a).
The numbers (frequency) of explorative decision-making in the low-performance group were also significantly
higher than those in the high-performance group (114.6 ± 44.4 of low-performance group and 80.7 ± 19.6 of
high-performance group; p < 0.001) (Fig. 2b). In addition, the BAS scores of the low-performance group were
positively correlated to the numbers of explorative decision-making (r = 0.27; p < 0.05), while the BAS scores of
the high-performance group did not have this pattern. The BIS scores of the two groups showed no significant
differences with the numbers of explorative decision-making.
Scientific Reports | (2021) 11:15810 | https://doi.org/10.1038/s41598-021-95311-0 2
Vol:.(1234567890)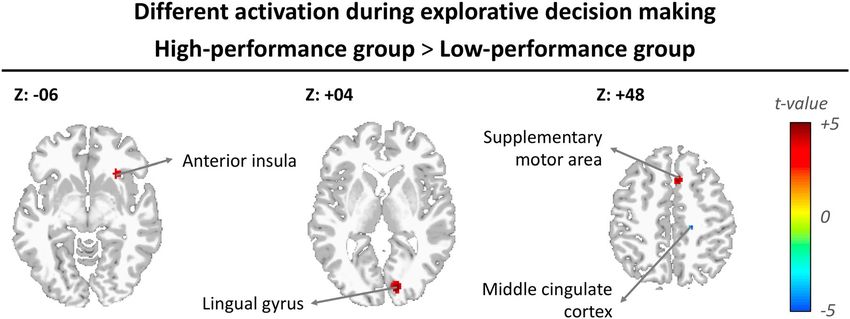
www.nature.com/scientificreports/
Figure 1. Activated brain areas while exploration and exploitation were performed. The threshold was set at
Alpha-shim corrected p < 0.05 for multiple comparisons (ACCanterior cingulate cortex, dACCdorsal anterior
cingulate cortex, dlPFC dorsolateral prefrontal cortex, FPC frontopolar cortex, IPL inferior parietal lobule, PCC
posterior cingulate cortex, SMA supplementary motor area, SPL superior parietal lobule, STP superior temporal
pole, vlPFC ventrolateral prefrontal cortex, vmPFC ventromedial prefrontal cortex).
Mental activities correlate with behavior results. In parallel with behavioral results, brain response
profiles of the high and low performance groups during explorative decision making were then examined. Com-
pared with the low-performance group, the high-performance group showed enhanced activity in the anterior
insula, SMA, and lingual gyrus (Fig. 3 and Table 2), as well as reduced activity in the middle cingulate cortex
during explorative decision-making.
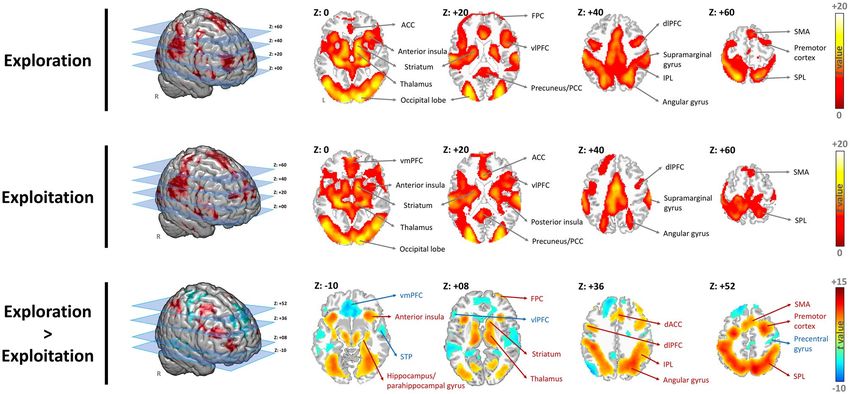
Afterwards, we investigated how BAS and BIS correlate with brain responses in the high- and low-perfor-
mance groups. In the low-performances group, the BAS score has a negative linear association with the activity
of the anterior insula, MTG, putamen, dACC, IPL/SPL, superior temporal pole (STP), angular gyrus, precuneus,
and amygdala (Fig. 4 and Table 3) during explorative decision-making; besides, the BIS score showed a negative
linear correlation with the activity of the premotor cortex, supramarginal gyrus, thalamus, IPL, vlPFC, angular
gyrus, and precuneus. By contrast, neither BAS nor BIS scores showed a linear association with cerebral activity
in the high-performance group during explorative decision-making.
To further check whether there is gender difference on behavioral and imaging data, we did a correlation
analysis and neural image analysis. Our findings are presented in Table 4 and the Supplementary Figs. S1, S2,
and S3. Table 4 showed that sex has a significant correlation with fMRI performance and exploration score.
Figures S1, S2, and S3 showed that the male group had similar activated regions as that of female group, though
the more cerebral regions are activated for the female group.
Discussion
The motivational orientation of “approach” or “avoidance” can affect individual decision-making. However, very
little is known about the neural correlates of BAS/BIS orientation and their interrelationship with the mental
activity during explorative decision-making. This study has examined the mental activation during exploita-
tion and exploration decisions-making; and investigated how the mental activation correlate with the BAS/BIS
scores of high- and low-performance groups during explorative decision making. We found that the parietal
and prefrontal cortical regions showed high activity during explorative/exploitative decision making, and that
the BAS/BIS scores had a correlation with the activation of the reward-associated network during explorative
decision-making.
In particular, our findings showed that the participants of the low-performance group made explorative
decisions more frequently in our “four-armed bandit” task; as an association, their BAS scores were significantly
higher than that of the high-performance group. Further, their BAS scores showed a negative linear association
with the activation of the reward-associated network, including the MTG, putamen, dACC, STP, and amygdala,
during explorative decision-making. Greater activities in the ACC, amygdala, and anterior cerebellar lobules
have been reported as associated with increased motivation and involvement of memory in processing the cued
reward during reward-anticipation and reward-gain15. Scholars proposed that the anterior insula detects salient
stimuli and coordinates neural r esources16,17. The STP is a node of the paralimbic system with strong connectivity
with the orbitofrontal cortex, striatum, insula, amygdala, and other emotion-related r egions18,19. As an associated
cortex, the STP enables multisensory integration and plays key roles in cognitive and socioemotional processing.
Thus, our finding of negative association with BAS and the reward-seeking network for the low-performance
Scientific Reports | (2021) 11:15810 | https://doi.org/10.1038/s41598-021-95311-0 3
Vol.:(0123456789)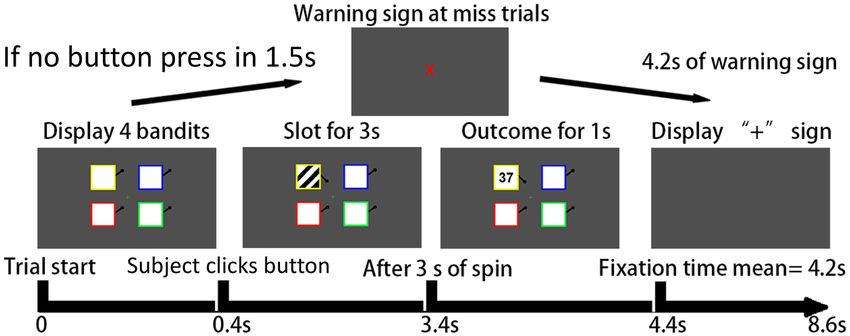
www.nature.com/scientificreports/
Peak coordinates
Volume information x y z t value Cluster (Voxels)
Exploration
Fusiform gyrus, middle temporal gyrus 30 − 72 − 10 20.36
Lingual gyrus − 12 − 90 − 10 18.62
Calcarine sulcus 14 − 92 −4 18.34
Hippocampus − 24 − 26 −8 18.06
Superior occipital gyrus 18 − 98 6 17.73
Middle occipital gyrus, Angular gyrus − 26 − 92 10 17.51
Thalamus, striatum 20 − 24 2 17.33
89,547
Precuneus, cuneus 22 − 92 12 16.91
Inferior parietal lobule, precuneus 32 − 52 50 15.26
Supramarginal gyrus − 60 − 22 16 15.06
Anterior insula, ventromedial prefrontal cortex 36 22 −4 14.66
Precentral gyrus, premotor cortex, supplementary motor area, dorsolateral prefrontal
48 6 28 14.66
cortex
Dorsal anterior cingulate cortex −2 24 26 12.33
Exploitation
Fusiform gyrus − 22 − 84 − 10 19.45
Hippocampus − 24 − 26 −8 17.45
Superior occipital gyrus 24 − 94 14 17.23
Middle occipital gyrus, Angular gyrus − 26 − 90 10 17.19
Calcarine sulcus 14 − 92 −4 16.95
Middle temporal gyrus − 48 − 68 2 14.97 90,107
Supramarginal gyrus, dorsolateral prefrontal cortex 64 − 18 22 14.97
Ventrolateral prefrontal cortex 48 34 −4 13.80
Posterior cingulate/precuneus −6 − 46 36 13.66
Dorsal anterior cingulate cortex, ventromedial prefrontal cortex 0 30 16 13.46
Posterior insula − 32 −6 10 12.47
Pons 2 − 38 − 34 4.80 99
Exploration > exploitation
12 − 68 50 12.43
Precuneus/posterior cingulate cortex
−8 − 68 50 10.20
− 38 − 34 44 11.99
Precentral gyrus, postcentral gyrus
− 48 − 34 54 10.14
32 − 50 46 10.89
Inferior parietal lobule
− 32 − 52 48 10.81
46,342
− 26 −6 52 10.48
Premotor cortex, dorsolateral prefrontal cortex
28 2 50 10.30
Superior parietal lobule − 20 − 66 58 10.36
Angular gyrus 32 − 58 42 10.23
− 32 22 −2 9.48
Anterior insula, striatum, hippocampus
32 24 0 9.16
Frontopolar cortex − 30 60 20 5.06 232
Posterior cingulate cortex 6 − 26 28 4.96 301
Inferior temporal gyrus − 32 6 − 32 4.36 91
Exploitation > exploration
Angular gyrus − 48 − 76 34 8.42
Middle occipital gyrus − 40 − 80 42 7.20
Middle temporal gyrus − 64 − 36 4 6.72
− 22 − 46 10 6.37 5643
Hippocampus (L), midbrain
− 24 − 16 − 22 5.41
Inferior temporal gyrus − 60 −8 − 22 5.64
Middle cingulate cortex − 12 − 14 28 5.42
Continued
Scientific Reports | (2021) 11:15810 | https://doi.org/10.1038/s41598-021-95311-0 4
Vol:.(1234567890)www.nature.com/scientificreports/
Peak coordinates
Volume information x y z t value Cluster (Voxels)
−4 38 − 12 8.41
Ventromedial prefrontal cortex
2 34 − 14 7.56
−6 24 −2 7.60
Anterior cingulate cortex
8 24 − 10 7.50 6316
Dorsolateral prefrontal cortex − 12 46 46 7.36
−2 56 20 6.23
Dorsomedial prefrontal cortex
2 58 20 6.22
Postcentral gyrus, precentral gyrus 14 − 36 72 6.78
Superior temporal gyrus/pole 68 − 20 6 6.46
2 − 28 60 6.32
Paracentral lobule
−4 − 26 66 5.40
Supplementary motor cortex 6 − 22 60 6.11 5863
Dorsolateral prefrontal cortex 54 −6 52 5.82
Precuneus −8 − 40 66 5.78
Inferior parietal lobule − 10 − 36 68 5.57
Premotor cortex 18 − 18 72 5.23
Caudate tail 20 − 36 20 6.49 445
Ventrolateral prefrontal cortex − 52 30 4 4.97 290
Precuneus/posterior cingulate cortex −4 − 46 38 4.90 361
Table 1. The activation during explorative and exploitative decision-making. Statistical significance was
thresholded at uncorrected p < 0.001 with a minimum cluster size of 77 voxels, which yielded an overall false
positive p < 0.05 as determined using Alpha-Sim for multiple comparisons correction.
Figure 2. (a, b) Bar graph of difference between high-/low-performance groups. (a) The BAS score of low-
performance group was significantly higher than that of high-performance group (p < 0.05). (b) The exploration
times of low-performance group was significantly more than high-performance group’s (p < 0.001).
group, suggests that too frequent explorative attempts may become blind trials that lead to low performance. In
comparison, the high-performance group, which made fewer explorative attempts, employed more calculated
and more effective exploration, and resulted in better performance.
In addition, for the low-performance group during explorative decision-making, the BIS scores showed a
negative relationship with the activation of the attention and risk-seeking networks, including the vlPFC, thala-
mus, precuneus/PCC, and IPL. Tobler et al. indicated the vlPFC showed selective decreased activity with variance
in risk averters without variance coding in seven risk s eekers20. Another study also revealed that the connectivity
between the vlPFC, posterior cingulate, and precentral gyrus was enhanced in reward sensitive individuals21.
Hsu et al. indicated that the vlPFC, precuneus, premotor cortex, precuneus, and angular gyrus were sensitive to
the level of ambiguity and risk in behavioral c hoices22. In the low-performance group, our findings implicated
that the BIS scores were linearly correlated with the decreased activity of networks responding to risk-choices
during explorative decision-making. It is likely that the low performance group sees risky explorative decisions
as avoidable cues and reacts to the decision with a decreased risk-choices responding network.
In contrast, the high-performance group showed enhanced activation in the anterior insula, SMA, and lingual
gyrus during explorative decision-making compared to the low-performance group. The anterior insula has
Scientific Reports | (2021) 11:15810 | https://doi.org/10.1038/s41598-021-95311-0 5
Vol.:(0123456789)www.nature.com/scientificreports/
Figure 3. Significant difference between high- and low-performance groups during explorative decision-
making. The threshold was set at Alpha-shim corrected p < 0.05 for multiple comparison.
Peak coordinates
Volume information x y z t value Cluster (Voxels)
High-performance group > low-performance group
Lingual gyrus 14 − 88 2 3.91 80
Supplementary motor area 6 18 48 3.62 53
Anterior insula 28 20 − 10 3.35 53
Low-performance group > high-performance group
Middle cingulate cortex 20 − 26 48 3.80 49
Table 2. The significant difference between high- and low-performance groups during explorative decision-
making. Statistical significance was thresholded at uncorrected p < 0.003 with a minimum cluster size
of 50 voxels, which yielded an overall false positive p < 0.05 as determined using Alpha-Sim for multiple
comparisons correction.
Figure 4. Significant correlation between BAS/BIS score and neural activation during explorative decision-
making. The threshold was set at Alpha-shim corrected p < 0.05 for multiple comparison. (ACCanterior
cingulate cortex, dACCdorsal anterior cingulate cortex, dlPFC dorsolateral prefrontal cortex, FPC frontopolar
cortex, IPL inferior parietal lobule, PCC posterior cingulate cortex, SMA supplementary motor area, SPL
superior parietal lobule, STP superior temporal pole, vlPFC ventrolateral prefrontal cortex, vmPFC ventromedial
prefrontal cortex).
Scientific Reports | (2021) 11:15810 | https://doi.org/10.1038/s41598-021-95311-0 6
Vol:.(1234567890)www.nature.com/scientificreports/
Peak coordinates
Volume information x y z t value Cluster (Voxels)
Exploration of high-performance group (covariate: BAS scores)
None
Exploration of high-performance group (covariate: BIS scores)
None
Exploration of low-performance group (covariate: BAS scores)
Middle temporal gyrus − 40 − 56 2 − 4.71 168
Putamen, caudate 18 14 0 − 4.56 179
Superior temporal pole, superior temporal gyrus 60 10 0 − 4.39 218
Precentral gyrus, premotor cortex − 18 − 10 74 − 4.34 104
− 44 − 52 52 − 4.05 93
36 − 66 42 − 3.89 72
Inferior parietal lobule
− 52 14 −2 − 3.87 94
− 54 − 34 44 − 3.46 70
− 28 2 − 22 − 3.99 55
Amygdala, parahippocampal gyrus
− 18 − 30 − 12 − 3.86 50
20 − 46 − 18 − 3.97 79
Cerebellar lobule IV–VI
−4 − 52 2 − 3.40 80
Superior temporal gyrus − 54 − 10 10 − 3.91 99
Superior temporal pole − 32 − 70 42 − 3.90 94
− 12 − 40 48 − 3.81 370
Anterior/middle cingulate cortex, supplementary motor area − 12 18 32 − 3.57 85
8 18 44 − 3.47 117
Postcentral gyrus 60 − 16 20 − 3.60 54
Exploration of low-performance group (covariate: BIS scores)
Premotor cortex 30 8 50 − 4.60 157
−6 − 60 50 − 4.55 768
Precuneus 22 − 54 32 − 3.70 91
− 16 − 60 28 − 3.44 73
Middle cingulate 0 − 14 26 − 4.25 187
Thalamus 8 − 10 18 − 3.94 56
Inferior parietal lobule, supramarginal gyrus 50 − 36 52 − 3.94 163
38 − 62 36 − 3.93 181
Inferior parietal lobule, angular gyrus
− 32 − 42 38 − 3.74 95
Ventrolateral prefrontal cortex 56 10 26 − 3.92 105
Table 3. The BAS/BIS associated activation during explorative decision-making among 2 groups. Statistical
significance was thresholded at uncorrected p < 0.003 with a minimum cluster size of 50 voxels, which yielded
an overall false positive p < 0.05 as determined using Alpha-Sim for multiple comparisons correction.
Variables Mean SD 1 2 3 4 5 6
1. Sex –
2. BIS score 20.51 3.43 0.179 –
3. BAS score 39.88 4.28 0.133 − 0.163 –
4. fMRI performance average score 55.77 1.69 − 0.234* − 0.152 − 0.203* –
5. Exploration average score 48.97 1.37 − 0.246** − 0.296** − 0.051 0.634** –
6. Exploitation average score 59.32 0.46 0.102 0.233* − 0.030 − 0.244** − 0.389** –
Table 4. Means, standard deviation and Pearson correlation matrix for Variables (N = 111). Variable sex is
categorical variable. *p < 0.05. **p < 0.01.
Scientific Reports | (2021) 11:15810 | https://doi.org/10.1038/s41598-021-95311-0 7
Vol.:(0123456789)www.nature.com/scientificreports/
been reported as a key structure in some models of self-regulation and reward seeking23–25, because it detects
salient stimuli and coordinates neural r esources16,17. Previous visual-task studies revealed that the activation of
the lingual gyrus was associated with visual a ttention26–29. Spooner et al. indicated a robust relationship in the
supplementary motor area between validity difference scores in frontal theta activity and movement-locked
gamma oscillations, suggesting modulation of these sensorimotor network gamma responses by attentional
reorienting30. Zorowitz et al. also reported that pre-SMA are specifically correlated with approach-avoidance
conflict during employment of a variable epoch m ethod31. Compared with the activation of the low-performance
group, our results revealed that the activities of the high-performance group in the anterior insula, SMA, and
lingual gyrus increase when driven to pursue rewards and avoid harm during explorative decision-making.
Thus, people who employ calculated and controlled in reward seeking behavior achieve better performance
when making explorative decision.
Although the focus of our study is to understand how motivational systems moderate brain responses during
explorative decision making, it is useful to compare our findings with prior studies in terms of the exploration
and exploitation activation regions. Basically, our findings are similar to those of prior studies. For the explora-
tion orientation, the middle frontal gyrus within dlPFC together with the IPL form the central executive network
(CEN)32,33. They engage in information retention and manipulation during working memory, problem solution
and goal-oriented decision-making34–36. In line with previous studies37,38 dACC was also activated. CEN coupling
with anterior insula and dACC comprise the putative cognitive control n etwork39–41. Since dACC links to rea-
soning centers in the frontal lobe and the memory centers in the limbic system, its activation is understandable
when people are switching from habitual exploitation to a novel exploration selection. Furthermore, anterior
insula coupling with dACC form the major components of the salience network, implying the subjective salience
of external stimuli contributing to complex cognitive processes such as the central executive function as well as
affective processes42. Collectively, these results are in high conformity with the previous findings of Daw et al.13
and Laureiro-Martãnez et al.4, suggesting that the four-arm bandit task is valid and effective in probing brain
regions associated with exploration, even in an Asian cultural setting.
Neuroscientists have identified several brain regions associated with exploration and have made some progress
toward identifying those r egions4,43. Relevant literature suggests that switching from exploitation to exploration
requires individual decision makers to constantly monitor the reward and costs associated with exploitative
and explorative activities. According to Koechlin and Hyafil38, the FPC, the most anterior part of the frontal
lobes, forms the apex of the executive system underlying decision-making38. These two scholars found that FPC
contributes to human cognitive learning and exploration. Especially, the FPC is robustly engaged when subjects
are instructed to learn new behavioral routines. FPC activity specifically correlates with the amount of uncer-
tainty with multiple options. Their study shows that FPC is active whenever subjects depart from an a priori
optimal option to check alternative ones. FPC may also play a critical role in the gradual formation of complex
behavioral and cognitive routines. Daw et al.13 found that FPC and IPL are preferentially active during explora-
tory decisions; by contrast, regions of vmPFC exhibit activity characteristic of an involvement in value-based
exploitative decision-making13.
We acknowledge that there are several limitations of this study. First, the homogeneity of the participants is
a concern. Although our participants are from different colleges of the same university, in general they have a
similar orientation going through a fierce entrance examination competition. Second, our participants are all
college students. In the future, recruiting both managers (experts) and students (beginners) for comparison
may yield more fruitful results. For future research, recruiting more participants with both high exploration and
exploitation scores will enable us to study this particular group for more insights, as they are the type of person
businesses are looking for.
To our understanding, this research is the first study using fMRI to evaluate the association between BAS/BIS
orientation and explorative decision-making performance. The implications of our research findings include:
first, the fMRI result using the four-armed-bandit to test exploration is robust, irrespective of research done in
the west or east, and with managers or students. Second, individuals who receive low performance in explorative
decision-making have higher BAS scores and make more explorative attempts. They tend to rely less on systematic
searching in making decisions when encountering uncertain situations. Third, the BAS/BIS scores of the low-
performance group have significant association with their neural activations during explorative decision-making.
In particular, their BAS is negatively associated with neural networks related to reward-seeking, and their BIS is
negatively associated with neural networks responding to risk-choice. This study provides both behavior- and
neuroimaging-based evidences that BAS/BIS scores are associated with mental activation during explorative
decision-making for those with poor explorative decision-making skills. The scores may be an effective predic-
tor for the personal motivational orientation of an approach task; moreover, the enhanced mental activity of
the high-performance group may lead to their effective exploration and superior exploration performance. Our
results have provided a novel insight into understanding the correlation between the behavior motivational scale
and mental motivational systems in explorative decision-making.
Our findings have useful practical implications. Specifically, compared with the high-performance group,
the low-performance group with a high BAS score does not have the expected neural control in their brain
activation, which may indicate blind exploration attempts. One important implication for management devel-
opment is the emphasis on calculated risk-taking considering reward-seeking at the same time for exploration
effectiveness. Those who are bold enough but attempt to try every opportunity without exercising high level
cognitive control and analysis, may not be the type of persons that organizations would like to hire. In summary,
our study showed that people with relative low BAS scores (associated to reward-seeking network), and relative
high BIS scores (associated to risk-choices responding network) may try fewer anticipated low-performance
attempts to gain more reward. Thus, they would potentially perform better and gain reward more effectively
in explorative decisions making under uncertainty. Hopefully, the results of this study may shed some light on
Scientific Reports | (2021) 11:15810 | https://doi.org/10.1038/s41598-021-95311-0 8
Vol:.(1234567890)www.nature.com/scientificreports/
Figure 5. Experimental paradigm. Initially, four slots are presented. The participant chooses one, which then
spins. Three seconds later the number of points won is revealed. After a further second the screen is cleared. The
condition was set as fail if the participant did not choose one slot within 1.5 s. The next trial was triggered after
a fixed trial length of 8.6 s. There were 75 trials of four-armed bandit task in one session, and 300 trials were
applied to each participant totally.
nurturing managers who can better cope with the future viability, dare to explore in an effective way, thus result
in superior exploration performance.
Methods
Before describing our methods in details, we would like to make the following statements.
1. This research has been approved by “Research Ethics Committee of National Chengchi University,” endorsed
by Taiwan Ministry of Science and Technology.
2. We confirm that all the methods reported hereunder, including experiments were performed in accordance
with relevant guidelines and regulations.
3. We confirm that informed consent was obtained from all participants
4. Our participants’ names and any other information that could lead to the identification of a participant have
been removed from all sections of the manuscript, including supplementary information.
Participants. We recruited 112 students (potential managers) from a university in this fMRI study, and later
discarded one participant due to head motion exceeding the threshold (translation in any direction > 1 voxel).
The functional data of the remaining 111 participants (37 males, 21.8 ± 1.8 years-old) were included in our
analysis. All participants were right-handed, with no metal devices in their bodies (such as dental braces), with
no history of psychiatric or neurological disorders, and who were not under psychoactive medications. They
all gave written consent to undertake the experimental procedure, which was approved by the Research Ethics
Committee of National Chengchi University.
Behavioral assessment. We assessed participants’ BAS and BIS status using the Taiwan version of BAS/
BIS assessments, which was translated and modified by Lee44. Factor analysis of the original 20 items (exclud-
ing 4 filler items) in Lee’s study showed that BAS-RR item #18 (when a good thing happens to me, it affects me
strongly) was unexpectedly loaded on the BIS factor (0.45). Similarly, Müller and Wytykowska also found unex-
pected loading of the same item on the BIS f actor45. After removing this item, resulting in a 19-item structure,
the internal consistency of BAS-Taiwan was 0.81 and that of BIS-Taiwan was 0.76. The coefficients of test–retest
reliability were 0.65 and 0.78, respectively. The 19-item structure was used to assess participants’ BAS and BIS
in this study.
Experimental procedure. Following the design of Daw et al.13 and Laureiro-Martinez et al.6, participants
engaged in a “four-armed bandit” task for which they had to choose among slots. This task captures the key
elements of various settings in which individuals are faced with the problem of choosing among options with
uncertain outcomes6,46. This feature allowed us to study exploratory decisions under uniform conditions in the
context of a single task6,13.
The game makes use of four slot machines that pay off points randomly, with the presentation changing
from trial to trial (Fig. 5). Participants chose one by pressing one of the four buttons on a keyboard. Within a
few seconds, the number of points they had won was displayed, and then a fixation cross appeared, signaling
the end of one trial and the beginning of a new one. Subjects had a maximum of 1.5 s to make their choice; if no
choice was made within the slots-presentation period, a red X-character was displayed for 4.2 s, and a new trial
was started. Participants played a total of 300 trials divided into four sessions (75 trials each). After each session,
they were given a break for as long as they wanted.
Scientific Reports | (2021) 11:15810 | https://doi.org/10.1038/s41598-021-95311-0 9
Vol.:(0123456789)www.nature.com/scientificreports/
During each trial, participants had to resolve the dilemma of whether to choose an uncertain but familiar
option (exploitation) or investigate a new one in the hope of a higher payoff (exploration). This study adopted
the model of Daw et al.13 by classifying trials according to whether the actual choice was the one predicted by the
model to be the dominant slot machine with the highest expected value (exploitative) or a dominated machine
with a lower expected value (exploratory).
Imaging acquisition. For imaging data collection, participants were scanned using a 3T MR system
(MAGNETOM Skyra, Siemens, Erlangen, Germany) and an 8-channel array head coil at the Taiwan Mind
and Brain Imaging Center, National Chengchi University. In the functional scanning, thirty-two slices of axial
images were acquired using a gradient echo planar imaging (EPI) with the following parameters: TR = 2000 ms,
TE = 30 ms, flip angle = 83°, in-plane field of view = 256 × 256 mm, slice thickness = 4.0 mm and acquisition
matrix = 64 × 64 × 34 to cover the whole cerebrum. A Magnetization Prepared Rapid Gradient Echo T1-weighted
image with spatial resolution of 1 mm isotropic (TR = 2000, TE = 2.3, flip angle = 8°, matrix size = 256, field of
view = 240, number of slices = 192) was acquired for each participant.
fMRI data preprocessing and analysis. We used SPM12 statistical parametric mapping software (Well-
come Trust Centre for Neuroimaging; http://www.fil.ion.ucl.ac.uk/spm) and the Artifact Detection Tools (ART)
toolkit for preprocessing and statistical analysis of the fMRI data. The first eight volumes of each run were
discarded to exclude T 1 saturation effects. Then the functional images were corrected for differences in slice-
acquisition time to the first volume and were realigned to the first volume by the ART toolkit. By using ART,
an image was considered as an outlier if the head displacement was greater than 4 mm in any plane, or if the
rotational displacement was greater than 1°. Individual anatomical images were registered into the realigned
images, and all co-registered images were normalized to the standard MNI (Montreal Neurological Institute)
average template and resampled to a 2-mm isotropic voxel size. Normalized images were spatially smoothed
with a Gaussian kernel of 6-mm full width at half maximum (FWHM) to accommodate any anatomical vari-
ability across participants.
Two conditions were utilized in the experiment: exploitation and exploration. The onset time of each event
was set at the start of a slot presentation. Data from each participant were entered into a general linear model
using an event-related designed procedure. The two conditions in this study were modeled using a box-car
function convolved with a canonical hemodynamic response function. Six motion parameters were adopted as
the nuisance covariate factors and were considered in the individual analysis. Group-level results of exploita-
tive and explorative decision-making were acquired using one-sample t-test. Participants’ BAS/BIS scores were
used as covariates in a one-sample t-test to investigate a high level of behavior-orientation neural activity. To
test why some individuals are good at making explorative decisions, categorical data analysis was applied into
all the behavior and functional data. All participants were then separated into 2 groups based on their median
score during explorative decision-making to investigate the impact of the two groups. The resulting model
coefficients for individual participants were subjected to a subsequent 2-sample t-test with participants’ BAS/
BIS scores as covariates. All activity was thresholded at Alpha-shim corrected p < 0.05 by AFNI software47 for
multiple comparison correction.
Received: 23 December 2020; Accepted: 21 July 2021
References
1. March, J. G. Exploration and exploitation in organizational learning. Organ. Sci. 2, 71–87 (1991).
2. O’Reilly, C. A. & Tushman, M. L. The ambidextrous organization. Harvard Business Rev. 82(4), 74–81 (2004) (140).
3. Lavie, D., Stettner, U. & Tushman, M. L. Exploration and exploitation within and across organizations. Acad. Manag. Ann. 4,
109–155 (2010).
4. Laureiro-Martínez D, Canessa N, Brusoni S, Zollo M, Hare T, Alemanno F, Cappa SF. Frontopolar cortex and decision-making
efficiency: comparing brain activity of experts with different professional background during an exploration-exploitation task.
Front Hum Neurosci. 7, 927 (2014). https://doi.org/10.3389/fnhum.2013.00927. PMID: 24478664; PMCID: PMC3897871.
5. Levinthal, D. A. & March, J. G. The myopia of learning. Strateg. Manag. J. 14, 95–112 (1993).
6. Laureiro-Martínez, D., Brusoni, S., Canessa, N. & Zollo, M. Understanding the exploration–exploitation dilemma: An fMRI study
of attention control and decision-making performance. Strat. Manag. J. 36, 319–338 (2015).
7. Piao, M. A long life after exploitation and exploration. Eur. J. Innov. Manag. 17, 209–228 (2014).
8. Raisch, S., Birkinshaw, J., Probst, G. & Tushman, M. L. Organizational ambidexterity: Balancing exploitation and exploration for
sustained performance. Organ. Sci. 20, 685–695 (2009).
9. Schutte, I., Kenemans, J. L. & Schutter, D. J. L. G. Resting-state theta/beta EEG ratio is associated with reward- and punishment-
related reversal learning. Cognit. Affect Behav. Neurosci. 17, 754–763 (2017).
10. Kang, E. & Uhlenbruck, K. A process framework of entrepreneurship: From exploration, to exploitation, to exit. Acad. Entrepre-
neurship J. 12, 47–71 (2006).
11. Carver, C. S. & White, T. L. Behavioral inhibition, behavioral activation, and affective responses to impending reward and punish-
ment: The BIS/BAS Scales. J. Person. Social Psychol. 67, 319–333 (1994).
12. Baker, D. F., Larson, L. M. & Seipel, M. T. Relation of reinforcement sensitivity on vocational interest and self-efficacy. J. Career
Assess. 27, 230–245 (2017).
13. Daw, N. D., O’Doherty, J. P., Dayan, P., Seymour, B. & Dolan, R. J. Cortical substrates for exploratory decisions in humans. Nature
441, 876–879 (2006).
14. Krug, A. et al. Investigation of decision-making under uncertainty in healthy subjects: A multi-centric fMRI study. Behav. Brain
Res. 261, 89–96 (2014).
15. Li, C.-W., Chen, J.-H. & Tsai, C.-G. Listening to music in a risk-reward context: The roles of the temporoparietal junction and the
orbitofrontal/insular cortices in reward-anticipation, reward-gain, and reward-loss. Brain Res. 1629, 160–170 (2015).
Scientific Reports | (2021) 11:15810 | https://doi.org/10.1038/s41598-021-95311-0 10
Vol:.(1234567890)www.nature.com/scientificreports/
16. Sidlauskaite, J. et al. Anticipatory processes in brain state switching—Evidence from a novel cued-switching task implicating default
mode and salience networks. Neuroimage 98, 359–365 (2014).
17. Uddin, L. Q. Salience processing and insular cortical function and dysfunction. Nat. Rev. Neurosci. 2009 10:6 16, 55–61 (2015).
18. Fan, L. et al. Connectivity-based parcellation of the human temporal pole using diffusion tensor imaging. Cereb. Cortex 24,
3365–3378 (2014).
19. Bai, T. et al. Decreased connection between reward systems and paralimbic cortex in depressive patients. Front. Neurosci. 12, 462
(2018).
20. Tobler, P. N., O’Doherty, J. P., Dolan, R. J. & Schultz, W. Reward value coding distinct from risk attitude-related uncertainty coding
in human reward systems. J. Neurophysiol. 97, 1621–1632 (2007).
21. Cho, C., Smith, D. V. & Delgado, M. R. Reward sensitivity enhances ventrolateral prefrontal cortex activation during free choice.
Front. Neurosci. 10, 529 (2016).
22. Hsu, M., Bhatt, M., Adolphs, R., Tranel, D. & Camerer, C. F. Neural systems responding to degrees of uncertainty in human
decision-making. Science 310, 1680–1683 (2005).
23. Cole, M. W. & Schneider, W. The cognitive control network: Integrated cortical regions with dissociable functions. Neuroimage
37, 343–360 (2007).
24. Naqvi, N. H. & Bechara, A. The hidden island of addiction: The insula. Trends Neurosci. 32, 56–67 (2009).
25. Menon, V. & Uddin, L. Q. Saliency, switching, attention and control: A network model of insula function. Brain Struct. Funct. 214,
655–667 (2010).
26. Hopf, J.-M. et al. Popout modulates focal attention in the primary visual cortex. Neuroimage 22, 574–582 (2004).
27. Smith, A. T., Cotillon-Williams, N. M. & Williams, A. L. Attentional modulation in the human visual cortex: The time-course of
the BOLD response and its implications. Neuroimage 29, 328–334 (2006).
28. Silver, M. A., Ress, D. & Heeger, D. J. Neural correlates of sustained spatial attention in human early visual cortex. J. Neurophysiol.
97, 229–237 (2007).
29. Ciaramitaro, V. M., Buracas, G. T. & Boynton, G. M. Spatial and cross-modal attention alter responses to unattended sensory
information in early visual and auditory human cortex. J. Neurophysiol. 98, 2399–2413 (2007).
30. Spooner, R. K., Wiesman, A. I., Proskovec, A. L., Heinrichs-Graham, E. & Wilson, T. W. Prefrontal theta modulates sensorimotor
gamma networks during the reorienting of attention. Hum. Brain Mapp. https://doi.org/10.1002/hbm.24819 (2019).
31. Zorowitz, S. et al. The neural basis of approach-avoidance conflict: A model based analysis. eNeuro 6, ENEURO.0115-19.2019
(2019).
32. Seeley, W. W. et al. Dissociable intrinsic connectivity networks for salience processing and executive control. J. Neurosci. 27,
2349–2356 (2007).
33. Menon V. Salience Network. In: Arthur W. Toga, editor. Brain Mapping: An Encyclopedic Reference, vol. 2, pp. 597–611. Academic
Press: Elsevie (2015).
34. Miller, E. K. & Cohen, J. D. An integrative theory of prefrontal cortex function. Annu. Rev. Neurosci. 24, 167–202. https://doi.org/
10.1146/annurev.neuro.24.1.167 (2003).
35. Petrides, M. Lateral prefrontal cortex: Architectonic and functional organization. Philos. Trans. R. Soc. B Biol. Sci. 360, 781–795
(2005).
36. Rottschy, C. et al. Modelling neural correlates of working memory: A coordinate-based meta-analysis. Neuroimage 60, 830–846
(2012).
37. Aston-Jones, G. & Cohen, J. D. An integrative theory of locus coeruleus-norepinephrine function: Adaptive gain and optimal
performance. Annu. Rev. Neurosci. 28, 403–450 (2005).
38. Koechlin, E. & Hyafil, A. Anterior prefrontal function and the limits of human decision-making. Science 318, 594–598 (2007).
39. Wager, T. D. et al. Common and unique components of response inhibition revealed by fMRI. Neuroimage 27, 323–340 (2005).
40. Levy, B. J. & Wagner, A. D. Cognitive control and right ventrolateral prefrontal cortex: Reflexive reorienting, motor inhibition,
and action updating. Ann. N.Y. Acad. Sci. 1224, 40–62 (2011).
41. Cai, W. et al. Causal interactions within a frontal-cingulate-parietal network during cognitive control: Convergent evidence from
a multisite–multitask investigation. Cereb. Cortex 26, 2140–2153 (2016).
42. Chang, T.-T., Lee, P.-H. & Metcalfe, A. W. S. Intrinsic insula network engagement underlying children’s reading and arithmetic
skills. Neuroimage 167, 162–177 (2018).
43. Boorman, E. D. & Rushworth, M. F. S. Conceptual representation and the making of new decisions. Neuron 63, 721–723 (2009).
44. Lee, Y. P. Exploring attention of individuals with depressed mood: The moderating roles of behavioral inhibition and activation
system. Unpublished Master’s Thesis. National Taiwan University, Taipei, Taiwan 1–80 (2010). https://doi.org/10.6342/NTU.2010.
00413.
45. Müller, J. M. & Wytykowska, A. M. Psychometric properties and validation of a Polish adaptation of Carver and White’s BIS/BAS
scales. Personal. Individ. Differ. 39, 795–805 (2005).
46. Meyer, R. J. & Shi, Y. Sequential choice under ambiguity: Intuitive solutions to the Armed–Bandit problem. Manage. Sci. 41,
817–834 (1995).
47. Cox, R. W. AFNI: Software for analysis and visualization of functional magnetic resonance neuroimages. Comput. Biomed. Res.
29, 162–173 (1996).
Acknowledgements
This research was funded by Grant (MOST 104-2410-H-004 -157-MY3) from Ministry of Science and Technol-
ogy Taiwan, and was supported by Taiwan Mind & Brain Imaging Center at National Chengchi University for
consultation and instrumental availability. We are also indebted to Wan Fang Hospital for providing technical
support through sharing the time of the first author.
Author contributions
C.Y.-Y.L., T.-T.C., N.-S.Y., and D.T. contributed to the conception and design of the study; C.-W.L. and C.Y.-Y.L.
contributed to the preparation and interpretation of functional data; all authors contributed to the preparation
and revision of the manuscript. All authors reviewed and approved the manuscript.
Competing interests
The authors declare no competing interests.
Additional information
Supplementary Information The online version contains supplementary material available at https://doi.org/
10.1038/s41598-021-95311-0.
Scientific Reports | (2021) 11:15810 | https://doi.org/10.1038/s41598-021-95311-0 11
Vol.:(0123456789)www.nature.com/scientificreports/
Correspondence and requests for materials should be addressed to C.Y.-Y.L.
Reprints and permissions information is available at www.nature.com/reprints.
Publisher’s note Springer Nature remains neutral with regard to jurisdictional claims in published maps and
institutional affiliations.
Open Access This article is licensed under a Creative Commons Attribution 4.0 International
License, which permits use, sharing, adaptation, distribution and reproduction in any medium or
format, as long as you give appropriate credit to the original author(s) and the source, provide a link to the
Creative Commons licence, and indicate if changes were made. The images or other third party material in this
article are included in the article’s Creative Commons licence, unless indicated otherwise in a credit line to the
material. If material is not included in the article’s Creative Commons licence and your intended use is not
permitted by statutory regulation or exceeds the permitted use, you will need to obtain permission directly from
the copyright holder. To view a copy of this licence, visit http://creativecommons.org/licenses/by/4.0/.
© The Author(s) 2021
Scientific Reports | (2021) 11:15810 | https://doi.org/10.1038/s41598-021-95311-0 12
Vol:.(1234567890)You can also read