Multitemporal Surface Deformation Analysis of Amyntaio Slide (Greece) using Remotely Piloted Airborne System and Structure from Motion ...
←
→
Page content transcription
If your browser does not render page correctly, please read the page content below
4th Joint International Symposium on Deformation Monitoring (JISDM), 15‐17 May 2019, Athens, Greece

       Multitemporal Surface Deformation Analysis of Amyntaio Slide (Greece)
        using Remotely Piloted Airborne System and Structure‐from‐Motion
                                 photogrammetry
       Emmanuel Vassilakis1, Michael Foumelis2, Athanasia Erkeki3, Evelina Kotsi4, Issaak Parcharidis5,
                                         Efthymios Lekkas6
   1
     Remote Sensing Laboratory, Faculty of Geology & Geo‐environment, NKUA, Panepistimiopolis Zographou,
 Greece, (evasilak@geol.uoa.gr)
   2
     Geophysical Imaging and Remote Sensing Unit (DRP‐IGT), BRGM ‐ French Geological Survey, Orleans,
 France, (m.foumelis@brgm.fr)
   3
     Remote Sensing Laboratory, Faculty of Geology & Geo‐environment, NKUA, Panepistimiopolis Zographou,
 Greece, (aerkeki@geol.uoa.gr)
   4
     Natural Hazards Laboratory, Faculty of Geology & Geo‐environment, NKUA, Panepistimiopolis Zographou,
 Greece, (ekotsi@geol.uoa.gr)
   5
     Dpt of Geography, Harokopio University, 70 Eleftheriou Venizelou, Kallithea, Greece, (parchar@hua.gr)
   6
     Natural Hazards Laboratory, Faculty of Geology & Geo‐environment, NKUA, Panepistimiopolis Zographou,
 Greece, (elekkas@geol.uoa.gr)

 Key words: Amyntaio landslide; ground deformation; Remotely Piloted Airborne System;
 photogrammetry

 ABSTRACT
   The results of Structure‐from‐Motion photogrammetry for the quantification of the ground surface
 deformation due to the massive landslide that occurred at the lignite open pit in Amyntaio, Greece on 10th June
 2017, is presented in this paper. This unexpected slide damaged the entire westernmost marginal area of the
 pit, significant number of buildings and infrastructures (incl. road network, powerlines, biological treatment,
 houses etc.) of the nearby village of Anargiri, as well as agricultural land at the head of the landslide. We
 generated a very high‐resolution surface topography and corresponding co‐registered ortho‐rectified images
 covering a total area of 2 km2 by analyzing images acquired from Remotely Piloted Airborne Systems (RPASs). A
 high resolution (0.13 m) Digital Surface Model (DSM) was produced after photogrammetric processing, serving
 as a reference dataset for comparison with other surveys realized on December 2017 and September 2018. We
 compared the high‐resolution DSMs acquired during the post landslide periods, quantified the overall ground
 deformation and finally delineated regions of potential risk.

                   I. INTRODUCTION                              In our application, several UAS field surveys were
                                                             conducted for the acquisition of aerial images covering
   The number of published studies that describe
                                                             a total area of 2 km2. Three surveys took place at the
possible applications of Unmanned Aerial System (UAS)
                                                             edge of a massive landslide, which occurred at an open
for the management of natural hazards consequences
                                                             lignite pit in Amyntaio, Greece on 10th June 2017. This
and the identification or quantification of occurred
                                                             phenomenon destroyed the westernmost marginal
damages have been strongly increased in the last
                                                             area of the open pit, as well as significant infrastructure
decade (Giordan et al., 2018).
                                                             of the nearby village of Anargiri (road network,
   The use of the mini and micro UASs is practical for
                                                             powerlines, biological treatment, houses), not to
small areas and optimal for landslides that often cover
                                                             mention the agricultural land at the head of the
an area that ranges from less than one square
                                                             landslide. Several ground displacements are still visible
kilometers up to few square kilometers. High‐resolution
                                                             around the village and all the field observation lead to
images acquired by UASs may support the definition of
                                                             the conclusion that they are still active and ongoing
not only the identification of studied landslide limit but
                                                             deformation is happening for at least 15 months after
also the identification and mapping of the main
                                                             the landslide event. In many cases the scarp exceeds
geomorphological features (Fiorucci et al., 2018).
                                                             one meter size, causing serious destructions at the
Furthermore, a sequence of low‐cost UAS acquisitions
                                                             building structure, especially at the eastern part of
over time can provide useful support for the delineation
                                                             Anargiri village (Figure 1).
of the surface structures and generally for the study of
gravitational process evolution (Niethammer et al.,
2012; Liu et al., 2015).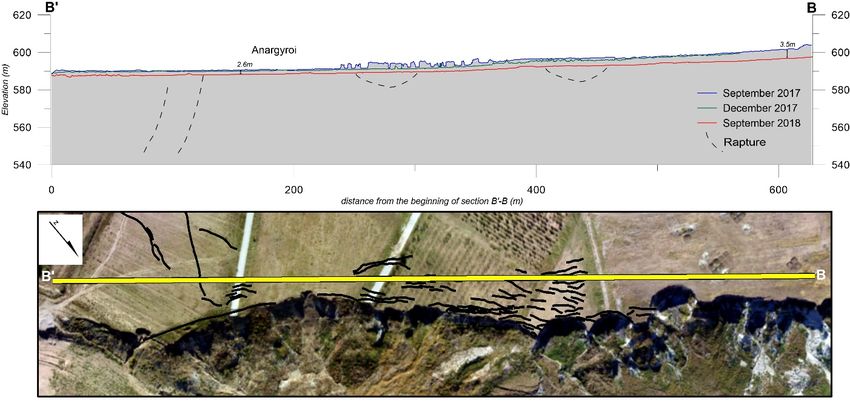
4th Joint International Symposium on Deformation Monitoring (JISDM), 15‐17 May 2019, Athens, Greece
II. STRATIGRAPHY AND STRUCTURAL GEOLOGY III. DATA AND METHODOLOGY
The Amyntaio open pit is located at the NW margin of The aim of this multitemporal study was to create a
the Ptolemais basin, which is an elongated structure series of Digital Surface Models (DSMs) along with the
trending NW‐SE. The basin is filled with Late Miocene– ortho‐photo‐mosaics of the same area, based on the
Pleistocene lacustrine sediments which in a few places Structure‐from‐Motion photogrammetry (Westoby et
exceed the thickness of 500 meters, which cover al., 2012; Granshaw, 2018). Hundreds of aerial images
metamorphic basement rocks. The entire succession are acquired during each flight and they are combined
includes intercalations of lignites, lacustrine marl beds, through photogrammetric software to produce
fluvial sands and silts, along with volcanic ash beds accurate micro‐topography and high‐resolution
covered by alluvial deposits (Anastopoulos & imagery.
Koukouzas, 1972; Steenbrink et al., 1999). The open surface of the area of interest was extracted
Several generations of faults are offsetting the with the implementation of a rotor‐wing UAS (DJI
lacustrine beds causing displacements that reach even Phantom 4 Advanced drone) during the field surveys. It
50 meters of throw (Delongos et al., 2016). They strike was used to collect high‐resolution natural colour
NW‐SE and NE‐SW and they follow the main trending of images with its built‐in camera (with 3.61 mm focal
the two extensional episodes of Late Miocene (NE‐SW) length) bundled on a two‐axis gimbal.
and Quaternary (NW‐SE), respectively (Pavlides & Each survey was completed after five ‐flights, each of
Mountrakis, 1987; Mercier et al., 1989). them lasting 15 minutes, which covered a 2 km2
selected area that included the Anargiri village as well
as the edge of the landslide. The flights were
programmed at a flight elevation of 140 m above three
different take off points and the overlap was set at 75%
along the flight line and 65% at the sides of the flights
(Pepe et al., 2018). During the programming of the
image acquisition, the flight height and the density of
the images had to be taken under serious
consideration, in terms of the battery usage limitations.
The percentage of overlapping is quite crucial as it had
to be high enough for a successive photogrammetric
processing and ortho‐photo‐mosaic construction
without any artefacts. The UAS platform is equipped
with a GNSS antenna which provides quite good
precision especially for the horizontal positions of
which may help the alignment of the images captured
during the survey (Fonstad et al., 2013). Despite this we
used 8 ground control points (GCPs) measured with
high precision Real Time Kinematics Geodetic
Navigation Satellite System (RTK‐GNSS) to maximize the
accuracy of the products, since a comparative study was
the main objective (Fugazza et al., 2018).
The first survey was conducted about three months
after the landslide during September 2017. A total of
257 images (4000 x 3000 pixels each) was acquired with
sufficient front and side overlaps. The same overlaps
were used for the second field survey (December 2017,
322 images) and the third survey (September 2018, 401
images), with reducing the flight elevation from 140 m
to 120 m above ground to increase the spatial
resolution of the outcome DSMs and mosaics.
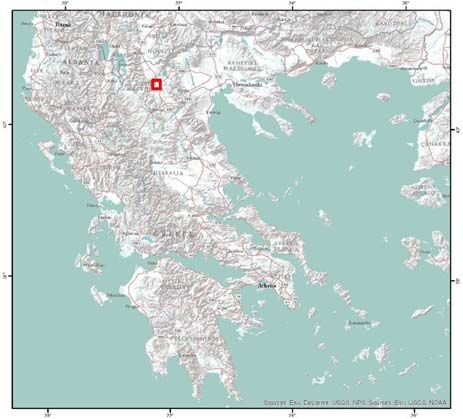
Figure 1. Index map of the Amyntaio open pit location in The procedure started with aligning the aerial images
continental Greece (at the top). At the bottom a false colour and creating a sparse 3D point cloud followed by a mesh
RapidEye satellite image acquired ten days after the generation. Locating the GCPs on every image and
landslide showing the entire lignite open mine. The black inserting the exact coordinates and elevation measured
dashed line surrounds the landslide debris, whereas the by the RTK‐GNSS was the next step in the methodology,
yellow ones show the surface fractures mapped after the which is the recommended photogrammetric
occurrence of the slide phenomenon. procedure outlined by Agisoft (2016) and was slightly
modified for reducing geometry errors and constructing
a dense point cloud. Three of them were constructed
4th Joint International Symposium on Deformation Monitoring (JISDM), 15‐17 May 2019, Athens, Greece

consisted of about 800,000 points for each one of the        (0.7‐0.6 pix) and it is worth to mention that the z‐error
three surveys.                                               at the GCPs’ location, after the completion of the
  The information for each point of them includes            processing, never exceeded 1 cm.
values of reflectance at the visible (BGR) spectra along
with X, Y, Z coordinates, which were calculated after                                  IV. RESULTS
taking into account the positions of the camera when           The multitemporal study of the deformations at the
shooting at each point from different angles (Westoby        area surrounding the upper part of the landslide was
et al 2012). The procedure continued with meshing the        based on three DSMs that were created during a year
original images as fine topographic details were             of observations (September 2017 – September 2018).
available. Texturing was also applied to the resulted        The height elevation changes at the area around the
mesh in a later step and an ortho‐image was generated        Anargiri village were measured with high detail and
as well as a DSM (Mancini et al., 2013) (Figure 2).          accuracy and were also verified by the RTK
                                                             measurement of the GCPs that were established
                                                             throughout the area of interest.
                                                               The village is developed along a NE‐SW elongated
                                                             shape whereas its NE edge was affected by the collapse
                                                             in the open mine. Most of the residential area was
                                                             stable after the landslide event but the NE part seems
                                                             to be under continuous and severe deformation even
                                                             after 1.5 year after the failure happened.
                                                               Several surface fractures have appeared around the
                                                             wider area of the village either on the road network or
                                                             in the cultivated parcels (Figure 3).

                                                                                                                 11/6/2017

    Figure 2. The earliest (September 2017) ortho‐photo‐                                                         2/11/2018
  mosaic of the area of interest (top) along with the GCPs
   locations and the DSM of the same period (bottom).                Figure 3. The main E‐W trending surface fracture
                                                                immediately after the landslide (top) and fifteen months
   The final spatial resolution of the three ortho‐images     later (bottom ). It is clear that the fracture is still active and
is calculated at 6‐10 cm and the DSMs’ pixel size is at                  the displacement exceeds 0.7 meters.
10‐13 cm, depending on the flight elevation and the
density of the overlapping images. The feature density
of the point clouds is given by the generated reports at
60‐95 points/m2 respectively. At all three processing
periods the error is less than the dimensions of a pixel
4th Joint International Symposium on Deformation Monitoring (JISDM), 15‐17 May 2019, Athens, Greece
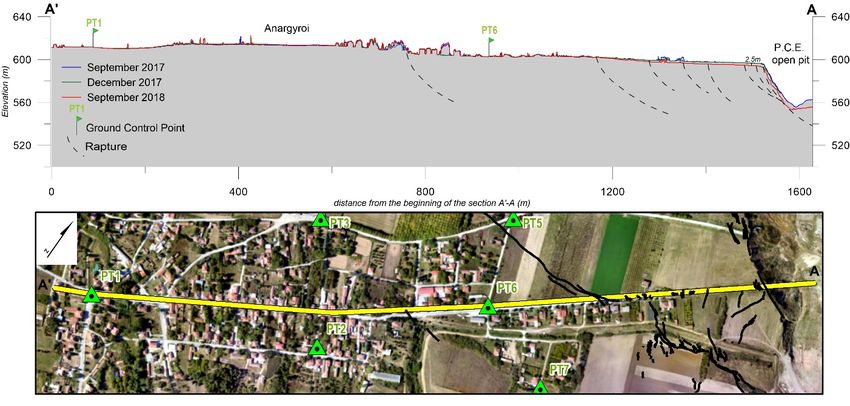
Figure 4. Two cross‐sections with normal trending showing with high accuracy and precision. The next step was to
the change of the topography across the crown of the locate the areas where the measured elevation was
landslide (top) and along the cliff created after the event different revealing surface deformation during the
(bottom). The resulted elevation profiles after the three UAS
post‐landslide period.
flights are represented with different colors at the sections.
The multi‐temporal high‐resolution ortho‐photo
The continuous black lines represent the surface fractures as
mapped on the ground and the dashed ones represent their images proved to be very helpful in mapping the surface
hypothetic underground projection. The green triangles and fractures. It was quite clear that this methodology
flags show the GCPs’ locations. provides useful tools for digitizing on screen in very
large scales as the cracks on the ground or at the houses
A large number of buildings were also affected by of the residential areas can be very obvious since the
these fractures causing the residents to move to safer image resolution allows a precise interpretation of
living places. It is more than apparent that the fractures fractures’ size and locations.
are still active since the displacement along the main Several fracture trending at different orientations
structures increases and is visible even without special were mapped on a GIS platform but two were the
equipment. dominant ones. The first cross‐section trending E‐W
It was very important to find a way to quantify the shows the largest displacement throw and seems to
rate of every displacement and it seems that one of the influence all kinds of land uses (residential, roads,
most promising methodologies include the comparison agricultural).
of the Structure‐from‐Motion photogrammetry The second cross‐section trending parallel to the
outcomes (Fonstad et al., 2013). After the three UAS landslide scarp (SE‐NW) is clearly related to the collapse
campaigns it became feasible to create elevation grids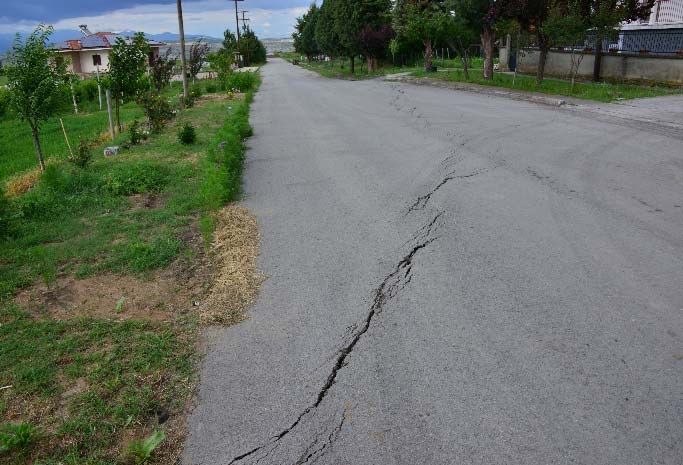
4th Joint International Symposium on Deformation Monitoring (JISDM), 15‐17 May 2019, Athens, Greece

orientation pointing to the discontinuities that are most    last campaign exceeds the 3.5 m with gradually
prominent to be activated in the immediate next phase.       increasing values from SE to NW (Figure 4).
   The comparison of the three DSMs showed that
between September 2017 and December 2017, not                                    V. CONCLUSIONS
much deformation was recorded. The entire area
                                                               The described methodology introduces a simple but
seemed to be quite stable and the height values at most
                                                             very convenient way of combining datasets containing
of the points of the point clouds were rather identical
                                                             elevation information throughout a given time period,
or changed at centimeter order. That happened when
                                                             in order to quantify the displacement rate and
the ground consisted of non‐vegetated soil or concrete,
                                                             consequently the surface deformation.
since the cultivated or forested areas covered by
                                                               Even though the data collection through the UAS
vegetation that changed in the three‐month period
                                                             campaigns proved to be quite difficult and dangerous
gave significant different elevation values.
                                                             for the humans and the equipment, as several
   This was also in agreement with the GCP
                                                             parameters had to be taken under consideration, such
measurements, which were based on the asphalt and
                                                             as the weather conditions, the continuous
no elevation change was observed.
                                                             development of the phenomenon, the failure of
   On the contrary, the comparison between the DSMs
                                                             different kinds of equipment to work together etc.
of September 2017 and September 2018 showed
                                                               Additionally, large amounts of data regarding the
significant change at the elevation values at the NE part
                                                             highest resolution that could be achieved, should be
of the area of interest. Even though, most of the GCPs
                                                             processed demanding lots of resources and long
were more or less stable, with minimum changes and
                                                             waiting times to provide accurate results. The
compatible with the errors given by the specifications
                                                             comparison between the different time periods
of the equipment, the large area neighboring the
                                                             requires long processing times as well as several
landslide crown showed significant deformation. The
                                                             software packages within Geographic Information
maximum DSM differences were located at the areas
                                                             System platform and finally determine and quantify the
that have collapsed after the major event. These were
                                                             location and the amount of deformation.
much smaller cases of collapse material coming from
                                                               The order of the surface deformation exceeds the 3
the edge of the crown and end up into the open mine
                                                             m of subsidence along the crown of the landslide at the
area. The elevation difference values at those cases
                                                             margins of the Amyntaio open pit, as measured after
exceeded the 50 meters as this was the fresh prone
                                                             comparing the DSMs of the three time periods. The
height, which was revealed after the failure.
                                                             crown trace seems to move towards the village and
   The SW part of the Anargiri village, which lies about a
                                                             getting quite dangerous for the farmers as it is very well
kilometer away from the landslide crown seems to be
                                                             imprinted by the constructed multitemporal ortho‐
stable even after a year from the first campaign and it
                                                             photo‐mosaics.
is quite certain that if the conditions remain the same
                                                               By employing the methodology described above, we
the safety of the residents could be guaranteed.
                                                             collected, processed and analyzed contemporary aerial
   The safety zone ends at the middle of the village
                                                             images acquired by a low cost UAS covering a time
development between GCPs PT2 and PT6 (Figure 4),
                                                             period of one year.
where the SW‐most surface fracture was mapped. This
                                                               The deformation rate that we calculated were not
is the western margin of the deformation area which is
                                                             homogeneous along the entire area of interest but the
rather obvious with bare eyes more to the east, where
                                                             methodology provided useful information for the
the landslide crown is located. Two cross sections
                                                             elevation difference and the trend of the subsidence,
(Figure 4) were constructed based on the DSMs’
                                                             which will probably lead to another episode of the
elevations with normal orientations.
                                                             expansion of the landslide.
   The first one (1,600 meters long) follows the main
                                                               Specifically, the deformation values exceeded the 3.5
village road from the stable area (SW) to the landslide
                                                             m delineating a wedge type subsidence with increasing
(NE) passing through the GCPs PT1 and PT6 for control
                                                             difference values from the residential area towards the
reasons and crossing the mapped surface fractures. The
                                                             unstable landslide area.
elevation difference values seem to increase at the area
                                                               It is more than clear that these campaigns and the
between PT6 and the landslide crown reaching the
                                                             multitemporal data processing depict the risk at specific
value of 2.6 m just before the recently formed prone,
                                                             locations, despite the fact that several kinds of
which was revealed after the June 2017 landslide. The
                                                             protection measures have been taken or are planned to
cross section shows the hypothetical prolongation of
                                                             be implemented in the near future by the authorities,
the fractures towards the subsurface, based on their
                                                             as the residents’ safety should be the first priority and
dimensions and orientation.
                                                             setting up an early‐warning system could be very useful.
   The second one (about 600 meters long) is located
almost parallel to the landslide main scarp. It also
trends oblique to most of the mapped fractures and the
elevation difference values between the first and the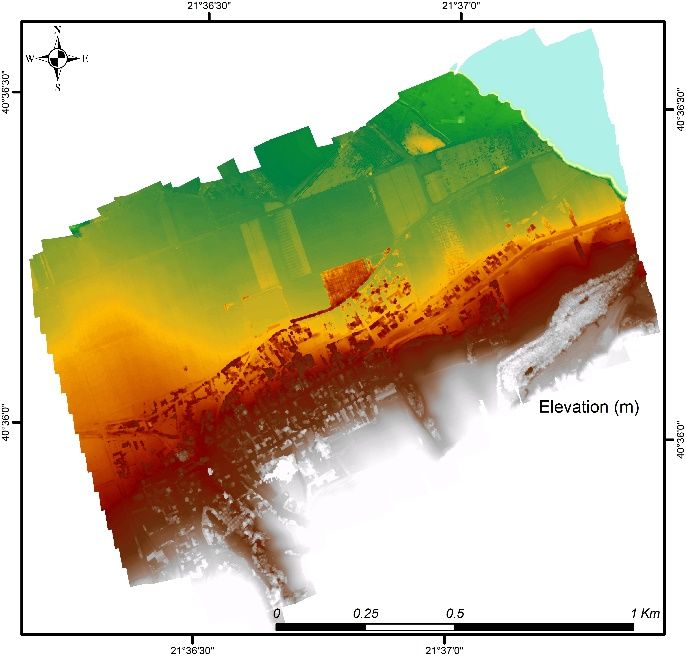
4th Joint International Symposium on Deformation Monitoring (JISDM), 15‐17 May 2019, Athens, Greece

                         References                                   Ptolemais (NW Greece): discrepancy between 40Ar/39Ar and
                                                                      astronomical ages. Palaeogeography, Palaeoclimatology,
Agisoft, (2016). Agisoft Photoscan user manual: professional
                                                                      Palaeoecology, 152, pp. 283–303.
  edition         (v.1.2),      Retrieved        23/7/2016,
  http://www.agisoft.com/pdf/photoscan‐pro_1_2_en.pdf.              Westoby, M.J., Brasington, J., Glasser, N.F., Hambrey, M.J.,
                                                                     Reynolds,      J.M.    (2012).     ‘Structure‐from‐Motion’
Anastopoulos, J. and Koukouzas, N. (1972). Economic Geology
                                                                     photogrammetry: A low‐cost, effective tool for geoscience
  of the Southern Part Ptolemais Lignite Basin (Macedonia –
                                                                     applications. Geomorphology, 179, pp. 300‐314.
  Greece). Geological & Geophysical Research, IGME, Athens.
Delogkos, E., Manzocchi, T., Childs, C., Sachanidis, C., Barbas,
  T., Scheopfer, P.J.M., Chatzipetros, A., Pavlides, S. and
  Walsh, J.J. (2016). Throw partitioning across normal fault
  zones in the Ptolemais Basin, Greece. In: Childs, C.,
  Holdsworth, R.E., Jackson, C.A.‐L., Manzocchi, T., Walsh,
  J.J., Yielding, G. (Eds.), Geometry and Growth of Normal
  Faults, vol. 439. Special Publications Geological Society,
  London.
Fiorucci, F., Giordan, D., Santangelo, M., Dutto, F., Rossi, M.,
   and Guzzetti, F. (2018). Criteria for the optimal selection of
   remote sensing optical images to map event landslides,
   Nat. Hazards Earth Syst. Sci., 18, pp. 405–417.
Fonstad, M., Dietrich, J., Courville, B., Jensen, J., Carbonneau,
  P. (2013). Topographic structure from motion: a new
  development in photogrammetric measurement. Earth
  Surface Processes and Landforms, 38, pp. 421‐430.
Fugazza, D., Scaioni, M., Corti, M., D'Agata, C., Azzoni, R.S.,
  Cernuschi, M., Smiraglia, C., Diolaiuti, G.A. (2018).
  Combination of UAV and terrestrial photogrammetry to
  assess rapid glacier evolution and map glacier hazards. Nat.
  Hazards Earth Syst. Sci., 18, pp. 1055‐1071.
Giordan, D., Hayakawa, Y., Nex, F., Remondino, F., and Tarolli,
  P. (2018). Review article: the use of remotely piloted
  aircraft systems (RPASs) for natural hazards monitoring and
  management, Nat. Hazards Earth Syst. Sci., 18, pp. 1079‐
  1096.
Granshaw, S.I., (2018). Structure from motion: origins and
  originality. The Photogrammetric Record, 33, pp. 6‐10.
Liu, C.C., Chen, P.L., Tomoya, M., and Chen, C.Y. (2015).
   Rapidly responding to landslides and debris flow events
   using a lowcost unmanned aerial vehicle, J. Remote Sens. 9,
   pp. 1–11
Mancini, F., Dubbini, M., Gattelli, M., Stecchi, F., Fabbri, S.,
 Gabbianelli, G. (2013). Using Unmanned Aerial Vehicles
 (UAV) for High‐Resolution Reconstruction of Topography:
 The Structure from Motion Approach on Coastal
 Environments. Remote Sensing, 5, 6880.
Mercier, J.L., Sorel, D., Vergely, P. & Simeakis, K. (1989).
 Extensional tectonic regimes in the Aegean basins during
 the Cenozoic. Basin Research, 2, pp. 49–71.
Niethammer, U., James, M. R., Rothmund, S., Travelletti, J.,
  and Joswig, M. (2012). UAV‐based remote sensing of the
  Super‐Sauze landslide: evaluation and results, Eng. Geol.,
  128, pp. 2–11.
Pavlides, S. and Mountrakis, D. (1987). Extensional tectonics
  of northwestern Macedonia, Greece, since the late
  Miocene. Journal of Structural Geology, 9, pp. 385–392.
Pepe, M., Fregonese, L., Scaioni, M. (2018). Planning airborne
  photogrammetry and remote‐sensing missions with
  modern platforms and sensors. European Journal of
  Remote Sensing, 51, pp. 412‐436.
Steenbrink, J., vanVugt,N., Hilgen, F.J., Wijbrans, J.R. and
  Meulenkamp, J.E. (1999). Sedimentary cycles and volcanic
  ash beds in the Lower Pliocene lacustrine succession of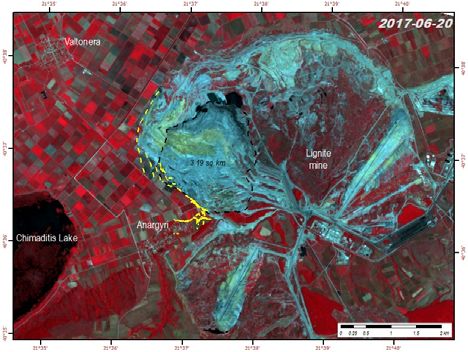
You can also read