Mundelein Park & Recreation District Community Survey - September 2021
←
→
Page content transcription
If your browser does not render page correctly, please read the page content below
Mundelein Park & Recreation District
                Community Survey

                                   September 2021

Report prepared by:
Center for Governmental Studies
Division of Outreach, Engagement and Regional Development
Northern Illinois University
DeKalb, IL 60115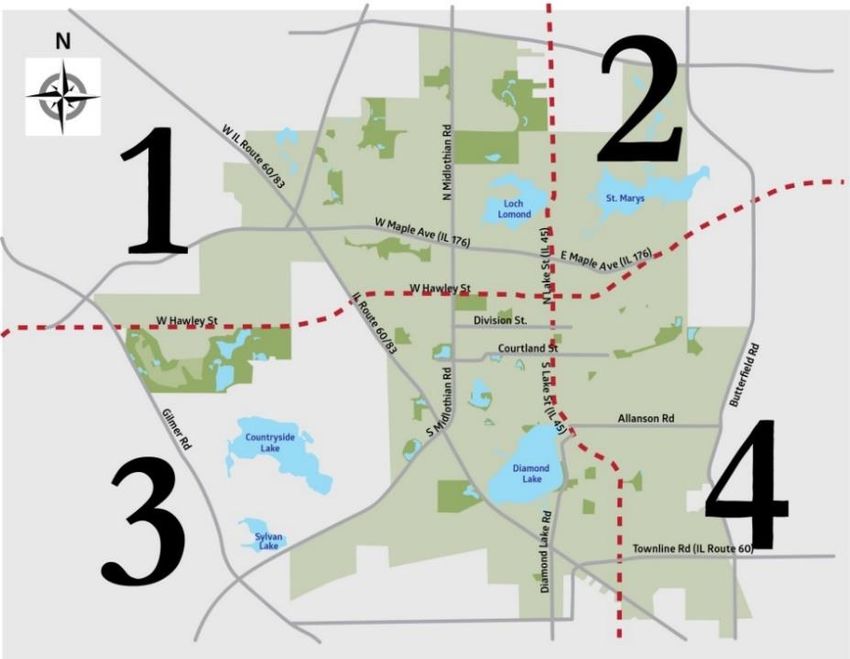
Table of Contents

Executive Summary....................................................................................................................................... 3
Introduction .................................................................................................................................................. 5
   Background and Purpose .......................................................................................................................... 5
   Methodology............................................................................................................................................. 5
Key Findings .................................................................................................................................................. 7
   Use of the Mundelein Park & Recreation District ..................................................................................... 7
   Value of the Mundelein Park & Recreation District................................................................................ 28
   Future Direction of the Mundelein Park & Recreation District .............................................................. 36
   Sources of Information About the Mundelein Park & Recreation District ............................................. 40
   Characteristics of Respondents and Their Households .......................................................................... 43
Conclusions and Recommendations ........................................................................................................... 45
Appendix A: Questionnaire (English and Spanish Version)......................................................................... 46
Appendix B: Survey Materials (Email and Postcard) ................................................................................... 67
Appendix C: Verbatim Comments............................................................................................................... 71

Executive Summary

The Mundelein Park & Recreation District commissioned the Center for Governmental Studies
(CGS) at Northern Illinois University to conduct an online survey of residents. The purpose of the
survey was to gather their opinions about the MPRD’s value to the community, their future use
of programs, parks, and facilities, and priorities for the future development of parks and
recreation facilities. A total of 500 completed surveys was received.

Key Findings

Use of the Mundelein Park & Recreation District
• More than four-fifths (85.5%) of respondents indicate that their household is likely to use the
   MPRD facilities, programs, or services during the next two-three years, with 62.3% indicating
   their household is very likely.
• Four-fifths or more of respondents are aware of the Barefoot Bay Aquatic Center (98.5%),
   Diamond Lake Beach (96.4%), community center (90.0%), athletic fields at Community Park
   or Keith Mione Community Park (81.6%), Spray Park (80.8%), and the indoor pool (80.2%).
• More than two-thirds (67.2%) of respondents state that their household would be likely to
   use the Barefoot Bay Aquatic Center more than six times a year during the next two-three
   years. Less than one-half of respondents report that their household would be likely to use
   the other parks and facilities asked about in the survey more than six times a year during the
   next two-three years.
• The majority (96.5%) of respondents say that their household would be likely to participate
   in one or more of the MPRD activities asked about in the survey during the next two-three
   years. 68.9% of adults aged 50 or greater would be likely to participate in active adult
   activities, 67.7% of respondents with children in their household under the age of 18 would
   be likely to participate in youth athletics, and 52.4% of respondents with teens in their
   household would be likely to participate in teen programming during the next two-three
   years. Two-fifths or less of respondents state someone in their household would be likely to
   participate in the other activities asked about in the survey.
• When asked which factors would increase their household’s use of the MPRD parks, facilities,
   or programs in the future the most frequent responses are the addition of programs, facilities,
   or activities that their household is interested in (56.9%), lower fees (44.9%), and better
   communication of what is offered (36.3%).
• The majority of respondents report that the MPRD would be their household’s first choice for
   a community center (77.5%), a fitness center (70.6%), adult athletics (69.3%), youth athletics
   (63.5%), a preschool (53.3%), and teen athletics (52.5%).

                                                                                                3
Value of the Mundelein Park & Recreation District
• Almost all (96.0%) of the respondents believe the MPRD is valuable to their community, with
   67.8% indicating it is very valuable. Compared with 85.9% of the respondents who think the
   MPRD is valuable to their household, with 54.9% indicating it is very valuable.
• The majority of respondents believe that the following MPRD programs are valuable to their
   household.
   ➢ Programs for grade-school aged children (96.0%)
   ➢ Programs for preschool-aged children (93.8%)
   ➢ Programs for teens (92.8%)
   ➢ Programs for active adults (85.5%)
   ➢ Programs for adults (83.7%)
• Most respondents whose annual household income is less than $25,000 (88.0%), $25,000 to
   less than $50,000 (97.6%), or $50,000 to less than $75,000 (80.1%) would be more likely to
   enroll in programs if the MPRD offered financial assistance to eligible households.

Future Direction of the Mundelein Park & Recreation District
• Respondents rank Diamond Lake Beach, the fitness center, and the parks as the top three
   priorities the MPRD should invest funds in to improve or maintain in the next five years.
• Respondents rank a dog park and an arts and cultural center as the top two priorities the
   MPRD should invest funds in to construct or develop in the next five years.

Sources of Information About the Mundelein Park & Recreation District
• Three-fourths (74.6%) of the respondents report that the program guide is a source of
   information about the MPRD for them, with 44.6% indicating it is their main source of
   information. More than two-fifths (43.3%) of respondents state that the Park District website
   is a source of information for them, with 23.4% saying it is their primary source of information
   about the MPRD. More than one-third (34.8%) of respondents indicate that the Park District
   e-newsletter is a source of information for them, however it is the main source of information
   for less than one-tenth (6.9%).
• The majority (84.8%) of respondents would prefer to receive information from the MPRD in
   English. More than one-half (53.3%) of Latino respondents would prefer to receive
   information in English and 46.7% would prefer to receive information in Spanish.

                                                                                                 4
Introduction

Background and Purpose
The Mundelein Park and Recreation District (MPRD) commissioned the Center for Governmental
Studies (CGS) at Northern Illinois University to conduct a survey of residents to gather their
opinions about the MPRD’s value to the community, their future use of programs, parks, and
facilities, and priorities for the future development of parks and recreation facilities. An online
survey was administrated to a random sample of households in the MPRD service area. The
findings of the survey will be used for strategic planning.

Methodology

Questionnaire
A 28-question survey was developed by CGS and the MPRD staff. The following topics were
covered in the questionnaire:

•   Use of the MPRD,
•   Value of the MPRD,
•   Future direction of the MPRD, and
•   Sources of information about the MPRD.

The questionnaire was translated into Spanish. The questionnaire may be found in Appendix A.

Sample
A random sample of 3,000 households within the MPRD service area was provided by the
Marketing Systems Group, a survey sampling firm. The sample included names, mailing
addresses, and email addresses.

Pretest
CGS pretested the questionnaire with approximately 20 households. The pretest was designed
to gauge whether the respondents understood the questions being asked and could provide the
necessary information.

Data Collection
Each household in the random sample was sent an invitation email with a unique ID code and a
link to the survey. This email may be found in Appendix B.

Follow-up communications are important to get responses from as high a proportion of the
sample as possible, as harder to reach respondents often have different experiences and

                                                                                                 5
responses than easier to reach respondents. Therefore, CGS sent up to six reminder emails to
those who did not respond after the initial email. Additionally, up to two postcards were sent
through the mail to nonrespondents. The postcards included the survey URL and their unique ID
code (See Appendix B).

The survey was open from March 15, 2021 to June 20, 2021.

A total of 500 completed surveys were received. The margin of error for the survey is +/- 4.3
percentage points at the 95 percent level of confidence.

Data Analysis

The data was weighted on age, gender, race/ethnicity, and annual household income using
information provided by the Marketing Systems Group. Data weighting on key demographic
variables ensures that respondents to the survey are representative of the population of all adults
in the MPRD service area and that the findings can be generalized to the total adult population.

Chi-square tests were used to test significance between demographic groups. All demographic
differences reported are statistically significant at the p ≤ 0.05 level.

                                                                                                 6
Key Findings

Use of the Mundelein Park & Recreation District

The respondents were first asked a set of questions regarding their household’s future use of the
MPRD. The respondents were asked about the likelihood of using the MPRD during the next two-
three years, awareness and use of MPRD parks and facilities during the next two-three years,
participation in MPRD activities during the next two-three years, preferred method of registering
for programs and memberships, preferred times, length, and frequency of programs, additional
programs, facilities, and activities interested in or need, and their household’s first choice of
location (MPRD, another park district, private facility/organization) for activities.

More than four-fifths (85.5%) of respondents indicate that their household is likely to use the
MPRD facilities, programs, or services during the next two-three years, with 62.3% indicating
their household is very likely (Figure 1).

      Figure 1: Likelihood of Household Using the MPRD During Next Two-Three Years
During the next two-three years, how likely are you or anyone in your household to use the
Mundelein Park and Recreation District (MPRD) facilities, programs, or services?

                             Not Very Likely            Not At All Likely
                                 11.4%                       3.1%

           Somewhat Likely
               23.2%

                                                                                   Very
                                                                                  Likely
                                                                                  62.3%

Demographic Differences

•   The percentage of respondents who indicate that their household is very likely to use the
    MPRD facilities, programs or services during the next two-three years is highest among those
    aged 30-49 (74.2%) and lowest among those aged 18-29 (54.8%). Approximately three-fifths

                                                                                               7
of those aged 50-64 (60.3%) and those aged 65+ (57.1%) report their household is very likely
    to use the MPRD facilities, programs, or services during the next two-three years.
•   Non-Latino respondents (67.6%) are more likely than Latino respondents (55.6%) to report
    that their household is very likely to use the MPRD facilities, programs, or services during the
    next two-three years.
•   Respondents with children in their household under the age of 18 (71.0%) are more likely
    than respondents with no children in their household under the age of 18 (51.1%) to state
    that their household is very likely to use the MPRD facilities, programs, or services during the
    next two-three years.
Respondents were asked if they are aware of and whether their household would be likely to use
33 MPRD parks and facilities more than six times a year during the next two-three years. Four-
fifths or more of respondents are aware of the Barefoot Bay Aquatic Center (98.5%), Diamond
Lake Beach (96.4%), community center (90.0%), athletic fields at Community Park or Keith Mione
Community Park (81.6%), Spray Park (80.8%), and indoor pool (80.2%). More than two-thirds
(67.2%) of respondents state that their household would be likely to use the Barefoot Bay Aquatic
Center more than six times a year during the next two-three years. Less than one-half of
respondents report that their household would be likely to use the other parks and facilities
asked about in the survey more than six times a year during the next two-three years (Table 1).

Table 1: Awareness and Household’s Use of MPRD Parks and Facilities During the Next Two-
Three Years
              Are you aware of each of the following MPRD parks and facilities?
 During the next two-three years, would your household be likely to use, more than six times a
                    year, each of the following MPRD parks and facilities?

      Park/Facility                                                          Use More Than
                                                             Awareness       Six Times a Year
      Barefoot Bay Aquatic Center                              98.5%               67.2%
      Diamond Lake Beach                                       96.4%               43.5%
      Community Center                                         90.0%               36.2%
      Athletic Fields at Community Park or Keith Mione
      Community Park                                            81.6%             46.0%
      Spray Park                                                80.8%             45.2%
      Indoor Pool                                               80.2%             39.3%
      Steeple Chase Golf Course                                 73.2%             29.8%
      Ice Skating Rink                                          72.2%             28.1%
      Dunbar Recreation Center                                  70.7%             34.6%
      Big & Little Child Development Center                     64.1%             8.3%

                                                                                                  8
Park/Facility                                                         Use More Than
                                                           Awareness       Six Times a Year
     Park Shelters                                           62.3%               32.7%
     Regent Center                                           60.5%               23.1%
     Diamond Lake Sports Complex (Athletic Fields)           58.1%               31.4%
     Athletic Practice Fields                                57.0%               34.2%
     Boat Launch                                             54.7%               14.3%
     Mundelein Heritage Museum                               54.1%               25.1%
     Learning Center Preschool                               48.7%               16.7%
     Fairhaven Park                                          48.1%               30.2%
     NovaCare Fitness Center                                 46.7%               27.8%
     Skate Park                                              46.0%               15.0%
     Kracklauer Dance Studio                                 44.0%               11.1%
     Hanrahan Park                                           40.2%               35.1%
     Asbury Park                                             38.8%               29.3%
     Cambridge County Park                                   32.6%               31.3%
     Leo Leathers Park                                       31.4%               24.6%
     Bob Lewandowski Park                                    29.7%               23.3%
     Clearbrook Park                                         29.0%               23.8%
     Garden Plots                                            28.9%               9.9%
     Maurice Noll Park                                       26.6%               20.2%
     Scott Brown Park                                        25.8%               19.1%
     Wortham Park                                            25.0%               15.0%
     Gordon Ray Park                                         22.5%               17.5%
     Other                                                   6.2%                1.7%

Other parks and facilities the respondents mention they are aware of include Memorial Park,
Longmeadow Park, Kracklauer Park, Holcomb Park, and Lakewood Heights Park. The respondents
indicate their household would be likely to use Kracklauer Park more than six times a year during
the next two-three years.

Demographic Differences
Awareness
• Latino respondents (98.9%) are more likely than non-Latino (85.9%) respondents to be aware
  of the community center.
• Respondents aged 30-49 (82.3%), respondents aged 50-64 (91.2%), and respondents aged
  65+ (83.0%) are more likely than respondents aged 18-29 (69.4%) to be aware of the athletic
  fields at Community Park or Keith Mione Community Park.
                                                                                               9
•   Respondents who have no children in their household under the age of 18 (90.2%) are more
    likely than respondents who have children in their household under the age of 18 (73.8%) to
    be aware of the indoor pool.
•   Respondents aged 50 or greater (85.5%) are more likely than respondents aged less than 50
    (63.0%) to be aware of the Steeple Chase Golf Course.
•   Non-Latino respondents (88.0%) are more likely than Latino respondents (38.0%) to be aware
    of the Steeple Chase Golf Course.
•   Respondents who have children in their household under the age of 18 (71.1%) are more
    likely than respondents who do not have children in their household under the age of 18
    (60.9%) to be aware of the Big & Little Child Development Center.
•   Respondents who live in Area 3 (87.5%) are most likely to be aware of the Regent Center,
    followed by respondents who live in Area 1 (61.2%) or Area 4 (48.8%). Respondents who live
    in Area 2 (33.3%) are least likely to be aware of the Regent Center.
•   Respondents who have lived in the MPRD service area more than 5 years (72.9%) are more
    likely than respondents who have lived in the MPRD service area 5 years or less (10.9%) to be
    aware of the Regent Center.
•   Non-Latino respondents (64.8%) are more likely than Latino respondents (46.7%) to be aware
    of the Diamond Lake Sports Complex (athletic fields).
•   Respondent who have no children in their household under the age of 18 (73.8%) are more
    likely than respondents who have children in their household under the age of 18 (42.6%) to
    be aware of the Mundelein Heritage Museum.
•   Respondents who live in Area 3 (72.2%) and respondents who live in Area 4 (65.0%) are more
    likely than respondents who live in Area 1 (31.4%) and respondents who live in Area 2 (28.0%)
    to be aware of the Learning Center Preschool (See Appendix A for map of areas).
•   Latino respondents (63.3%) are more likely than non-Latino (41.2%) respondents to be aware
    of the Learning Center Preschool.
•   Respondents who have children in their household under the age of 18 (58.8%) are more
    likely than respondents who do not have children in their household under the age of 18
    (35.2%) to be aware of the Learning Center Preschool.
•   Respondents who have lived in the MPRD service area more than 5 years (53.4%) are more
    likely than respondents who have lived in the MPRD service area 5 years or less (23.6%) to be
    aware of the NovaCare Fitness Center.
•   Respondents who have lived in Mundelein more than 5 years (53.4%) are more likely than
    respondents who have lived in Mundelein 5 years or less (9.1%) to be aware of the Kracklauer
    Dance Studio.
•   Latino respondents (63.3%) are more likely than non-Latino (35.7%) respondents to be aware
    of the Kracklauer Dance Studio.
•   Respondents who live in Area 1 (52.9%) are more likely than respondents who live in Area 2
    (29.2%), Area 3 (32.6%), or Area 4 (23.8%) to be aware of Asbury Park.

                                                                                              10
• Respondents who live in Area 3 (37.2%) and respondents who live in Area 4 (40.0%) are more
likely than respondents who live in Area 1 (9.9%) and respondents who live in Area 2 (8.3%)
to be aware of Bob Lewandowski Park.
• Respondents who have lived in the MPRD service area more than 5 years (23.3%) are more
likely than respondents who have lived in the MPRD service area 5 years or less (3.7%) to be
aware of Scott Brown Park.
• Respondents who live in Area 3 (33.3%) are more likely than respondents who live in Area 1
(9.9%), respondents who live in Area 2 (4.2%), and respondents who live in Area 3 (16.9%) to
be aware of Wortham Park.
• Respondents who live in Area 3 (25.6%) and respondents who live in Area 4 (23.1%) are more
likely than respondents who live in Area 1 (13.4%) and respondents who live in Area 2 (4.2%)
to be aware of Gordon Ray Park.
• Respondents who have lived in the MPRD service area more than 5 years (21.7%) are more
likely than respondents who have lived in the MPRD service area 5 years or less (3.6%) to be
aware of Gordon Ray Park.
Use More Than Six Times a Year
• Respondents who have children in their household under the age of 18 (85.6%) are more
likely than respondents who do not have children in their household under the age of 18
(37.4%) to use Barefoot Bay Aquatic Center more than six times a year during the next two-
three years.
• Respondents who live in Area 4 (81.0%) are most likely to use Diamond Lake Beach more
than six times a year during the next two-three years, followed by respondents who live in
Area 3 (53.7%). Respondents who live in Area 1 (21.7%) and respondents who live in Area 2
(12.5%) are least likely to use the Diamond Lake Beach more than six times a year during the
next two-three years.
• Respondents who have children in their household under the age of 18 (56.1%) are more
likely than respondents who do not have children in their household under the age of 18
(16.9%) to use the Diamond Lake Beach more than six times a year during the next two-three
years.
• Latino respondents (62.6%) are more likely than non-Latino respondents (23.7%) to use the
community center more than six times a year during the next two-three years.
• Respondents who have children in their household under the age of 18 (41.2%) are more
likely than respondents who do not have children in their household under the age of 18
(23.6%) to use the community center more than six times a year during the next two-three
years.
• Respondents who have children in their household under the age of 18 (65.0%) are more
likely than respondents who do not have children in their household under the age of 18
(16.9%) to use the athletic fields at Community Park or Keith Mione Community Park more
than six times a year during the next two-three years.
11• Latino respondents (60.8%) are more likely than non-Latino respondents (30.9%) to use the
indoor pool more than six times a year during the next two-three years.
• Respondents who have children in their household under the age of 18 (42.2%) are more
likely than respondents who do not have children in their household under the age of 18
(24.7%) to use the indoor pool more than six times a year during the next two-three years.
• Male respondents (49.6%) are more likely than female respondents (12.6%) to use the
Steeple Chase Golf Course more than six times a year during the next two-three years.
• Respondents with children in their household under the age of 18 (34.7%) are more likely
than respondents with no children in their household under the age of 18 (20.2%) to use the
ice skating rink more than six times a year during the next two-three years.
• Respondents who have children in their household under the age of 18 (44.9%) are more
likely than respondents who do not have children in their household under the age of 18
(8.0%) to use the Diamond Lake Sports Complex (athletic fields) more than six times a year
during the next two-three years.
• Respondents who have children in their household under the age of 18 (45.2%) are more
likely than respondents who do not have children in their household under the age of 188
(15.7%) to use the athletic practice fields more than six times a year during the next two-
three years.
• Respondents who live in Area 4 (44.7%) are more likely than respondents who live in Area 1
(3.4%), respondents who live in Area 2 (1.0%), and respondents who live in Area 3 (12.8%) to
use the Learning Center Preschool more than six times a year during the next two-three
years.
• Respondents who live in Area 2 (58.3%) are more likely than respondents who live in Area 1
(29.1%), respondents who live in Area 3 (30.2%), and respondents who live in Area 4 (40.0%)
to use Hanrahan Park more than six times a year during the next two-three years.
• Respondents who have children in their household under the age of 18 (34.0%) are more
likely than respondents who do not have children in their household under the age of 18
(17.6%) to use the Asbury Park more than six times a year during the next two-three years.
• Respondents who have children in their household under the age of 18 (32.4%) are more
likely than respondents who do not have children in their household under the age of 18
(3.6%) to use the Leo Leathers Park more than six times a year during the next two-three
years.
• Respondents who have children in their household under the age of 18 (41.1%) are more
likely than respondents who do not have children in their household under the age of 18
(10.5%) to use the Bob Lewandowski Park more than six times a year during the next two-
three years.
• Respondents who have children in their household under the age of 18 (41.8%) are more
likely than respondents who do not have children in their household under the age of 18
(7.1%) to use the Clearbrook Park more than six times a year during the next two-three years.
12• Respondents who have children in their household under the age of 18 (37.0%) are more
likely than respondents who do not have children in their household under the age of 18
(2.4%) to use the Scott Brown Park more than six times a year during the next two-three
years.
• Respondents who have children in their household under the age of 18 (29.1%) are more
likely than respondents who do not have children in their household under the age of 18
(8.2%) to use the Gordon Ray Park more than six times a year during the next two-three
years.
The majority (96.5%) of respondents say that their household would be likely to participate in
one or more of the MPRD activities asked about in the survey during the next two-three years.
More than three out of ten respondents report that someone in their household would be likely
to participate in youth athletics (41.9%), fitness/wellness/health activities (38.6%), cultural arts
activities (36.7%), adult athletics (36.0%), nature/outdoor education (33.3%), and active adult
activities (31.8%) during the next two-three years. Less than one-fourth of respondents state
someone in their household would be likely to participate in the other activities asked about in
the survey (Figure 2).
13Figure 2: Household Participation in Activities During the Next Two-Three Years
During the next two-three years, in which of the following activities would your household
likely participate? (CHECK ALL THAT APPLY)
Youth Athletics 41.9%
Fitness/Wellness/Health 38.6%
Cultural Arts 36.7%
Adult Athletics 36.0%
Nature/Outdoor Education 33.3%
Active Adult 31.8%
Golf 21.6%
Teen Programming 19.4%
Summer Camps 18.7%
Swim Instruction 16.2%
Dance 12.3%
Preschool 9.5%
Early Childhood/Preschool Enrichment 8.3%
Before and After School Care 6.6%
Party Planning 5.2%
Childcare 2.4%
None 3.5%
0% 10% 20% 30% 40% 50% 60% 70% 80% 90% 100%
Demographic Differences
• Respondents aged 50 or greater (54.6%) are more likely than respondents aged less than 50
(27.0%) to state that someone in their household would be likely to participate in
fitness/wellness/health activities during the next two-three years.
• Respondents with children in their household under the age of 18 (41.6%) are more likely
than respondents with no children in their household under the age of 18 (18.1%) to report
that someone in their household would be likely to participate in nature/outdoor education
activities during the next two-three years.
• Respondents whose annual household income is $100,000 or more (40.3%) are more likely
than respondents whose annual household income is 50,000 or less (18.2%) and respondents
whose annual household income is $50,000 to less than $100,000 (22.6%) to indicate that
someone in their household would be likely to participate in active adult activities during the
next two-three years.
1467.7% of respondents who have children in their household under the age of 18 indicate their
household would likely participate in youth athletics during the next two-three years.
68.9% of respondents aged 50 or greater report their household would likely participate in active
adult activities during the next two-three years.
52.4% of respondents who have teens in their household indicate their household would likely
participate in teen programming during the next two-three years.
28.0% of respondents who have children in their household under the age of 18 state their
household would likely participate in summer camps during the next two-three years.
31.1% of respondents who have children aged 5-12 in their household indicate their household
would likely participate in swim instruction during the next two-three years.
40.6% of respondents who have children aged 0-4 in their household say their household would
likely participate in preschool during the next two-three years.
32.8% of respondents who have children aged 0-4 in their household report their household
would likely participate in early childhood/preschool enrichment activities during the next two-
three years.
The respondents were next asked, “What programs would you like the MPRD to add in the
future?” The respondents would be interested in a wide variety of programs. The most common
responses are children’s programs (19.4%) and sports (14.6%) (Table 2) (See Appendix C for
verbatim comments).
15Table 2: Suggestions for Additional Programs
What programs would you like the MPRD to add in the future? (MULTIPLE RESPONSES
POSSIBLE)
Program Percent
Children’s programs 19.4
Sports 14.6
Art and Crafts/Hobbies 9.7
Aquatic 8.7
Senior programs 6.8
Dance 4.9
Fitness/Wellness/Health 4.9
Teen programs 3.9
Other programs 15.5
None 7.8
Don’t know 8.7
Other comments 14.6
Most respondents (80.7%) would prefer to register for MPRD programs and memberships online.
One-fourth (24.6%) of respondents would prefer to register in person at a MPRD facility (Figure
3).
16Figure 3: Preferred Method for Registering for Programs and Memberships
How would you prefer to register for MPRD programs and memberships? (CHECK ALL THAT
APPLY)
Online 80.7%
In person at MPRD facility 24.6%
Phone 10.4%
No preference 12.1%
Other method 0.5%
Would not register for programs/memberships 4.1%
0% 10% 20% 30% 40% 50% 60% 70% 80% 90% 100%
Demographic Differences
• Non-Latino respondents (86.6%) are more likely than Latino respondents (66.7%) to prefer to
register online for MPRD programs and memberships.
• Respondents aged 65 or greater (48.0%) are more likely than respondents aged 18-29 (0.0%),
respondents aged 30-49 (29.3%), and respondents aged 50-64 (23.2%) to prefer to register in
person at a MPRD facility for programs and memberships
Next, respondents were asked about their household’s preferred times, length, and frequency of
programs.
Early Childhood Programs
Respondents report their household’s most preferred times for early childhood programs are
weekend morning. Their most preferred length is eight weeks and their most preferred frequency
is once or twice a week or drop-in (Table 3).
Youth
Respondents indicate their household’s most preferred times for youth programs are weekend
morning and weekday evening. Their most preferred length is eight weeks. Their most preferred
frequency is twice a week. (Table 3).
17Teen
Respondents indicate their household’s most preferred times for teen programs are weekday
evening or weekend morning. Their most preferred length is eight weeks and their most
preferred frequency is twice a week (Table 3).
Adult
Respondents indicate their household’s most preferred times for adult programs are weekday
evening. However, a large percentage of respondents prefer weekend morning and afternoon.
Their most preferred length is 4 or 6 weeks. Their most preferred frequency is once a week (Table
3).
Active Adult
Respondents indicate their household’s most preferred times for active adult programs are
weekend morning, followed by weekday afternoon and weekend evening. Their most preferred
length is 4 or 8 weeks and their most preferred frequency is twice a week (Table 3).
Table 3: Preferred Times, Length, and Frequency for Programs
What is your or members of your household’s preferred times for … programs? (CHECK ALL
THAT APPLY)
What is your or members of your household’s preferred program length for … programs?
What is your or members of your household’s preferred program frequency for … programs?
Program Times Length Frequency
Early • Weekday morning (35.4%) • 1 week (0.3%) • Drop-in (26.3%)
Childhood • Weekday afternoon (32.3%) • 4 weeks (27.1%) • Once a week (31.3%)
• Weekday evening (38.5%) • 6 weeks (7.1%) • Twice a week (28.7%)
• Weekend morning (54.2%) • 8 weeks (65.6%) • More than three times
• Weekend afternoon (13.5%) a week (13.8%)
Youth • Weekday morning (2.9%) • 1 week (2.1%) • Drop-in (3.8%)
• Weekday afternoon (6.4%) • 4 weeks (32.3%) • Once a week (25.5%)
• Weekday evening (62.1%) • 6 weeks (10.4%) • Twice a week (68.1%)
• Weekend morning (80.7%) • 8 weeks (55.2%) • More than three times
• Weekend afternoon (45.0%) a week (2.7%)
Teen • Weekday morning (0.0%) • 1 week (2.2%) • Drop-in (9.2%)
• Weekday afternoon (9.7%) • 4 weeks (34.8%) • Once a week (35.8%)
• Weekday evening (63.4%) • 6 weeks (22.0%) • Twice a week (47.0%)
• Weekend morning (61.3%) • 8 weeks (41.1%) • More than three times
• Weekend afternoon (46.2%) a week (8.0%)
18Program Times Length Frequency
Adult • Weekday morning (20.8%) • 1 week (1.6%) • Drop-in (7.3%)
• Weekday afternoon (7.3%) • 4 weeks (34.8%) • Once a week (63.1%)
• Weekday evening (63.5%) • 6 weeks (35.4%) • Twice a week (23.4%)
• Weekend morning (58.4%) • 8 weeks (28.2%) • More than three times
• Weekend afternoon (51.7%) a week (6.1%)
Active • Weekday morning (29.7%) • 1 week (9.4%) • Drop-in (15.6%)
Adult • Weekday afternoon (42.8%) • 4 weeks (34.1%) • Once a week (34.6%)
• Weekday evening (40.0%) • 6 weeks (21.0%) • Twice a week (41.6%)
• Weekend morning (45.5%) • 8 weeks (35.5%) • More than three times
• Weekend afternoon (37.9%) a week (8.2%)
Demographic Differences
• Male respondents (77.1%) are more likely than female respondents (52.8%) to prefer
weekday evening for adult programs.
• Female respondents (65.2%) are more likely than male respondents (49.4%) to prefer
weekend morning for adult programs.
• Male respondents (46.3%) are more likely than female respondents (20.7%) to prefer adult
programs be 4 weeks long.
• Male respondents (76.9%) are more likely than female respondents (50.6%) to prefer adult
programs be once a week.
• Female respondents (58.3%) are more likely than male respondents (24.6%) to prefer active
adult programs be 8 weeks long.
• Male respondents (40.6%) are more likely than female respondents (23.3%) to prefer active
adult programs be 4 weeks long.
• Female respondents (50.8%) are more likely than male respondents (34.8%) to prefer active
adult programs be twice a week.
The respondents were asked which factors would increase their household’s use of the MPRD
parks, facilities or programs in the future. More than one-half (56.9%) of respondents state that
if programs, facilities, or activities were added that their household is interested it would increase
their use of the MPRD. More than two-fifths (44.9%) of respondents say lower fees would
increase their use of the MPRD and more than one-third (36.3%) indicate better communication
of what is offered would increase their use of the MPRD (36.3%) (Figure 4).
19Figure 4: Factors That Would Increase Use of the MPRD
In the future, what would increase your household’s use of the parks, facilities, or programs of
the MPRD? (CHECK ALL THAT APPLY)
Programs, facilities, activities were added that we
56.9%
are interested in or need
Lower fees 44.9%
Better communication of what is offered 36.3%
More convenient times of programs 18.6%
Staff and/or instructors that communicate in my
13.8%
household's primary language
More convenient hours of operation 13.8%
More convenient location 9.1%
Easier registration process 6.1%
Other 5.0%
0% 10% 20% 30% 40% 50% 60% 70% 80% 90% 100%
Other responses include they do not have the free time to use the MPRD, they would like
childcare to be provided, they would like discounts for larger families, and they would like
transportation to be provided.
Demographic Differences
• Respondents aged 18-29 (85.5%) are more likely than respondents aged 30-49 (52.6%),
respondents aged 50-64 (55.1%), and respondents aged 65 or greater (38.0%) to state that if
programs, facilities, or activities were added that their household is interested it would
increase their use of the MPRD.
• Respondents whose annual household income is $50,000 or less (83.3%) are more likely than
respondents whose annual household income is $50,000 to less than $100,000 (49.1%) and
respondents whose annual household income is $100,000 or more (22.4%) to indicate that if
the fees were lower it would increase their use of the MPRD.
• Latino respondents (40.0%) are more likely than non-Latino respondents (1.1%) to say that if
there were staff and/or instructors that communicate in their household’s primary
language it would increase their use of the MPRD.
20The respondents were next asked, “Which programs, facilities, or activities that you are
interested in or need would you like to see added?” More than one-fifth of respondents would
be interested in or need sports (27.5%), arts and crafts/hobbies (23.2%), children’s (23.2%), and
fitness/wellness/health programs, facilities, and activities (20.3%) (Table 4) (See Appendix C for
verbatim comments).
Table 4: Additional Programs, Facilities, or Activities Interested in or Need
Which programs, facilities, or activities that you are interested in or need would you like to see
added? (MULTIPLE RESPONSES POSSIBLE)
Program/Facility/Activity Percent
Sports 27.5
Arts and crafts/Hobbies 23.2
Children’s 23.2
Fitness/Wellness/Health 20.3
Aquatics 10.1
Dance 8.7
Other Program/Facility/Activity 15.9
Don’t know 10.1
Other comments 7.2
The respondents were asked which location would be their household’s first choice for six
activities. If the respondent did not select the MPRD as their household’s first choice for an
activity they were asked the reasons why.
The majority (77.5%) of respondents report that the MPRD would be their household’s first
choice for a community center (Figure 5). The most frequent reasons given by those respondents
whose household would not select the MPRD as their first choice for a community center are
they are not familiar with the facility (37.7%) and that the location is not convenient (34.0%).
21Figure 5: Household’s First Choice for a Community Center
Which location would be your household’s first choice for a community center?
A Private Facility or A Private Facility
Organization in or Organization
Mundelein Outside
13.6% Mundelein
3.4%
Another Park District
5.5%
MPRD
77.5%
Demographic Differences
• No significant differences are found for first choice for a community center by respondent’s
age, respondent’s gender, respondent’s race/ethnicity, annual household income, location of
residence in the MPRD service area, and years living in the MPRD service area.
More than three-fifths (63.5%) of respondents report that the MPRD would be their household’s
first choice for youth athletics (Figure 6). The most common reasons given by those respondents
whose household would not select the MPRD as their first choice for youth athletics are that
there are not enough Spanish-speaking staff (38.0%) and the price is too high (36.0%).
22Figure 6: Household’s First Choice for Youth Athletics
Which location would be your household’s first choice for youth athletics?
A Private Facility
A Private Facility or or Organization
Organization in Outside
Mundelein Mundelein
27.0% 1.5%
MPRD
63.5%
Another Park District
8.0%
Demographic Differences
• The percentage of respondents who indicate that the MPRD would be their household’s first
choice for youth athletics increases with increasing annual household income (less than
$50,000, 50.0%; $50,000 to less than $100,000, 61.1%; $100,000 or more, 76.9%).
• Non-Latino respondents (81.0%) are more likely than Latino respondents (35.3%) to report
that the MPRD would be their household’s first choice for youth athletics.
More than one-half (52.5%) of respondents state that the MPRD would be their household’s first
choice for teen athletics (Figure 7). Those respondents whose household would not select the
MPRD as their first choice for teen athletics provide a variety of reasons why. The top two reasons
are that the price is too high (42.6%) and the location is not convenient (34.0%). Other reasons
include that their teen does sports at their high school and their teen is at an advanced or
competitive level.
23Figure 7: Household’s First Choice for Teen Athletics
Which location would be your household’s first choice for teen athletics?
A Private Facility
or Organization
Outside
Mundelein
15.2%
A Private Facility or MPRD
Organization in 52.5%
Mundelein
22.2%
Another Park District
10.1%
Demographic Differences
• The percentage of respondents who indicate that the MPRD would be their household’s first
choice for teen athletics increases with increasing annual household income (less than
$50,000, 44.4%; $50,000 to less than $100,000, 54.2%; $100,000 or more, 60.5%).
Seven out of ten (69.3%) respondents state that the MPRD would be their household’s first choice
for adult athletics (Figure 8). Those respondents whose household would not select the MPRD as
their first choice for adult athletics indicate that the price is too high (34.5%), the times offered
are not convenient (32.8%), and the location is not convenient (27.6%).
24Figure 8: Household’s First Choice for Adult Athletics
Which location would be your household’s first choice for adult athletics?
A Private Facility
or Organization
Outside
Mundelein
11.6%
A Private Facility or
Organization in
Mundelein
12.2%
Another Park District MPRD
6.9% 69.3%
Demographic Differences
• The percentage of respondents who state that the MPRD would be their household’s first
choice for adult athletics increases with increasing annual household income (less than
$50,000, 63.6%; $50,000 to less than $100,000, 70.7%; $100,000 or more, 78.3%).
Seven out of ten (70.6%) respondents state that the MPRD would be their household’s first choice
for a fitness center (Figure 9). Those respondents whose household would not select the MPRD
as their first choice for a fitness center provide a variety of reasons why. The top three reasons
are they have never visited the facility (18.8%), there are not enough Spanish speaking staff
(17.2%), and the price is too high (15.6%). Another reason mentioned is that they have a fitness
center where they live.
25Figure 9: Household’s First Choice for a Fitness Center
Which location would be your household’s first choice for a fitness center?
A Private Facility
or Organization
Outside
Mundelein
11.0%
A Private Facility or
Organization in
Mundelein
16.1%
Another Park District MPRD
2.3% 70.6%
Demographic Differences
• Respondents whose annual household income is $100,000 or more (78.0%) are more likely
than respondents whose annual household income is less than $50,000 (56.4%) and
respondents whose annual household income is $50,000 to less than $100,000 (55.6%) to say
that the MPRD would be their household’s first choice for a fitness center.
• Non-Latino respondents (76.0%) are more likely than Latino respondents (55.7%) to indicate
that the MPRD would be their household’s first choice for a fitness center.
More than one-half (53.3%) of respondents indicate that the MPRD would be their household’s
first choice for a preschool (Figure 10). Those respondents whose household would not select the
MPRD as their first choice for a preschool state that there are not enough Spanish speaking staff
(61.9%) and the price is too high (35.7%).
26Figure 10: Household’s First Choice for a Preschool
Which location would be your household’s first choice for a preschool?
A Private Facility
or Organization
Outside
Mundelein
14.4%
MPRD
A Private Facility or 53.3%
Organization in
Mundelein
30.0%
Another Park District
2.2%
Demographic Differences
• The percentage of respondents who indicate that the MPRD would be their household’s first
choice for a preschool increases with increasing annual household income (less than $50,000,
21.4%; $50,000 to less than $100,000, 40.7%; $100,000 or more, 70.8%).
• Non-Latino respondents (66.7%) are more likely than Latino respondents (39.0%) to report
that the MPRD would be their household’s first choice for preschool.
The respondents were asked what recreational needs of their household were not currently
being met by the MPRD. The respondents comment that they need more sports
programs/activities, such as golf and soccer programs and activities (15.9%) and additional
facilities, such as an outdoor gym, dog park, and walking paths (11.4%). A total of 30.7% of
respondents report their household has no unmet recreational needs (Table 5) (See Appendix C
for verbatim comments).
27Table 5: Recreational Needs Not Currently Being Met by MPRD
What recreational needs of your household, if any, are not currently being met by the
Mundelein Park & Recreation District? (MULTIPLE RESPONSES POSSIBLE)
Recreational Need Percent
Sport Programs/Activities 15.9%
Additional Facility 11.4%
Improved Facilities/Park 8.0%
Nature/Outdoor Programs/Activities 5.7%
Arts and Crafts/Hobbies Programs/Activities 4.5%
Additional Hours/Times 4.5%
Lower Costs 4.5%
Childcare 3.4%
Other Unmet Needs 15.9%
None 30.7%
Don’t Know 2.3%
Other Comments 9.1%
Value of the Mundelein Park & Recreation District
Next, a set of questions about the value of the MPRD was asked. The respondents were asked
about how valuable the MPRD is to their community and how valuable the MPRD is to their
household. The respondents were also asked about the value of age specific MPRD programs to
their household. Lastly, they were asked whether their household would be more likely to enroll
in programs if the MPRD offered financial assistance to eligible households.
Almost all (96.0%) of the respondents believe the MPRD is valuable to their community, with
67.8% indicating it is very valuable. Compared with 85.9% of the respondents who think the
MPRD is valuable to their household, with 54.9% indicating it is very valuable (Figure 11).
28Figure 11: Value of the MPRD
How valuable is the Mundelein Park & Recreation District to …?
Your Community Your Household
Not At All Not At All
Not Very Valuable Not Sure Valuable Not Sure
Valuable 0.7% 3.0% 1.8% 2.8%
0.4% Not Very
Valuable
9.5%
Very
Somewhat
Valuable
Valuable
Very 54.9%
28.2% Somewhat
Valuable
67.8% Valuable
31.0%
Demographic Differences
Value of MPRD to Community
• Respondents aged 30-49 (75.3%) and respondents aged 50-64 (73.9%) are more likely than
respondents aged 18-29 (54.8%) and respondents aged 65 or greater (59.2%) to believe the
MPRD is very valuable to their community.
• Respondents who have children in their household under the age of 18 (71.9%) are more
likely than respondents who do not have children in their household under the age of 18
(60.6%) to believe the MPRD is very valuable to their community.
Value of MPRD to Household
• Respondents aged 30-49 (66.3%), respondents aged 50-64 (57.4%), and respondents aged
18-29 (54.8%) are more likely than respondents aged 65 or greater (36.0%) to believe the
MPRD is very valuable to their household.
• Respondents who have children in their household under the age of 18 (63.5%) are more
likely than respondents who do not have children in their household under the age of 18
(42.6%) to believe the MPRD is very valuable to their household.
The majority (93.8%) of respondents believe the MPRD programs for preschool-aged children are
valuable to their household, with 74.0% reporting the programs are very valuable (Figure 12).
29Figure 12: Value to Household of MPRD Programs for Preschool-Aged Children
How valuable are MPRD programs for preschool-aged children to your household?
Not Very Valuable
Somewhat Valuable Not At All Valuable
1.0%
19.8% 5.2%
Very
Valuable
74.0%
Demographic Differences
• No significant differences are found for value to household of MPRD programs for preschool-
aged children by respondent’s age, respondent’s gender, respondent’s race/ethnicity, annual
household income, location of residence in the MPRD service area, and years living in the
MPRD service area.
Almost all (96.0%) of the respondents state the MPRD programs for grade school-aged children
are valuable to their household, with 81.5% indicating the programs are very valuable (Figure
13).
30Figure 13: Value to Household of MPRD Programs for Grade School-Aged Children
How valuable are MPRD programs for grade school-aged children to your household?
Not Very Valuable
Somewhat Valuable Not At All Valuable
0.8%
14.5% 3.2%
Very
Valuable
81.5%
Demographic Differences
• No significant differences are found for value to household of MPRD programs for grade
school-aged children by respondent’s age, respondent’s gender, respondent’s race/ethnicity,
annual household income, location of residence in the MPRD service area, and years living in
the MPRD service area.
Most (92.8%) respondents report the MPRD programs for teens are valuable to their household,
with 48.2% saying the programs are very valuable (Figure 14).
31Figure 14: Value to Household of MPRD Programs for Teens
How valuable are MPRD programs for teens to your household?
Not Very Valuable
Not At All Valuable
3.6%
3.6%
Somewhat Valuable
44.6% Very Valuable
48.2%
Demographic Differences
• No significant differences are found for value to household of MPRD programs for teens by
respondent’s age, respondent’s gender, respondent’s race/ethnicity, annual household
income, location of residence in the MPRD service area, and years living in the MPRD service
area.
More than four-fifths (83.7%) of the respondents report the MPRD programs for adults are
valuable to their household, with more than one-third (36.2%) indicating the programs are very
valuable (Figure 15).
32Figure 15: Value to Household of MPRD Programs for Adults
How valuable are MPRD programs for adults to your household?
Not Very Valuable Not At All Valuable
13.6% 2.8%
Very
Valuable
36.2%
Somewhat Valuable
47.5%
Demographic Differences
• Female respondents (48.8%) are more likely than male respondents (21.4%) to state that the
MPRD programs for adults are very valuable to their household.
• Respondents aged 30-49 (55.5%) are more likely than respondents aged 18-29 (9.8%) and
respondents aged 50 or greater (20.5%) to indicate that the MPRD programs for adults are
very valuable to their household.
More than four-fifths (85.5%) of the respondents report the MPRD programs for active adults are
valuable to their household, with (46.5%) indicating the programs are very valuable (Figure 16).
33Figure 16: Value to Household of MPRD Programs for Active Adults
How valuable are MPRD programs for active adults to your household?
Not Very Valuable Not At All Valuable
11.8% 2.7%
Very
Valuable
46.5%
Somewhat Valuable
39.0%
Demographic Differences
• No significant differences are found for value to household of MPRD programs for active
adults by respondent’s age, respondent’s gender, respondent’s race/ethnicity, annual
household income, location of residence in the MPRD service area, and years living in the
MPRD service area.
Four out of ten respondents (39.5%) would be more likely to enroll in programs if the MPRD
offered financial assistance to eligible households (Figure 17).
34Figure 17: Likelihood of Enrolling in Programs Increased If MPRD Offered Financial Assistance
If the MPRD offered financial assistance to eligible households for programs, would this make
your household more likely to enroll in programs?
Not Sure
14.1%
Yes
39.5%
No
46.4%
Demographic Differences
• Respondents whose annual household income is less than $25,000 (88.0%), $25,000 to less
than $50,000 (97.6%), or $50,000 to less than $75,000 (80.1%) are more likely than
respondents whose annual household income is $75,000 to less than $100,000 (17.9%),
$100,000 to less than $150,000 (13.8%), or $150,00 or more (16.7%) to report that they would
be more likely to enroll in programs if the MPRD offered financial assistance to eligible
households.
35Future Direction of the Mundelein Park & Recreation District
The next section of the survey was about the future direction of the MPRD. The respondents
were asked to rank the top three priorities the MRD should invest funds in to improve or maintain
in the next five years and to rank the top two priorities the MRD should invest funds in to
construct or develop in the next five years.
Respondents rank Diamond Lake Beach, the Fitness Center, and the Parks as the top three
priorities the MPRD should invest funds in to improve or maintain in the next five years. The
respondents comment that the specific parks they would like to see improved or maintained are
all the parks, Hanharan, Maurice Knoll, Community, Wortham, and Kracklauer. Other responses
include add walking trails and bike paths to parks, add portable restrooms to playgrounds, and
add lights to sledding hill. A total of 3.4% of respondents believe the MPRD should not invest
funds in to improve or maintain any of the facilities and parks asked about in the survey (Table
6).
Table 6: Top Three Priorities the MPRD Should Invest Funds in to Improve/Maintain in the
Next Five Years
Of the existing facilities and parks, please rank the top three priorities you think the MPRD
should invest funds in to IMPROVE/MAINTAIN in the next five years. Select “1” for the first
priority, select “2” for the second priority, and select “3” for the third priority.
Percent Percent Percent Percent Ranked
Facility/Park Ranked 1 Ranked 2 Ranked 3 1, 2, or 3
Diamond Lake Beach 10.8 8.6 14.6 34.0
Fitness Center 21.8 4.1 2.5 28.4
Parks 10.2 10.6 6.5 27.3
Restrooms in Parks 5.2 9.7 8.9 23.8
Barefoot Bay 4.0 8.7 6.7 19.4
Learning Center Preschool 6.3 9.2 0.3 15.8
Community Park 0.7 4.1 10.2 15.0
Ice Skating Rink 0.6 5.7 6.3 12.6
Soccer Fields 4.1 5.4 2.0 11.5
Baseball Fields 8.0 1.8 1.3 11.1
Tennis Courts 7.8 2.5 0.8 11.1
Indoor Pool 4.6 2.4 2.5 9.5
Golf Course 2.8 3.3 3.1 9.2
Regent Center 3.6 2.2 2.1 7.9
36Percent Percent Percent Percent Ranked
Facility/Park Ranked 1 Ranked 2 Ranked 3 1, 2, or 3
Pickleball Courts 1.7 2.4 1.7 5.8
Open Fields 0.0 0.5 4.0 4.5
Heritage Museum 0.2 1.2 2.5 3.9
Gymnasiums 1.6 0.2 1.9 3.7
Diamond Lake Recreation Center 0.8 1.0 1.6 3.4
Spray Park 0.5 0.5 2.0 3.0
Concession Stands 0.7 0.7 1.5 2.9
Dance Studios 0.6 1.8 0.5 2.9
Big & Little Child Development
Center 0.2 1.2 1.1 2.5
Disc Golf 0.0 0.0 0.7 0.7
Skate Park 0.0 0.0 0.4 0.4
Other 0.7 0.1 1.1 1.9
Demographic Differences
• The percentage of respondents who rank Diamond Lake Beach as a top priority for the MPRD
to invest funds in to improve or maintain in the next five years decreases as respondent’s age
increases (aged 18-29, 50.0%; aged 30-49, 35.1%; aged 50-64, 26.1%; aged 65 or greater,
22.0%).
• The percentage of respondents who rank Diamond Lake Beach as a top priority for the MPRD
to invest funds in to improve or maintain in the next five years increases as annual household
income increases (less than $50,000, 17.9%; $50,000 to less than $100,000, 30.2%; $100,000
or more, 40.3%).
• Male respondents (37.2%) are more likely than female respondents (21.3%) to rank the
fitness center as a top priority to invest funds in to improve or maintain in the next five years.
• The percentage of respondents who rank the fitness center as a top priority for the MPRD to
invest funds in to improve or maintain in the next five years increases as respondent’s age
increases (aged 18-29, 0.0%; aged 30-49, 21.6%; aged 50-64, 48.0%; aged 65 or greater,
49.3%).
• Respondents whose annual household income is $100,000 or more (38.1%) are more likely
than respondents whose annual household income is less than $50,000 (18.2%) and
respondents whose annual household income is $50,000 to less than $100,000 (15.1%) to
rank the fitness center as a top priority for the MPRD to invest funds in to improve or maintain
in the next five years.
• Respondents aged 18-29 (54.8%) are more likely than respondents aged 30-49 (17.5%),
respondents aged 50-64 (26.1%), and respondents aged 65 or greater (14.0%) to rank the
37parks as a top priority for the MPRD to invest funds in to improve or maintain in the next five
years.
• Respondents whose annual household income is $100,000 or more (46.3%) are more likely
than respondents whose annual household income is less than $50,000 (10.6%) and
respondents whose annual household income is $50,000 to less than $100,000 (5.7%) to rank
the parks as a top priority for the MPRD to invest funds in to improve or maintain in the next
five years.
• Respondents who have children in their household under the age of 18 (24.8%) are more
likely than respondents who have no children in their household under the age of 18 (12.8%)
to rank Barefoot Bay as a top priority for the MPRD to invest funds in to improve or maintain
in the next five years.
• Respondents who have children in their household under the age of 18 (24.8%) are more
likely than respondents who have no children in their household under the age of 18 (3.2%)
to rank the Learning Center Preschool as a top priority for the MPRD to invest funds in to
improve or maintain in the next five years.
• Respondents aged 18-29 (30.6%) and respondents aged 50-64 (21.7%) are more likely than
respondents who are aged 30-49 (3.1%) and respondents who are aged 65 or greater (9.6%)
to rank Community Park as a top priority for the MPRD to invest funds in to improve or
maintain in the next five years.
• Respondents whose annual household income is less than $50,000 (34.8%) are more likely
than respondents whose annual household income is $50,000 to less than $100,000 (3.8%)
and respondents whose annual household income is $100,000 or more (10.4%) to rank
Community Park as a top priority for the MPRD to invest funds in to improve in the next five
years.
Respondents rank a dog park and an arts and cultural center as the top two priorities the MPRD
should invest funds in to construct or develop in the next five years. Other responses include an
outdoor gym, cross country ski trails, rental boat slips, and a lake with paddleboats. A total of
5.7% of respondents believe the MPRD should not invest funds in to construct or develop any of
the facilities asked about in the survey (Table 7).
38You can also read