MVV Environment, Energy from Waste Combined Heat and Power Facility, North Yard, Devonport - Community Ambient Air Quality Monitoring Programme ...
←
→
Page content transcription
If your browser does not render page correctly, please read the page content below
MVV Environment, Energy from Waste Combined Heat and Power
Facility,
North Yard, Devonport

Community Ambient Air Quality Monitoring Programme Report
Quarter 2, 2020
Overview of Monitoring Programme

MVV started ambient air quality monitoring in the vicinity of the EfW CHP Facility in
August 2014. Two pollutants are measured in the on-going survey, Nitrogen Dioxide
(NO 2 ) and particulate matter (as PM 10 ). Monitoring of NO 2 is carried out at ten
locations in the area. A PM 10 real time monitoring station was installed in 2014 in the
vicinity of Camels Head junction and is required to monitor until October 2020.
Nitrogen Dioxide

Oxides of nitrogen (NO X ) are formed at the high temperatures and pressures found
within vehicle engines and other combustion processes. Some of the nitrogen in the
air and the fuel, mainly in the form of nitric oxide (NO), is oxidised to form NO 2 in the
atmosphere. NO 2 is associated with adverse effects on human health and it is this
pollutant for which air quality standards have been set in the UK and elsewhere within
the EU.

Diffusion tubes are used to measure levels of NO 2 within an area. These are small
plastic tubes containing a chemical absorbent which reacts with NO 2 present in the
air. The tubes are changed each month and then sent away to a laboratory for
analysis. The results give a NO 2 level for each calendar month and these are used to
derive an annual average which can be compared against the National Standards
annual average air quality objective.

Particulate Matter

Particulates, alternatively referred to as particulate matter (PM), are tiny solid particles
or liquid droplets suspended in a gas. Sources of particulate matter can be man-made
or natural. Concentrations of particulate matter within the air can be expressed in
terms of their size, for example PM 10 represents particles of 10 µm diameter or less.
PM 10 occurs naturally, originating from volcanoes, dust storms, forest and grassland
fires, living vegetation and sea spray. Human activities also generate PM 10 , from
sources such as road transport, power plants, agriculture, various industrial processes
and local domestic heating.

A specialised air quality monitoring unit measures small particulate matter as they as
drawn into the machine. The dust particles pass through a light from a long-life LED
source, and as they do so generate a scattered light impulse. Measuring the deflection
and intensity of this light impulse allows the size and number of particles to be
detected. Measurement is continuous, and a result is generated every five minutes.
These results allow a daily average to be generated from which an annual average
can be determined; both figures can then be compared to the National Standards.

Locations

The NO 2 monitoring sites have been divided between the area around the Camels
Head junction (which could potentially be affected by emissions from site-related road
traffic) and other locations representative of the urban background in St Budeaux and
King’s Tamerton The PM 10 real time monitor is in the vicinity of Camels Head junction.

                                                                                 2|Page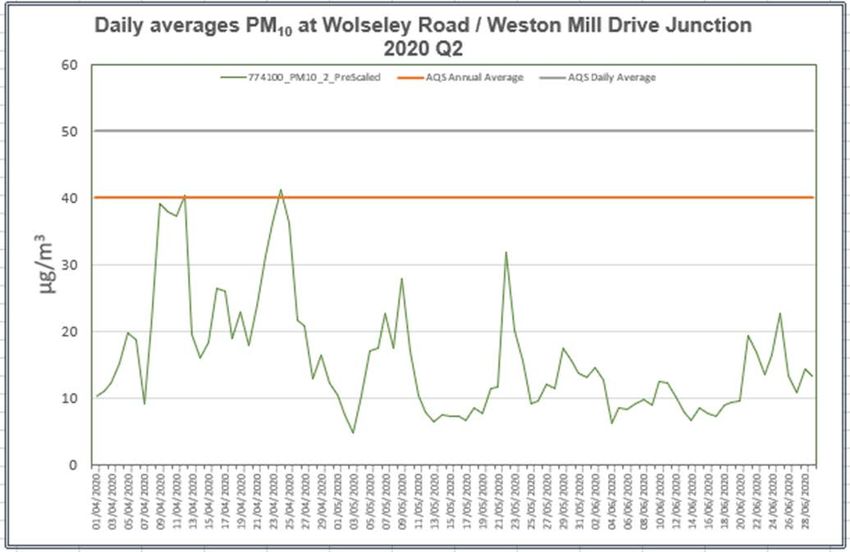
National Standards
The national air quality objective values, against which the monitoring results are
compared, are shown in the Table below:

 AIR QUALITY OBJECTIVES SET IN UK REGULATIONS
 Pollutant                Averaging      Objective Value                                          Maximum Permitted
                          Period         (µg/m3)                                                  Exceedances
 Nitrogen dioxide (NO 2 ) Annual average 40                                                       None

                                 Hourly average                  200                              18 hours per year

 Particulate          matter     Annual average                  40                               None
 (PM 10 )
                                 Daily average                   50                               35 days per year

2020 Quarter 2

This quarterly update presents the results of monitoring carried out during April, May,
and June 2020.

1. Operational or Other Activity

During this time, the EfW CHP facility was operating normally with scheduled periods
of upkeep, maintenance, and repair.

During this period there has been a reduction in vehicular movements in the local
vicinity due to the national lockdown imposed by government on the 20th March until
early June.

2. NO 2 Diffusion Tubes

Apr:10 tubes deployed 06/04/2020, 10 recovered 11/05/2020, results received 03/06/2020.
May:10 tubes deployed 11/05/2020, 10 recovered 11/06/2020, results received 13/07/2020.
Jun:10 tubes deployed 11/06/2020, 10 recovered 09/07/2020, results received 06/08/2020.
*(minor disruptions to issue of tubes, deploying, recovery and analysis during lockdown period)

3. PM 10 Monitor maintenance, service or down time

Monitors operational and serviced throughout quarter.

                                                                                                              3|Page
4. NO 2 Diffusion Tube Monitoring

Note: Results shown include an adjustment for laboratory blank but are provisional
until bias adjustment has taken place.

Three Monthly Monitoring.

The results of the monitoring for the three-month period April to the end of June 2020
are shown in the graph below.

                                                              Monthly NO2 concentration

                          60
                                                                  Apr-20          May-20           Jun-20

                          50
  Concentration (µg/m3)

                          40

                          30

                          20

                          10

                           0
                                Camels    Carlton    Weston      Weston        Erith   York Road    Cardinal    Ferrers    Roman Kelly Close
                                 Head     Terrace   Mill School Mill School   Avenue      (T6)      Avenue     Road (T8)   Way (T9) (T10)
                               Junction    (T2)        (T3)        (T4)        (T5)                   (T7)
                                 (T1)

                                                                                                                                    4|Page
Summary of Results
A summary of results to date are shown in the Tables below where the rolling 12-
month average can be directly compared with the Annual Air Quality mean objective.
The mean concentrations to date are seen to be within the air quality objective of 40
µg/m3 at all the monitoring sites.
5|Page5. PM10 Monitoring
Note 1: All results shown are provisional until calibration has taken place.
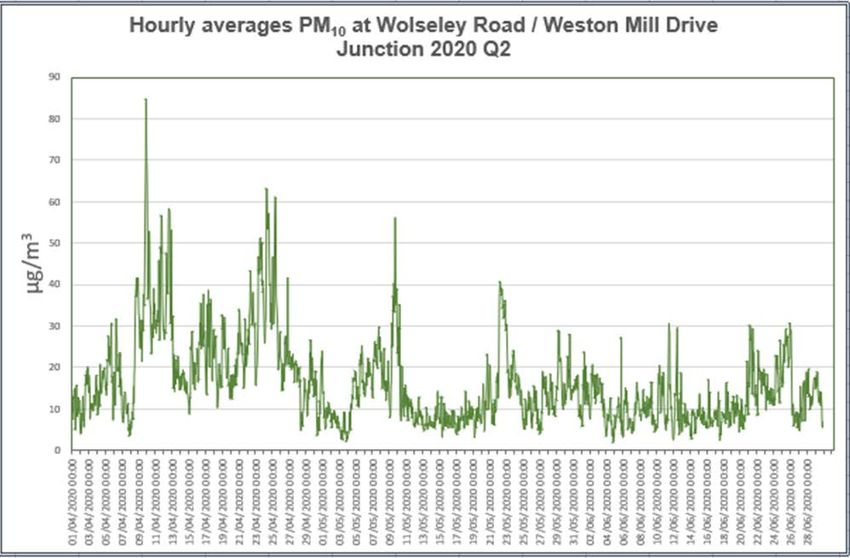
Hourly PM10 Concentrations
24-hour PM10 Concentrations
6|PageSummary of Results
A summary of results to date are shown in the table below. The mean concentration
for this quarter is seen to be within the AQS annual air quality mean objective of 40
µg/m3.
The highest individual value recorded in 2020 was 45.9 µg/m3 on 27th March. The
AQS 24-hour average of 50 µg/m3 was not exceeded during this period.
Data capture for Apr, May and Jun was 100%.
PM 10 MONITORING AT THE CAMELS HEAD JUNCTION
Results April - June 2020
Minimum recorded value (µg/m3) 4.821
Maximum recorded value (µg/m3) 41.308
Average (µg/m3) 15.89
Standard Deviation (µg/m3) 3.438
Data Capture (%) 100
Number of 24-hour periods with average above 50 (mg/m3) 0
Summary to date
Average 15.23
2014 Number of 24-hour periods with average >50 (mg/m3) 0
Average (to date) 12.56
2015 Number of 24-hour periods with average >50 (mg/m3) 0
Average 10.49
2016 Number of 24-hour periods with average >50 (mg/m3) 0
Average 6.51
2017 Number of 24-hour periods with average >50 (mg/m3) 0
Average 5.14
2018 Number of 24-hour periods with average >50 (mg/m3) 0
Average 14.93
2019 Number of 24-hour periods with average >50 (mg/m3) 1
Average 16.2
2020 Number of 24-hour periods with average >50 (mg/m3) 0
KEY:
Air quality standard not exceeded
Air quality standard exceeded
All results to date are subject to calibration of the machine.
Chimney Emission Data
Chimney emission data for the MVV Environment Devonport EfW CHP Facility is
published weekly on the MVV website
https://www.mvv.de/en/mvv_energie_gruppe/mvv_umwelt/beteiligungen/mvv_enviro
nment_1/devonport/links_downloads/index.jsp
7|PageYou can also read